Michel Kuenemann
-
Measurement panel replacement (19 July 2015)
07/19/2015 at 14:11 • 0 commentsMotivations
Last year I had a loose contact in the irradiance (= available solar power) measurement panel. I fixed this issue in August 2014 but it appeared again recently.
The irradiance measurement gives the maximal solar power available at any moment. This figure is of premium importance in a PV system because it sets the target for optimal system yield. Any abnormal deviation from this curve be easily detected.
For example, the following chart shows the irradiance measured on the first of July 2015:
The nealy perfect smoothness of the curve indicates that the sky was perfectly clear during all the day. The peak available power reached 3800 Watts at noon (see left scale).
![]()
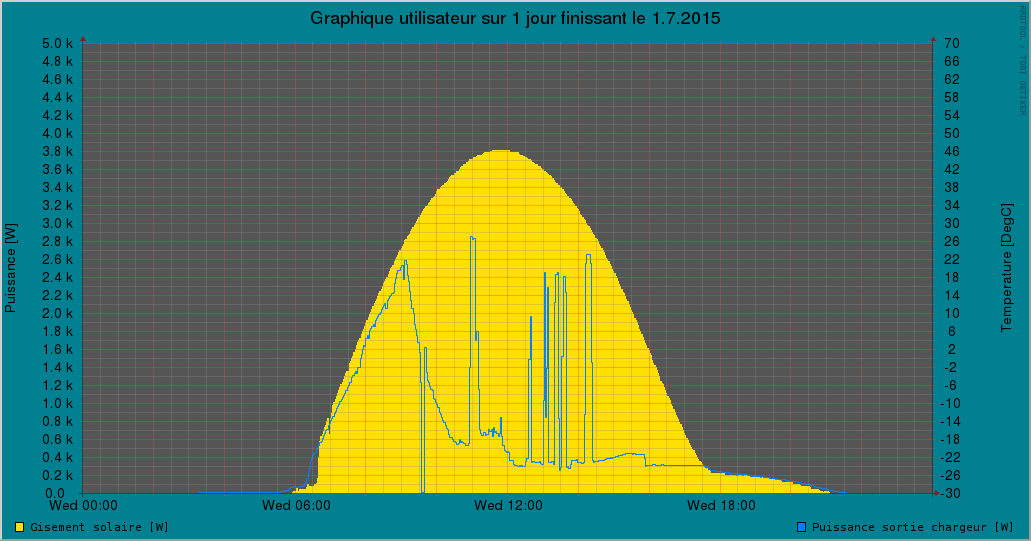
On this second curve the yellow surface is the irradiance during the same day and the blue line indicates the power delivered by the battery charger :
![]()
One can see that the blue line roughly follows the yellow curve in the morning and then decreases (probably) exponentially once the battery gets charged (at 9 o'clock). The peaks during the day depict sudden and temporary increases of consumption due to dishwasher or washing machine operation, for example. One can easily see that even during the heavy consumption moments, a surplus of solar power was still available. By the end of the day the blue line sticks again to the yellow one because the available power is then below the house's needs, so the available power is fully used by the system. Without the irradiance curve (yellow background), these interesting observations would have been impossible to make.
So I decided to replace the whole panel. I purchased a new 10 Watt polycristalline panel on Ebay.
Adaptation and Integration of the new panel
The new panel is a bit smaller than the old one, but it should fit in the existing location. I made following adaptations to this panel before its integration in the system :
- Drilled a 4 mm hole in the aluminum chassis for temperature sensor monting (LM35 in TO92 package inserted in a crimp terminal)
- Added two 20 X 15 mm bakelite rods to increase the thickness of the panel (glued with epoxy)
- Removed the protection diode
- Put a 2.2 Ohm 2 Watt shunt resistor across the output terminals
- Glued the decoration LEDs strip and controller
- Wired the voltage sense terminals
Electrical aspects
The old panel had a 1 Kw/m² short circuit current of 1.4 A. It was equipped with a 1 Ohm shunt resistor. So with a 1 Kw/m² of solar power, 1.4 V appeared across the shunt resistor.
The new panel has a 1 Kw/m² short circuit current of 0.6 A. It is equipped with a 2.2 Ohm shunt resistor. So with a 1 Kw/m² of solar power, 1.32 V appeares across the shunt resistor. This value is close to the previous one, so it will be easy to recalibrate the acquisition software (SFIT module).
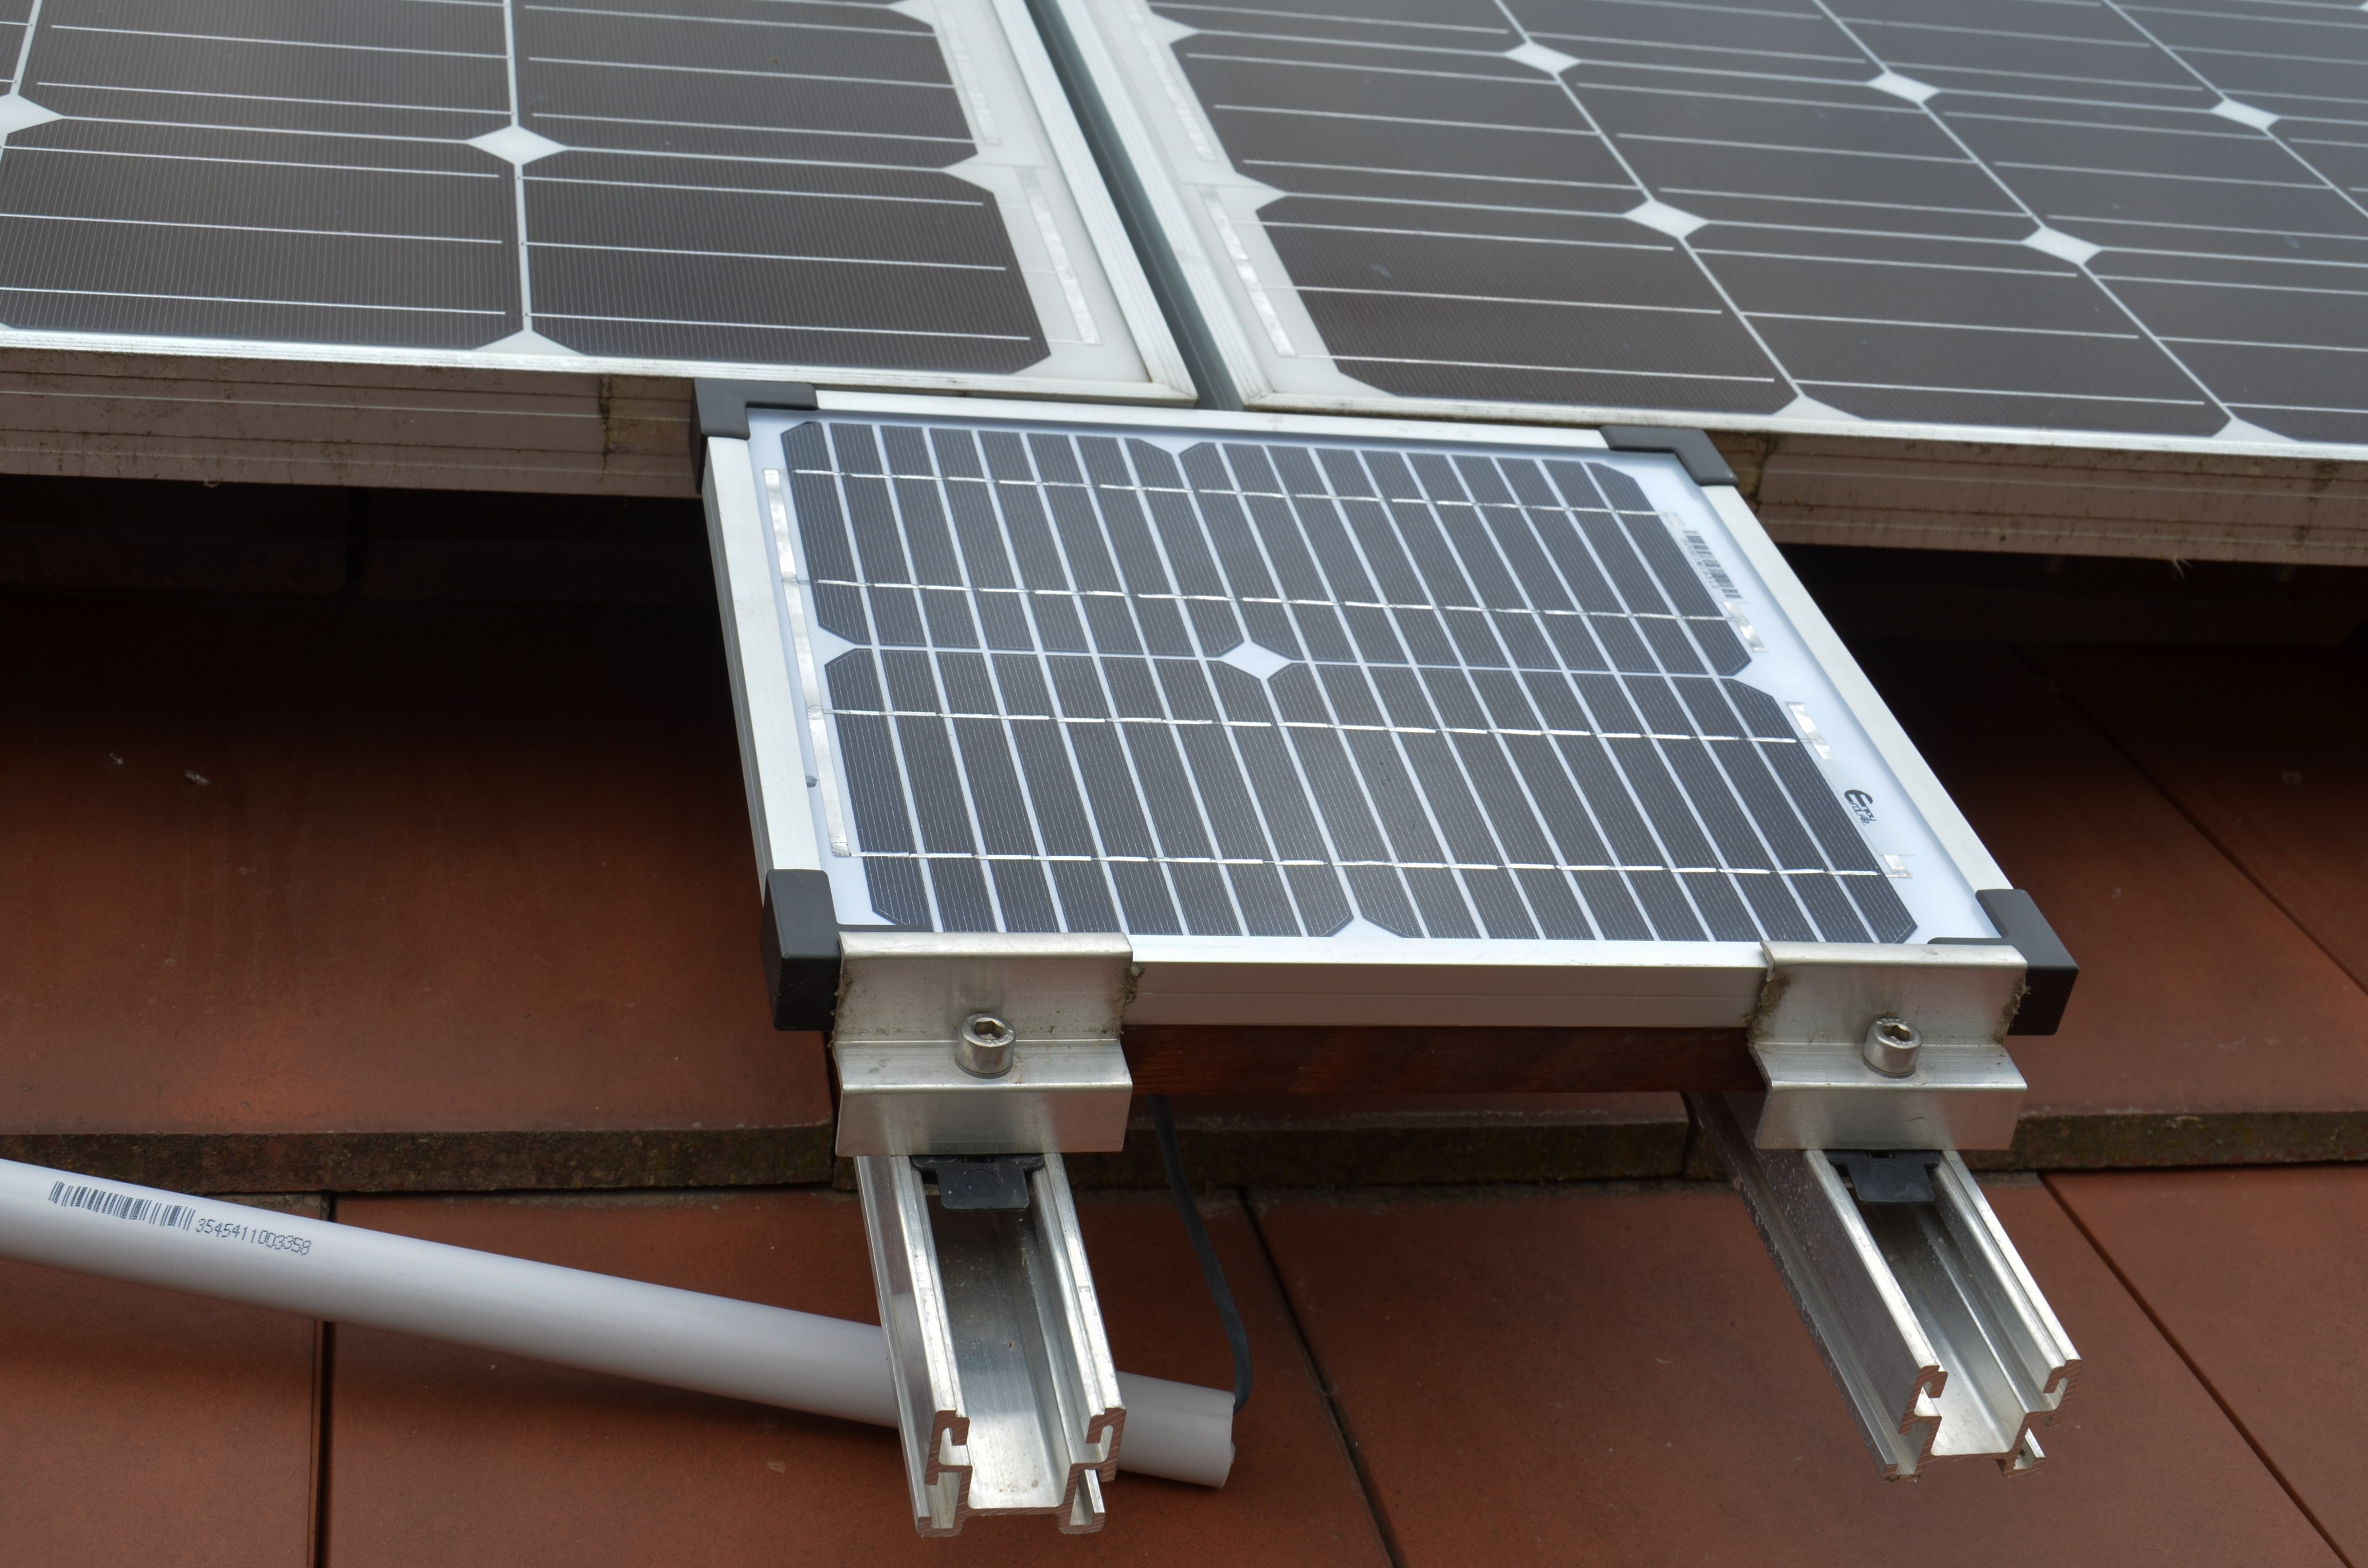
The faulty panel during removal. ![]()
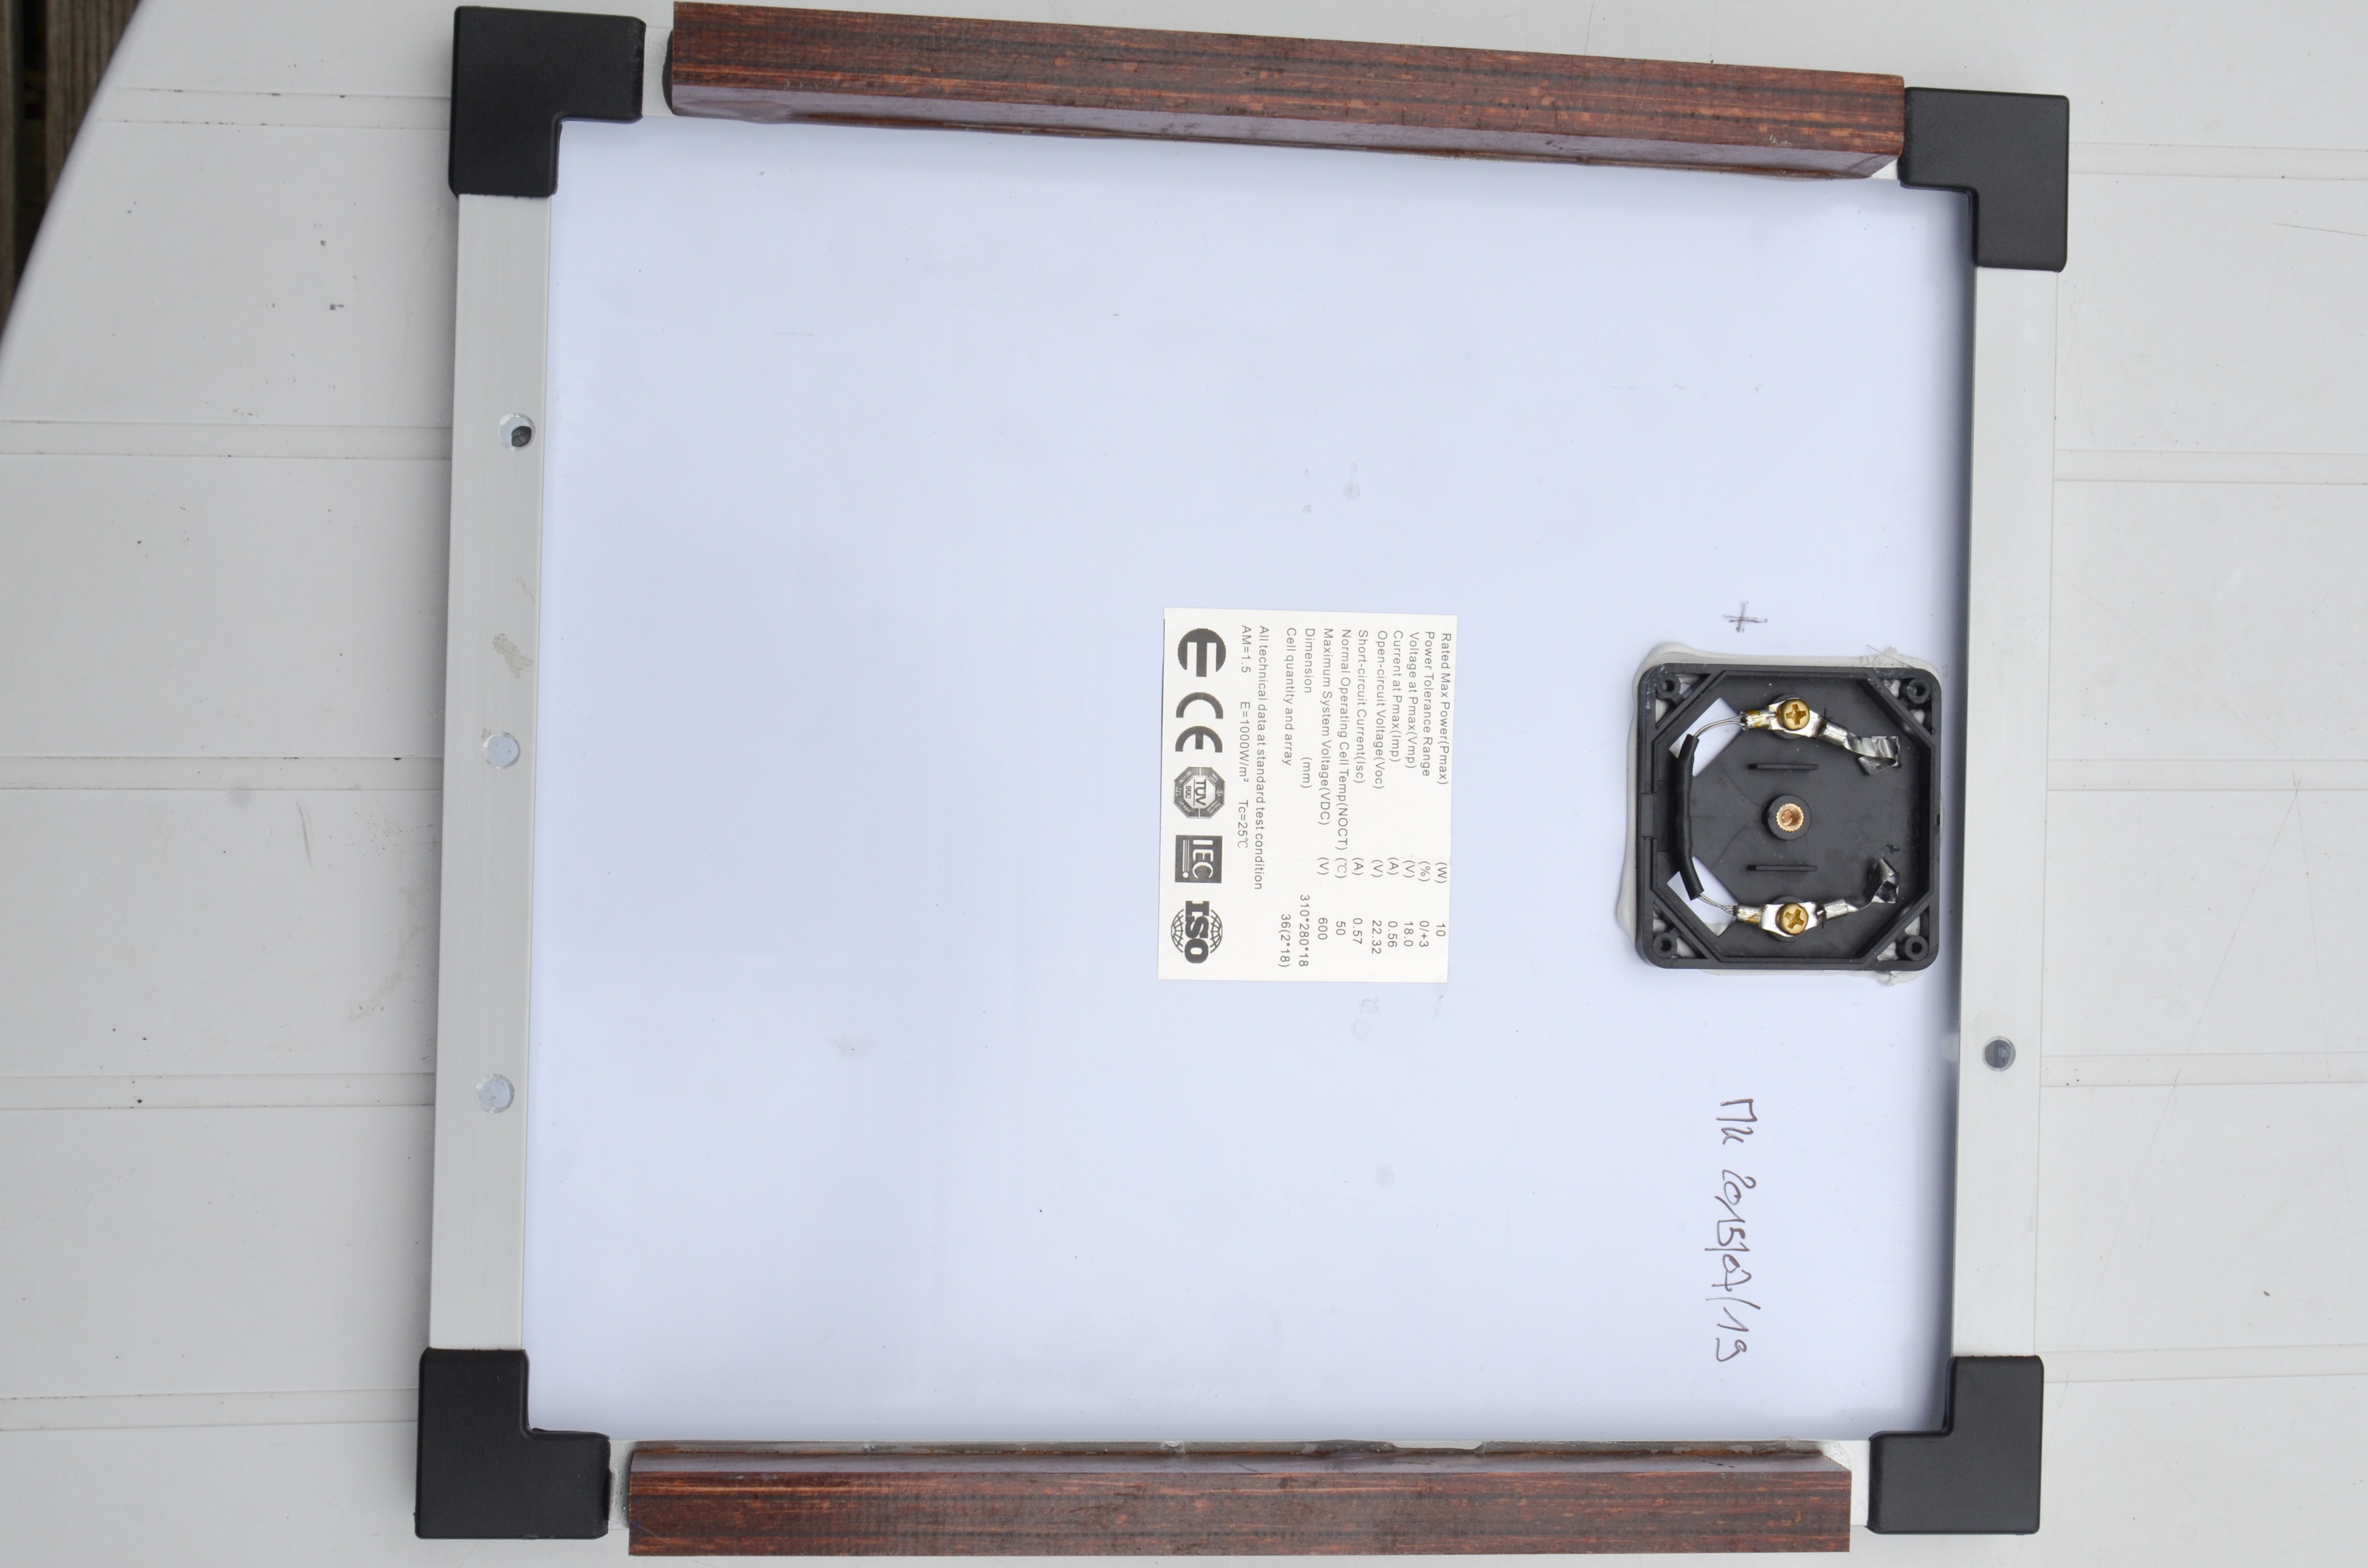
The new panel equipped with a 2.2 Ohm
shunt resistor. The diode has been removed.
Two bakelite rods are added to increase the
thickness of the panel to the standard value
of 40 mm.![]()
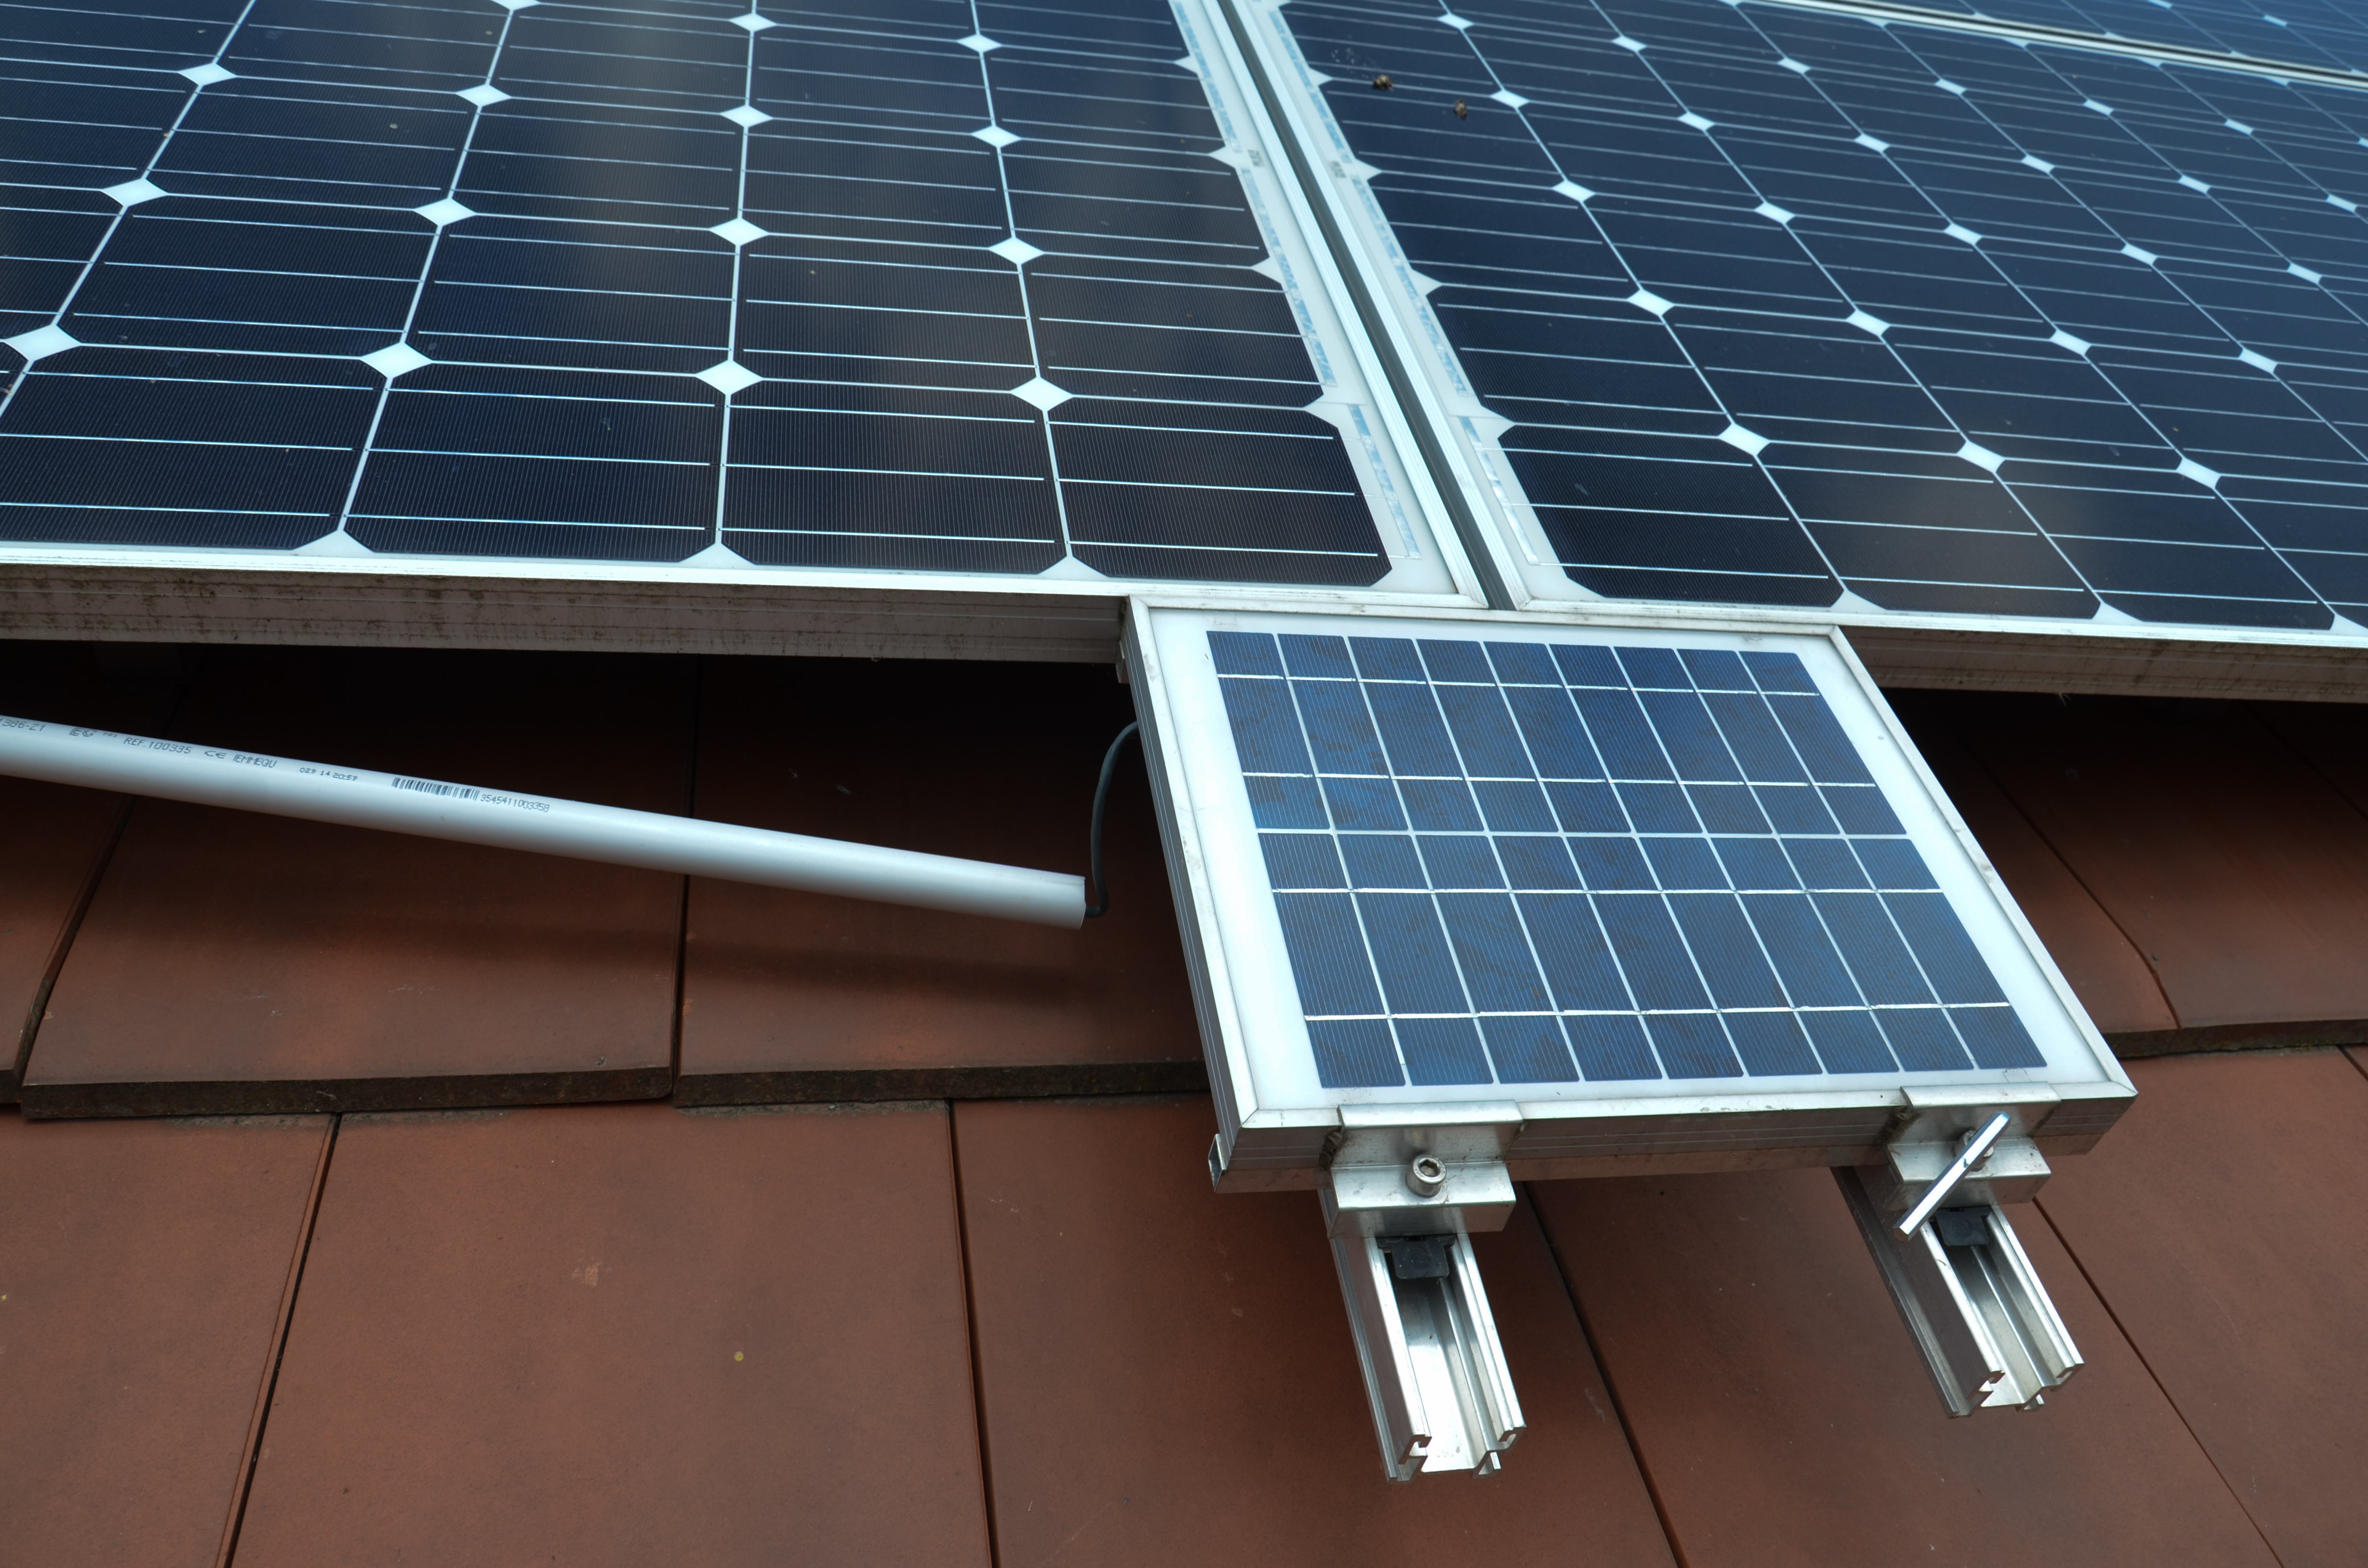
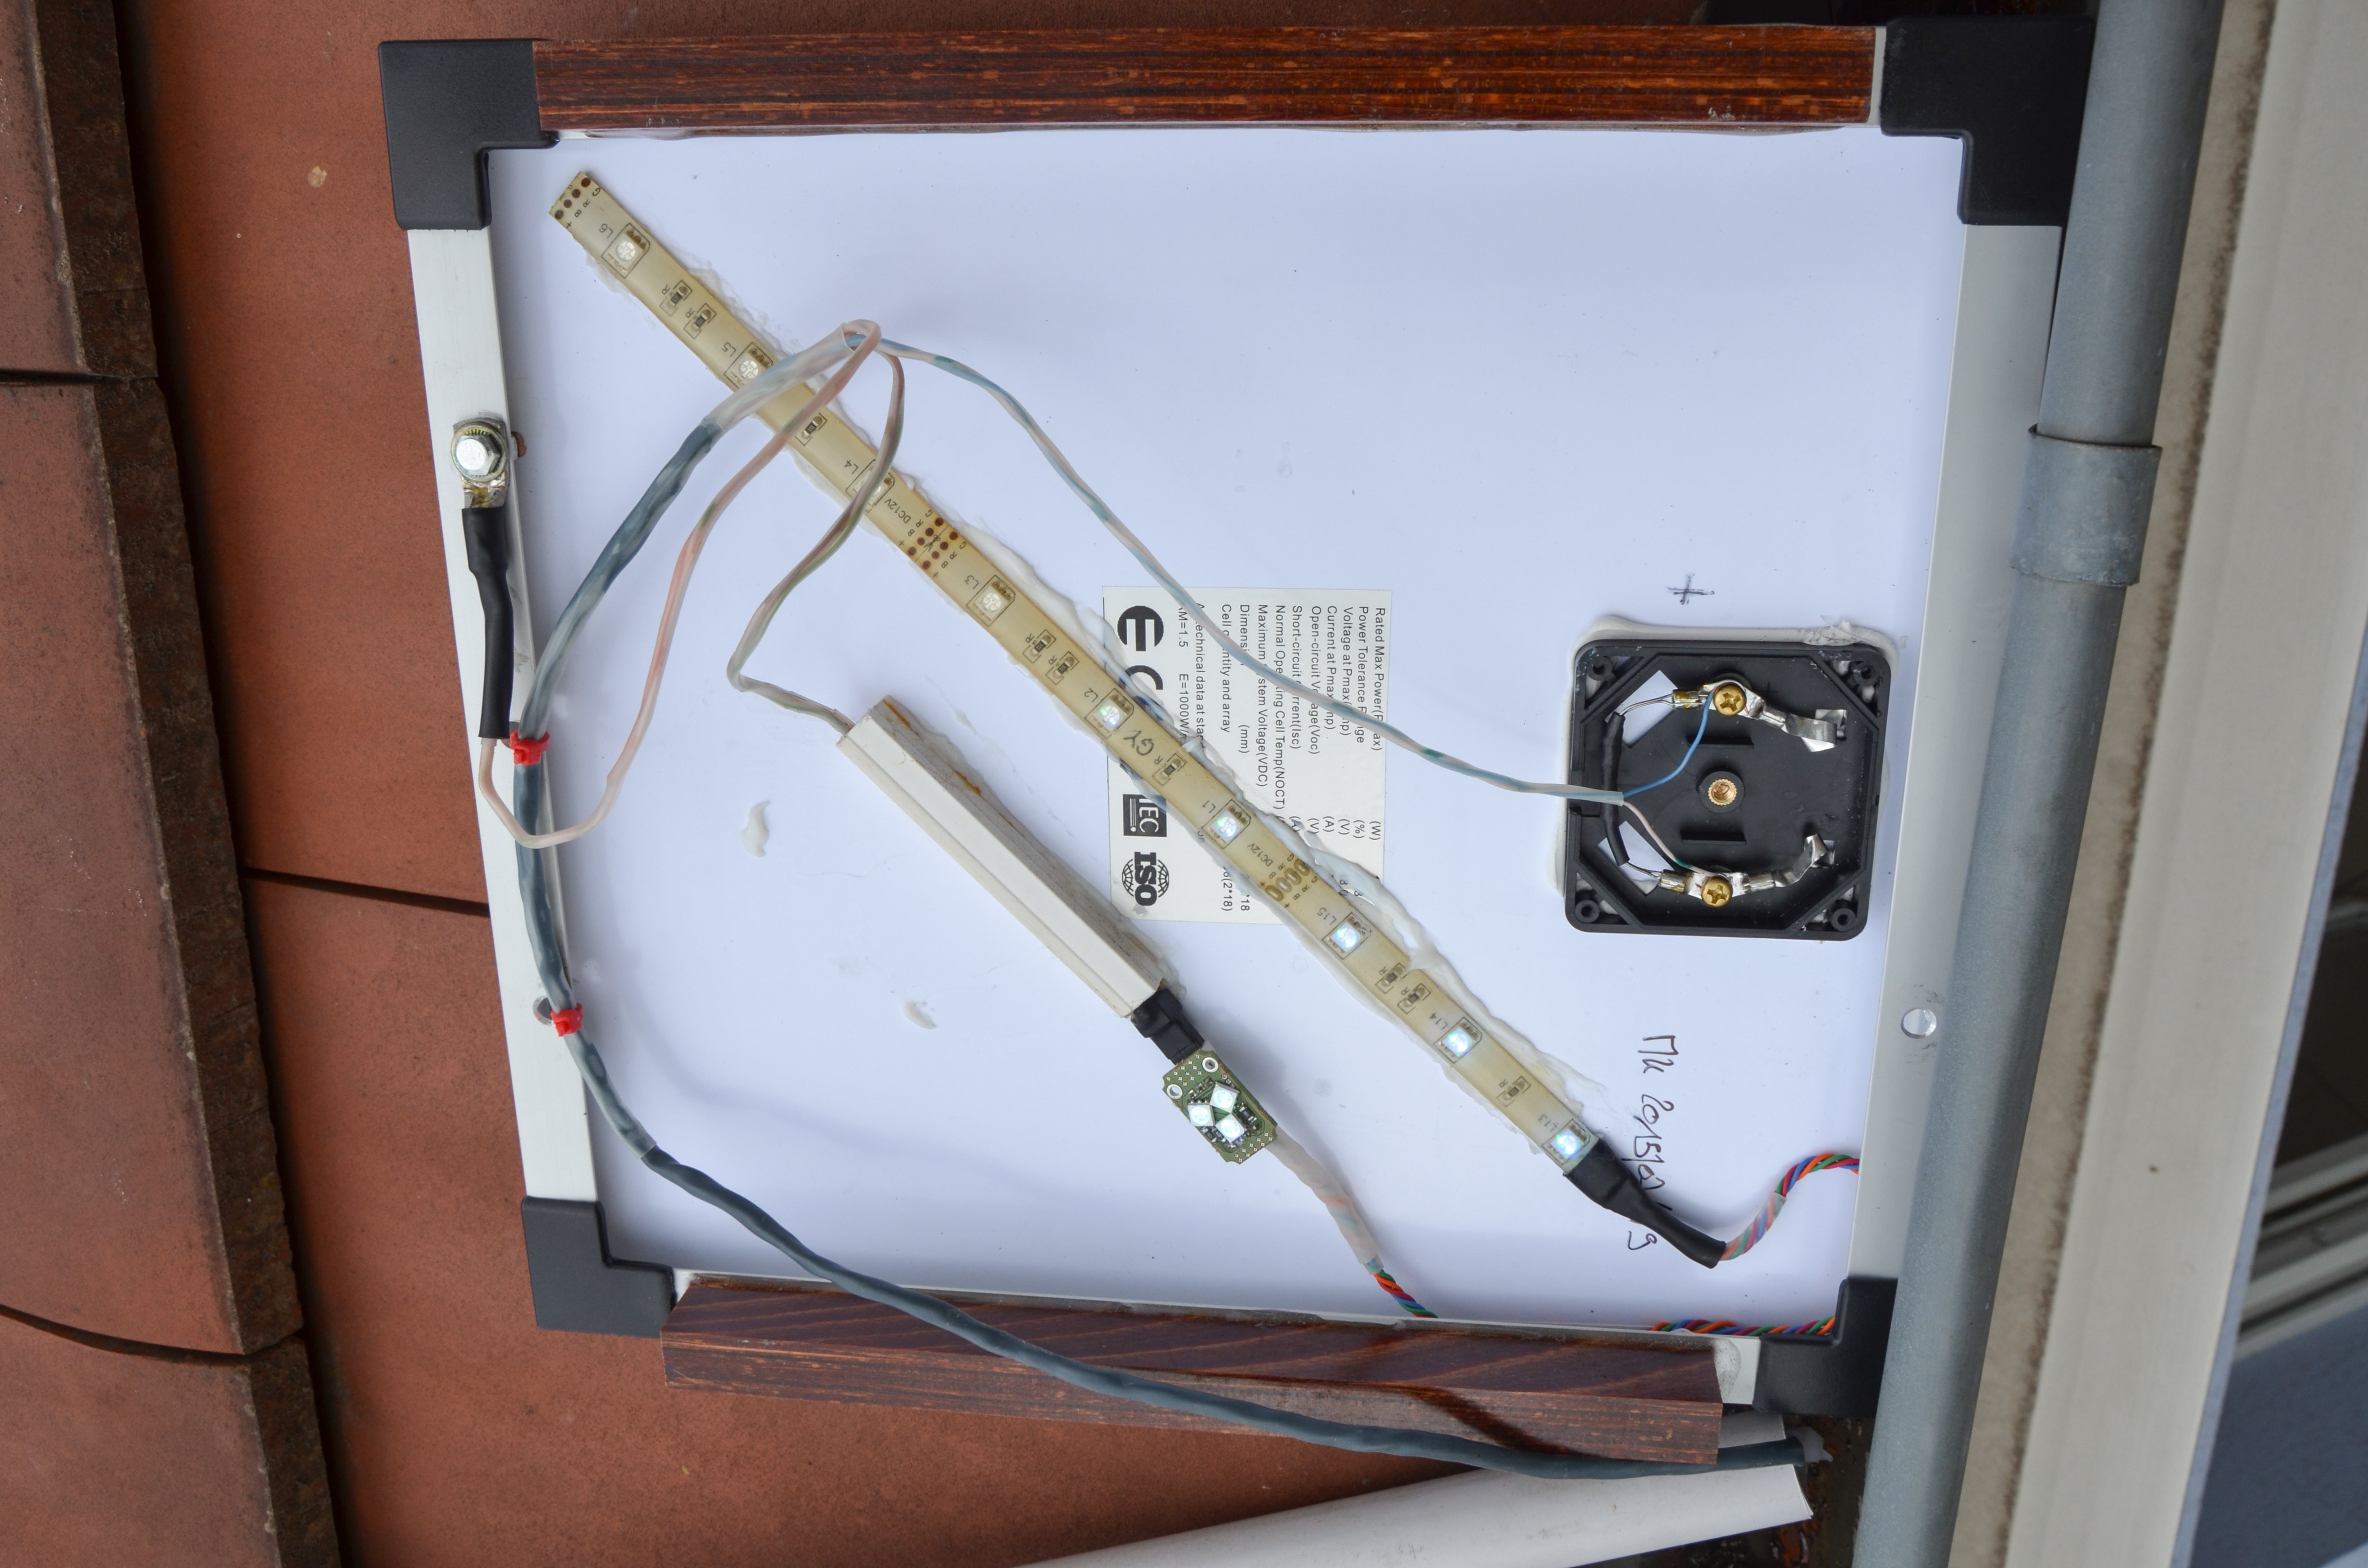
The new panel equipped with the temperature sensor,
on the left, and the LED strip, placed diagonally.
The output voltage is measured across the 2.2 Ohm
shunt resistor. When the sun shines with a rate of 1 Kw/m²,
the output voltage is 0.6 A * 2.2 Ohm = 1.32 V.![]()
The new panel installed and tested. ![]()
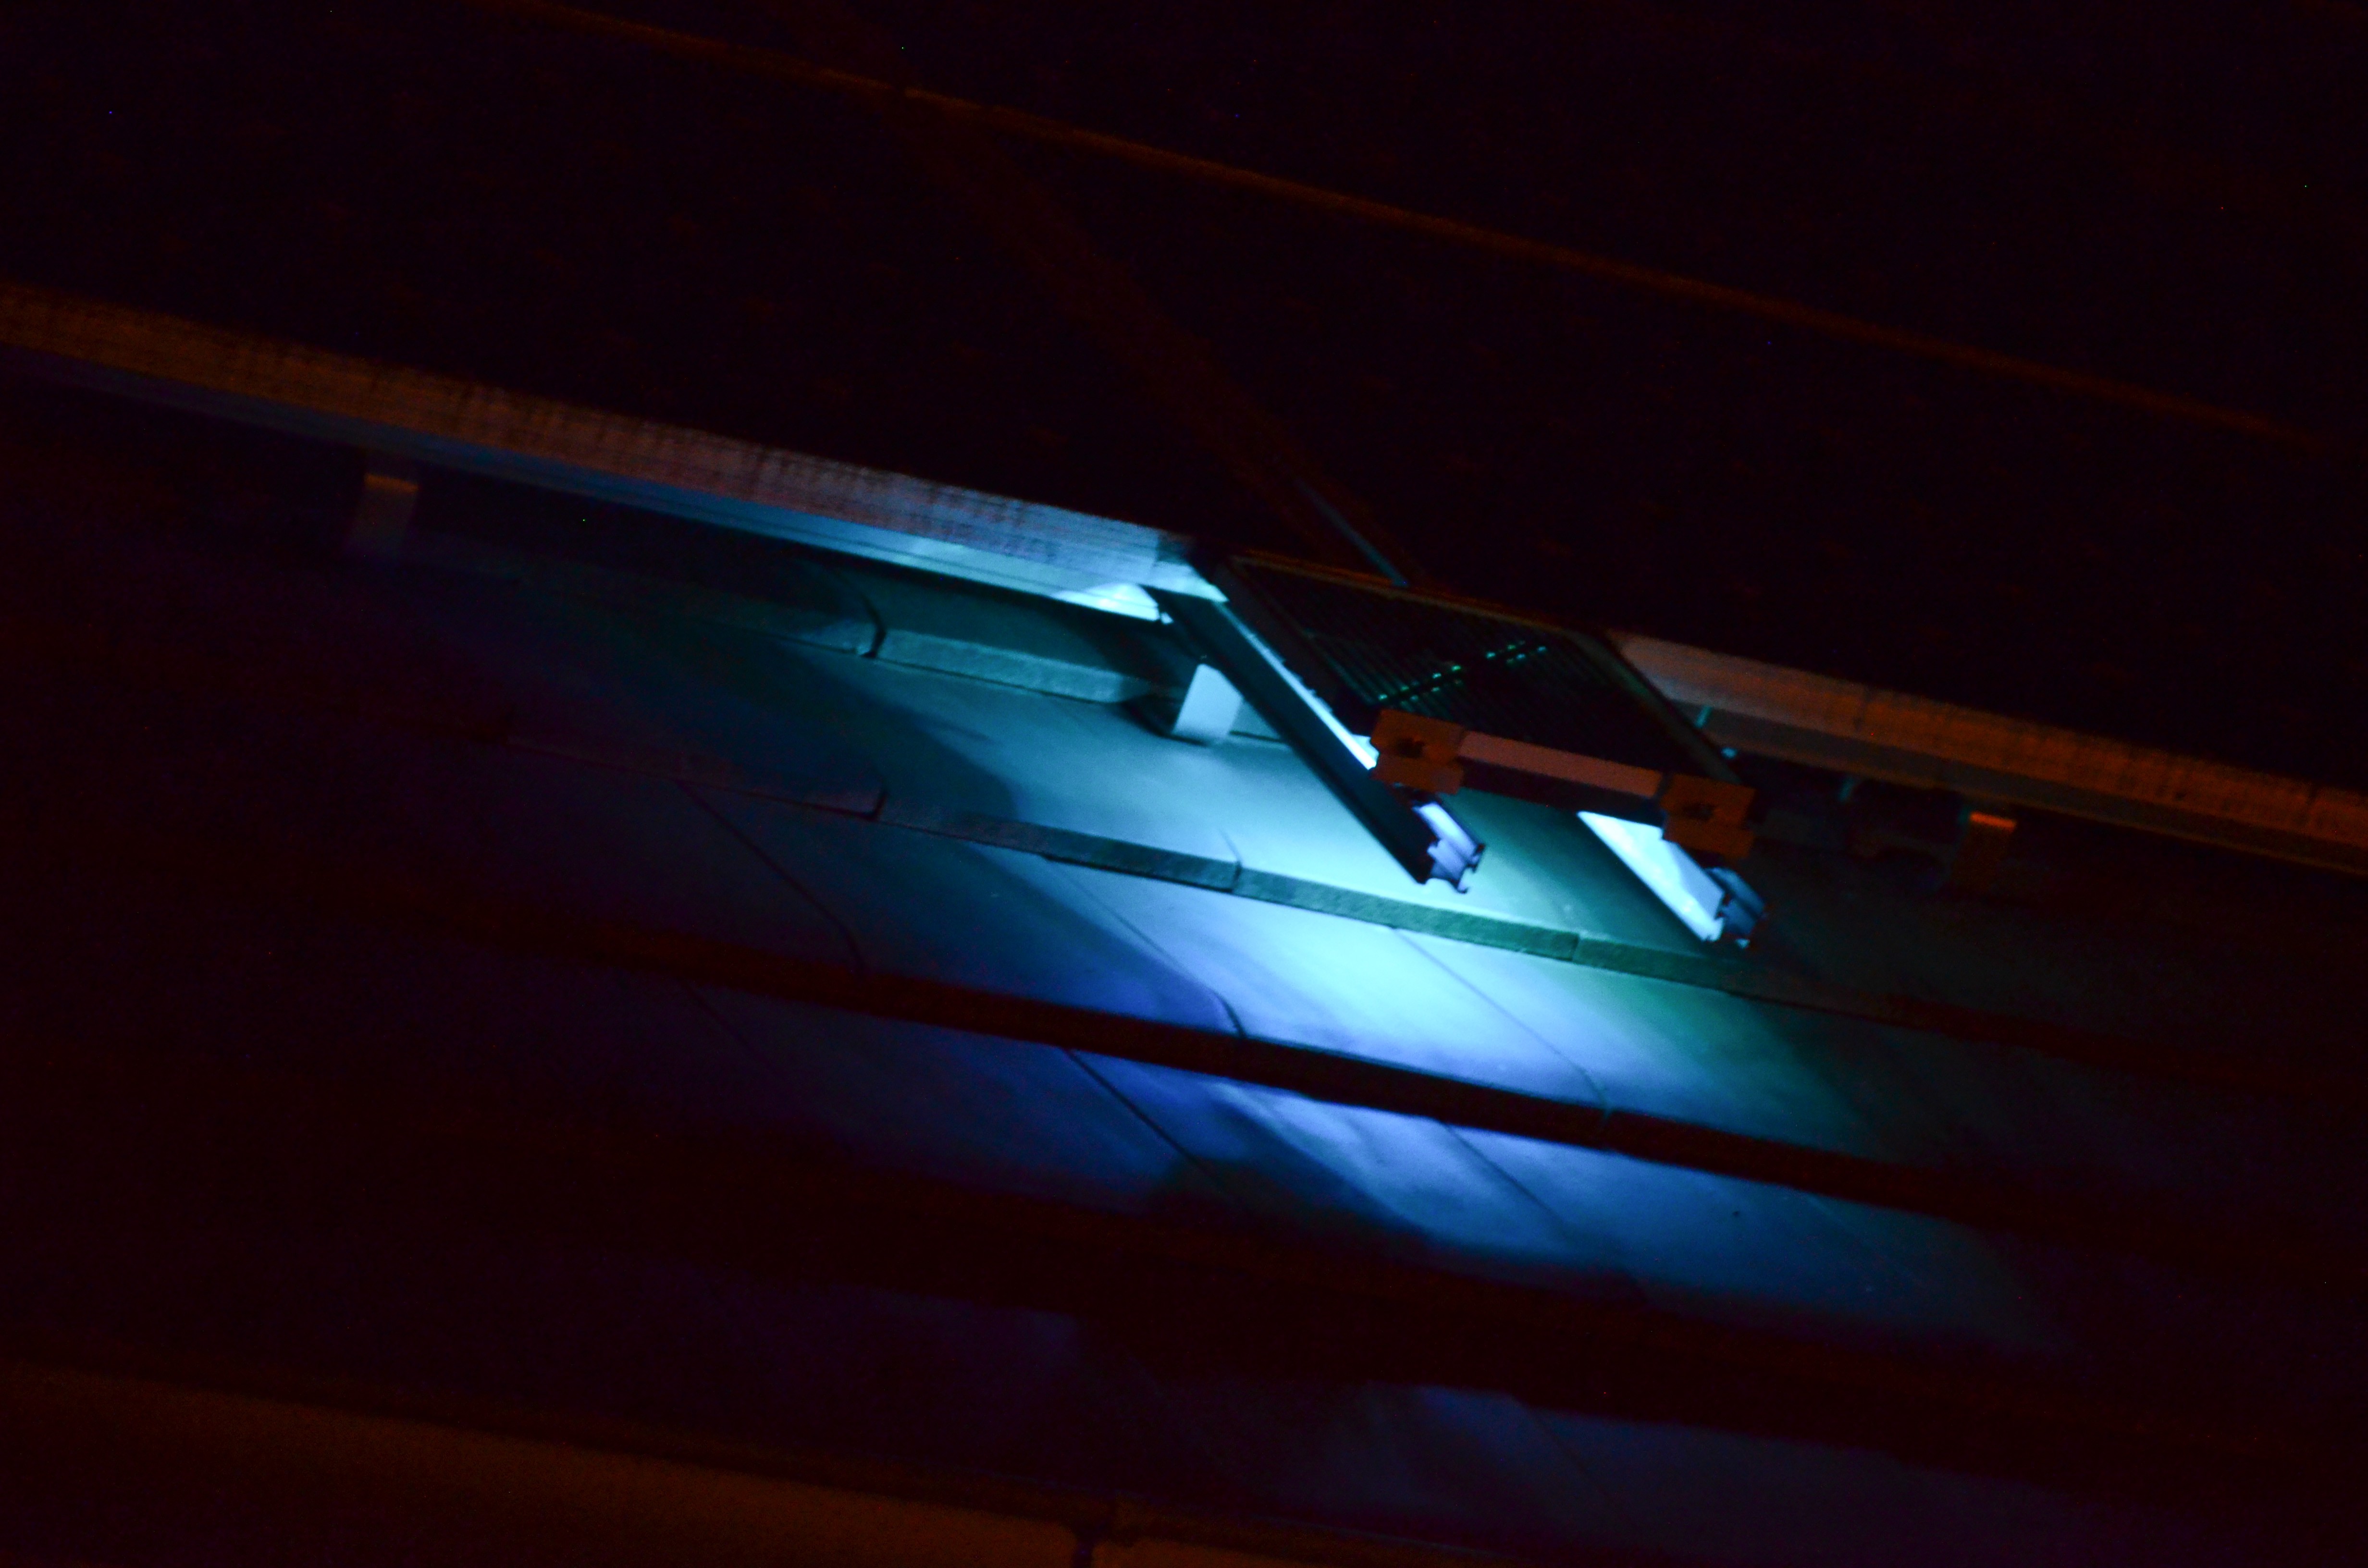
The new panel deco lighting works perfectly in Solar mode:
The color is a mix of blue and green (cyan)
The LED controller is available here![]()
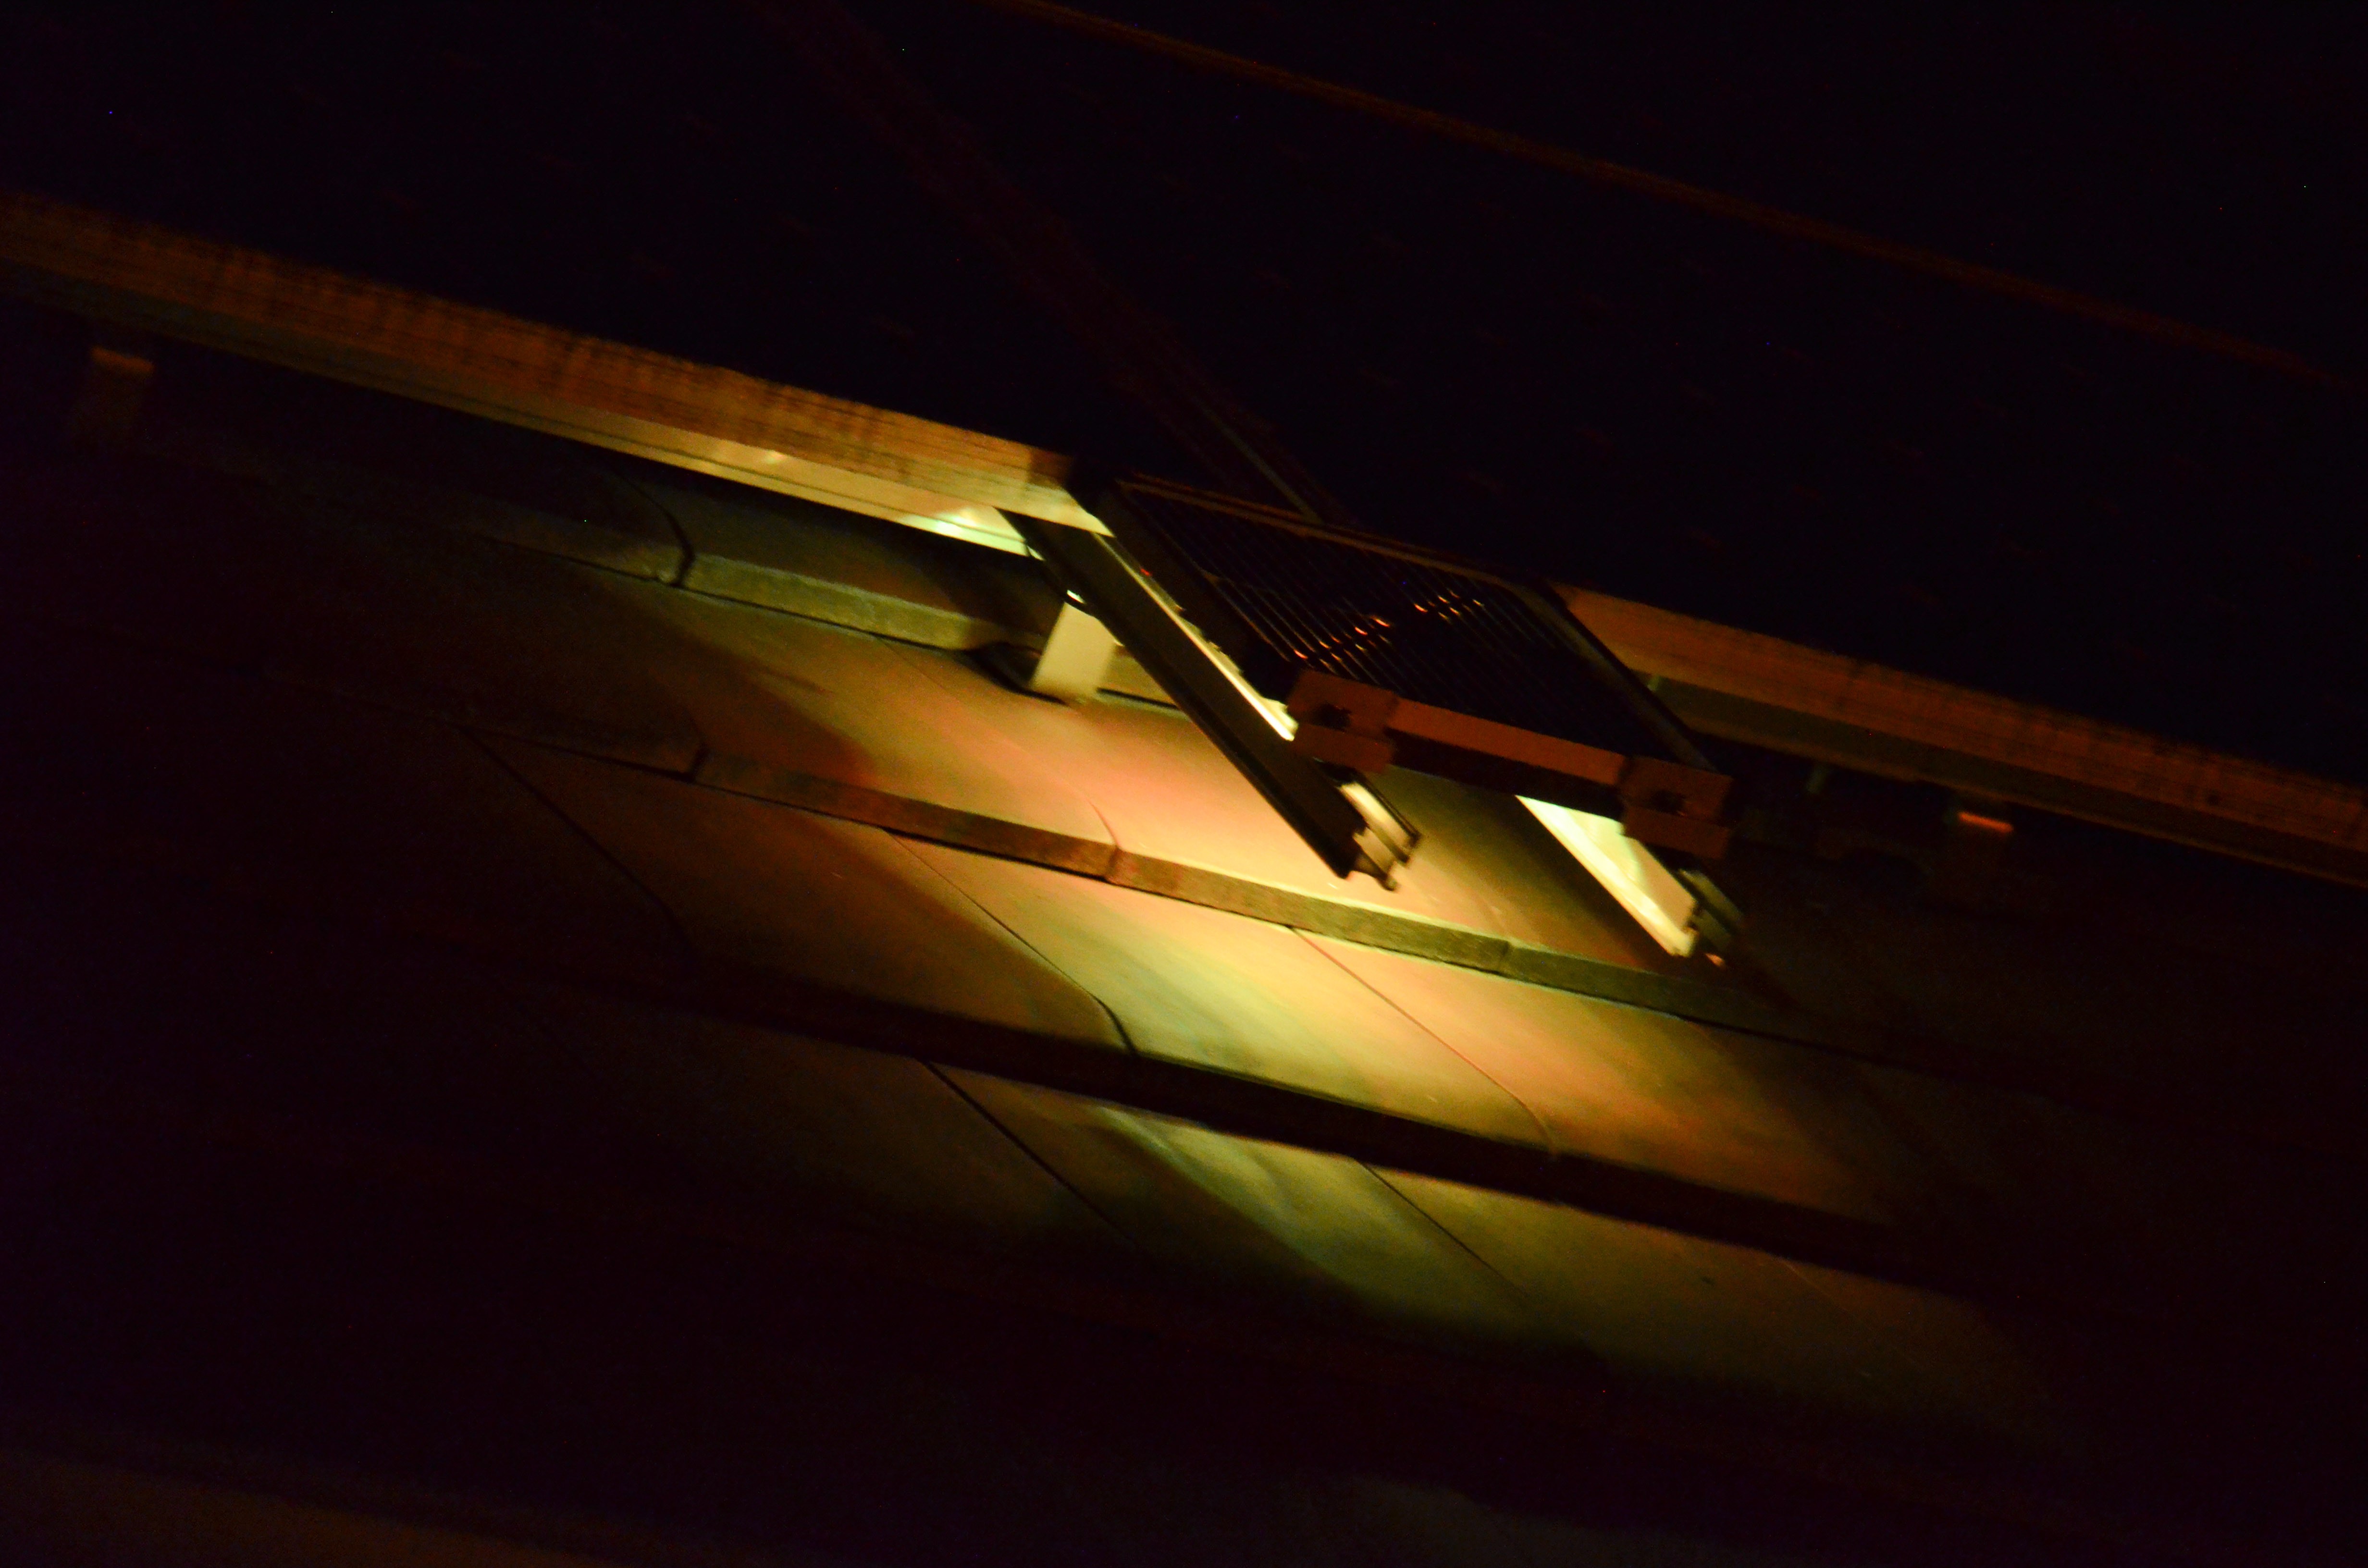
and also in Grid mode:
The color is a mix of red and green (kind of yellow)![]()
Today's curves after panel replacement
The new panel has been put into service at approx. 1 PM. One can see that from this moment on, no more discontinuities (interruptions) appear in the yellow irradiance curve:
![]()
-
Solar Eclipse
03/21/2015 at 08:37 • 0 commentsA partial solar eclipse occured yesterday (20 mar 2015). According to the astronomical data, In my place, the sun lost 72.5 % of its power at 10:34 AM.
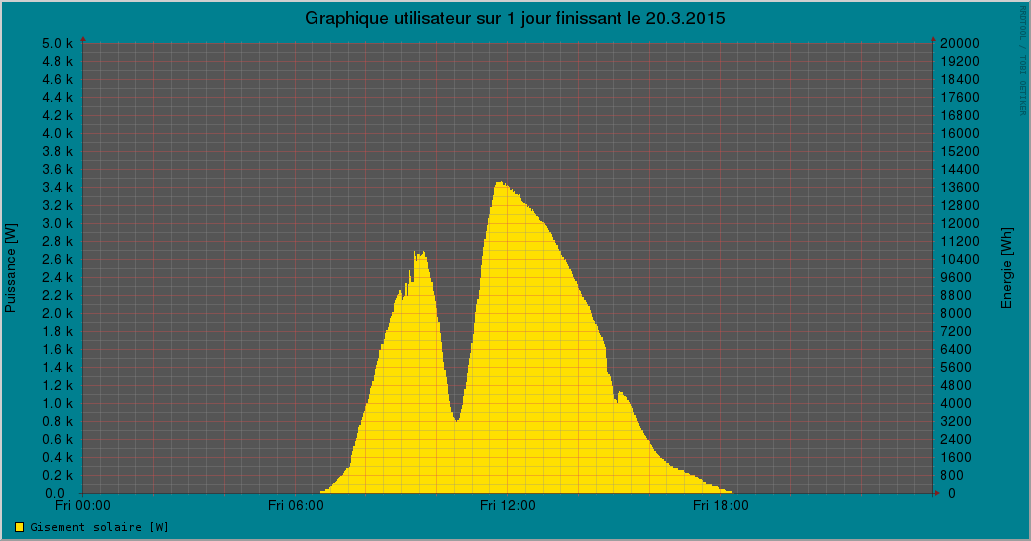
On the graphics below one can clearly see the impact of the eclipse on the available electrical power during the phenomenon. The minimum occurs a few minutes after 10:30. At this moment, the available power was very close to 800 Watts (see left hand scale). By graphical interpolation one can determine the power that would have been available without the eclipse: approximately 3000 Watts.
Maximal loss of power during the eclipse = (1 - 800/3000) = 0,733 = 73 %. This is very close to the forecast.
The eclipse had no adverse impact on the total production because the overall available energy was still greater than 10 KWh.
![]()
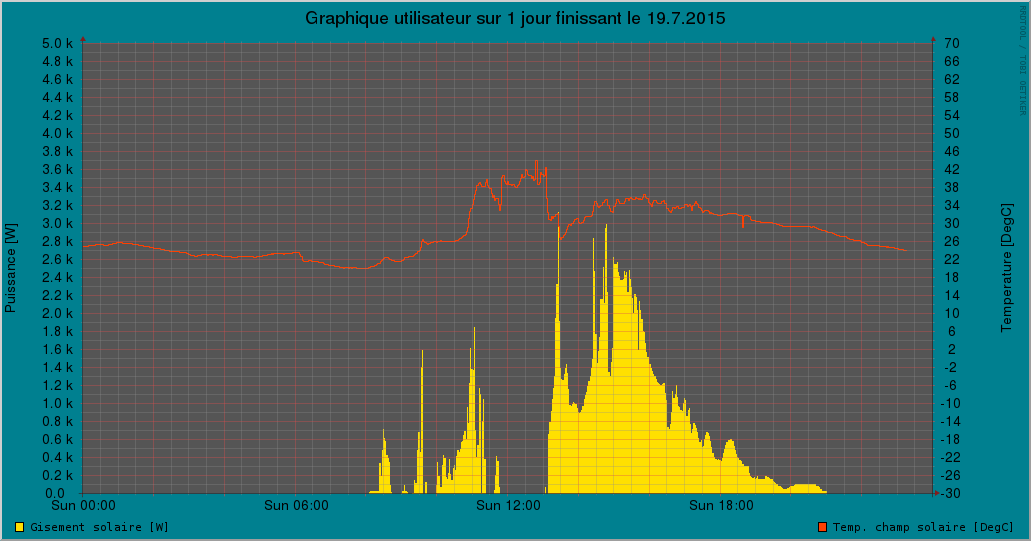
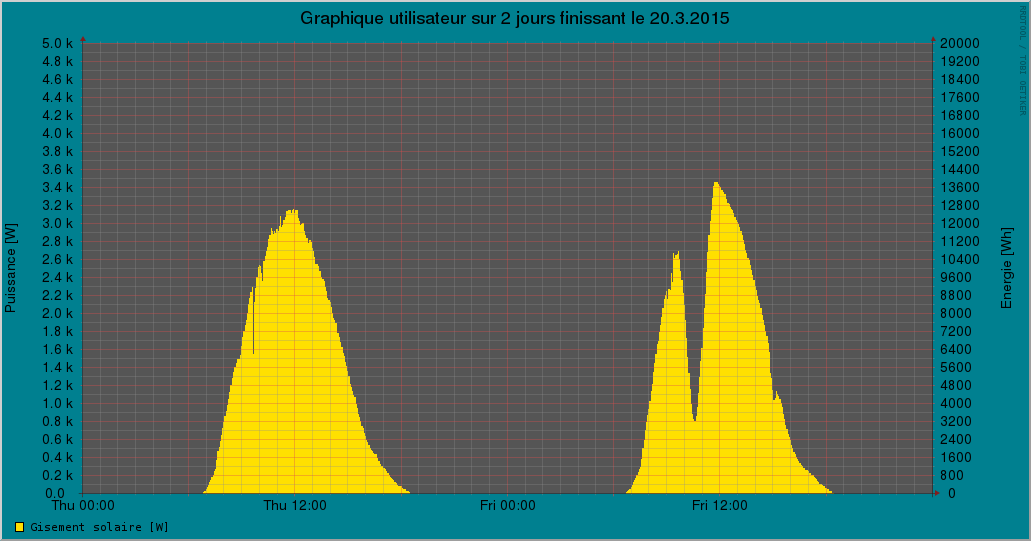
For comparison, the following chart shows the solar power available on the 19th as well:
![]()
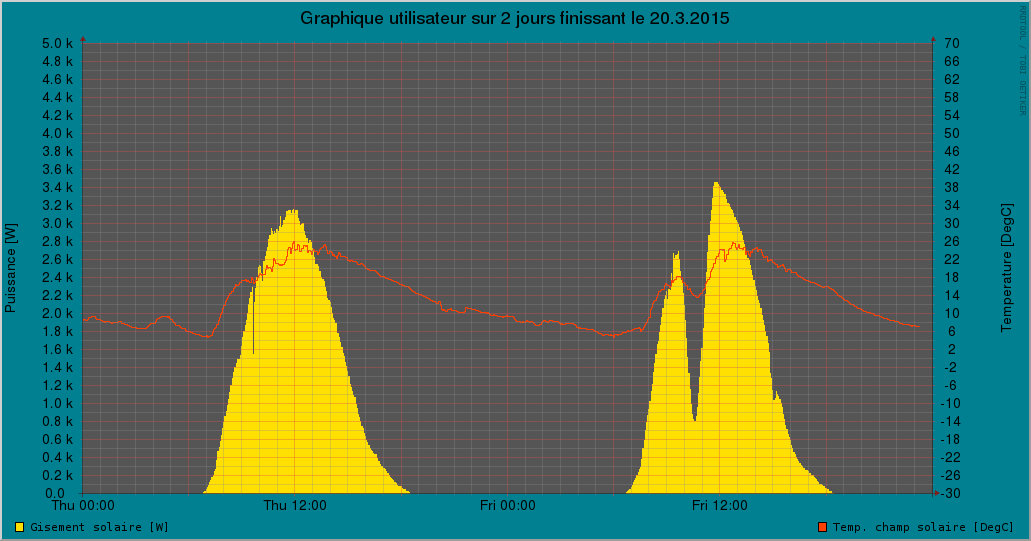
The temperature of the solar panels is indicated by the red line on the following chart (use right hand scale) :
![]()
-
Interior decorative lighting
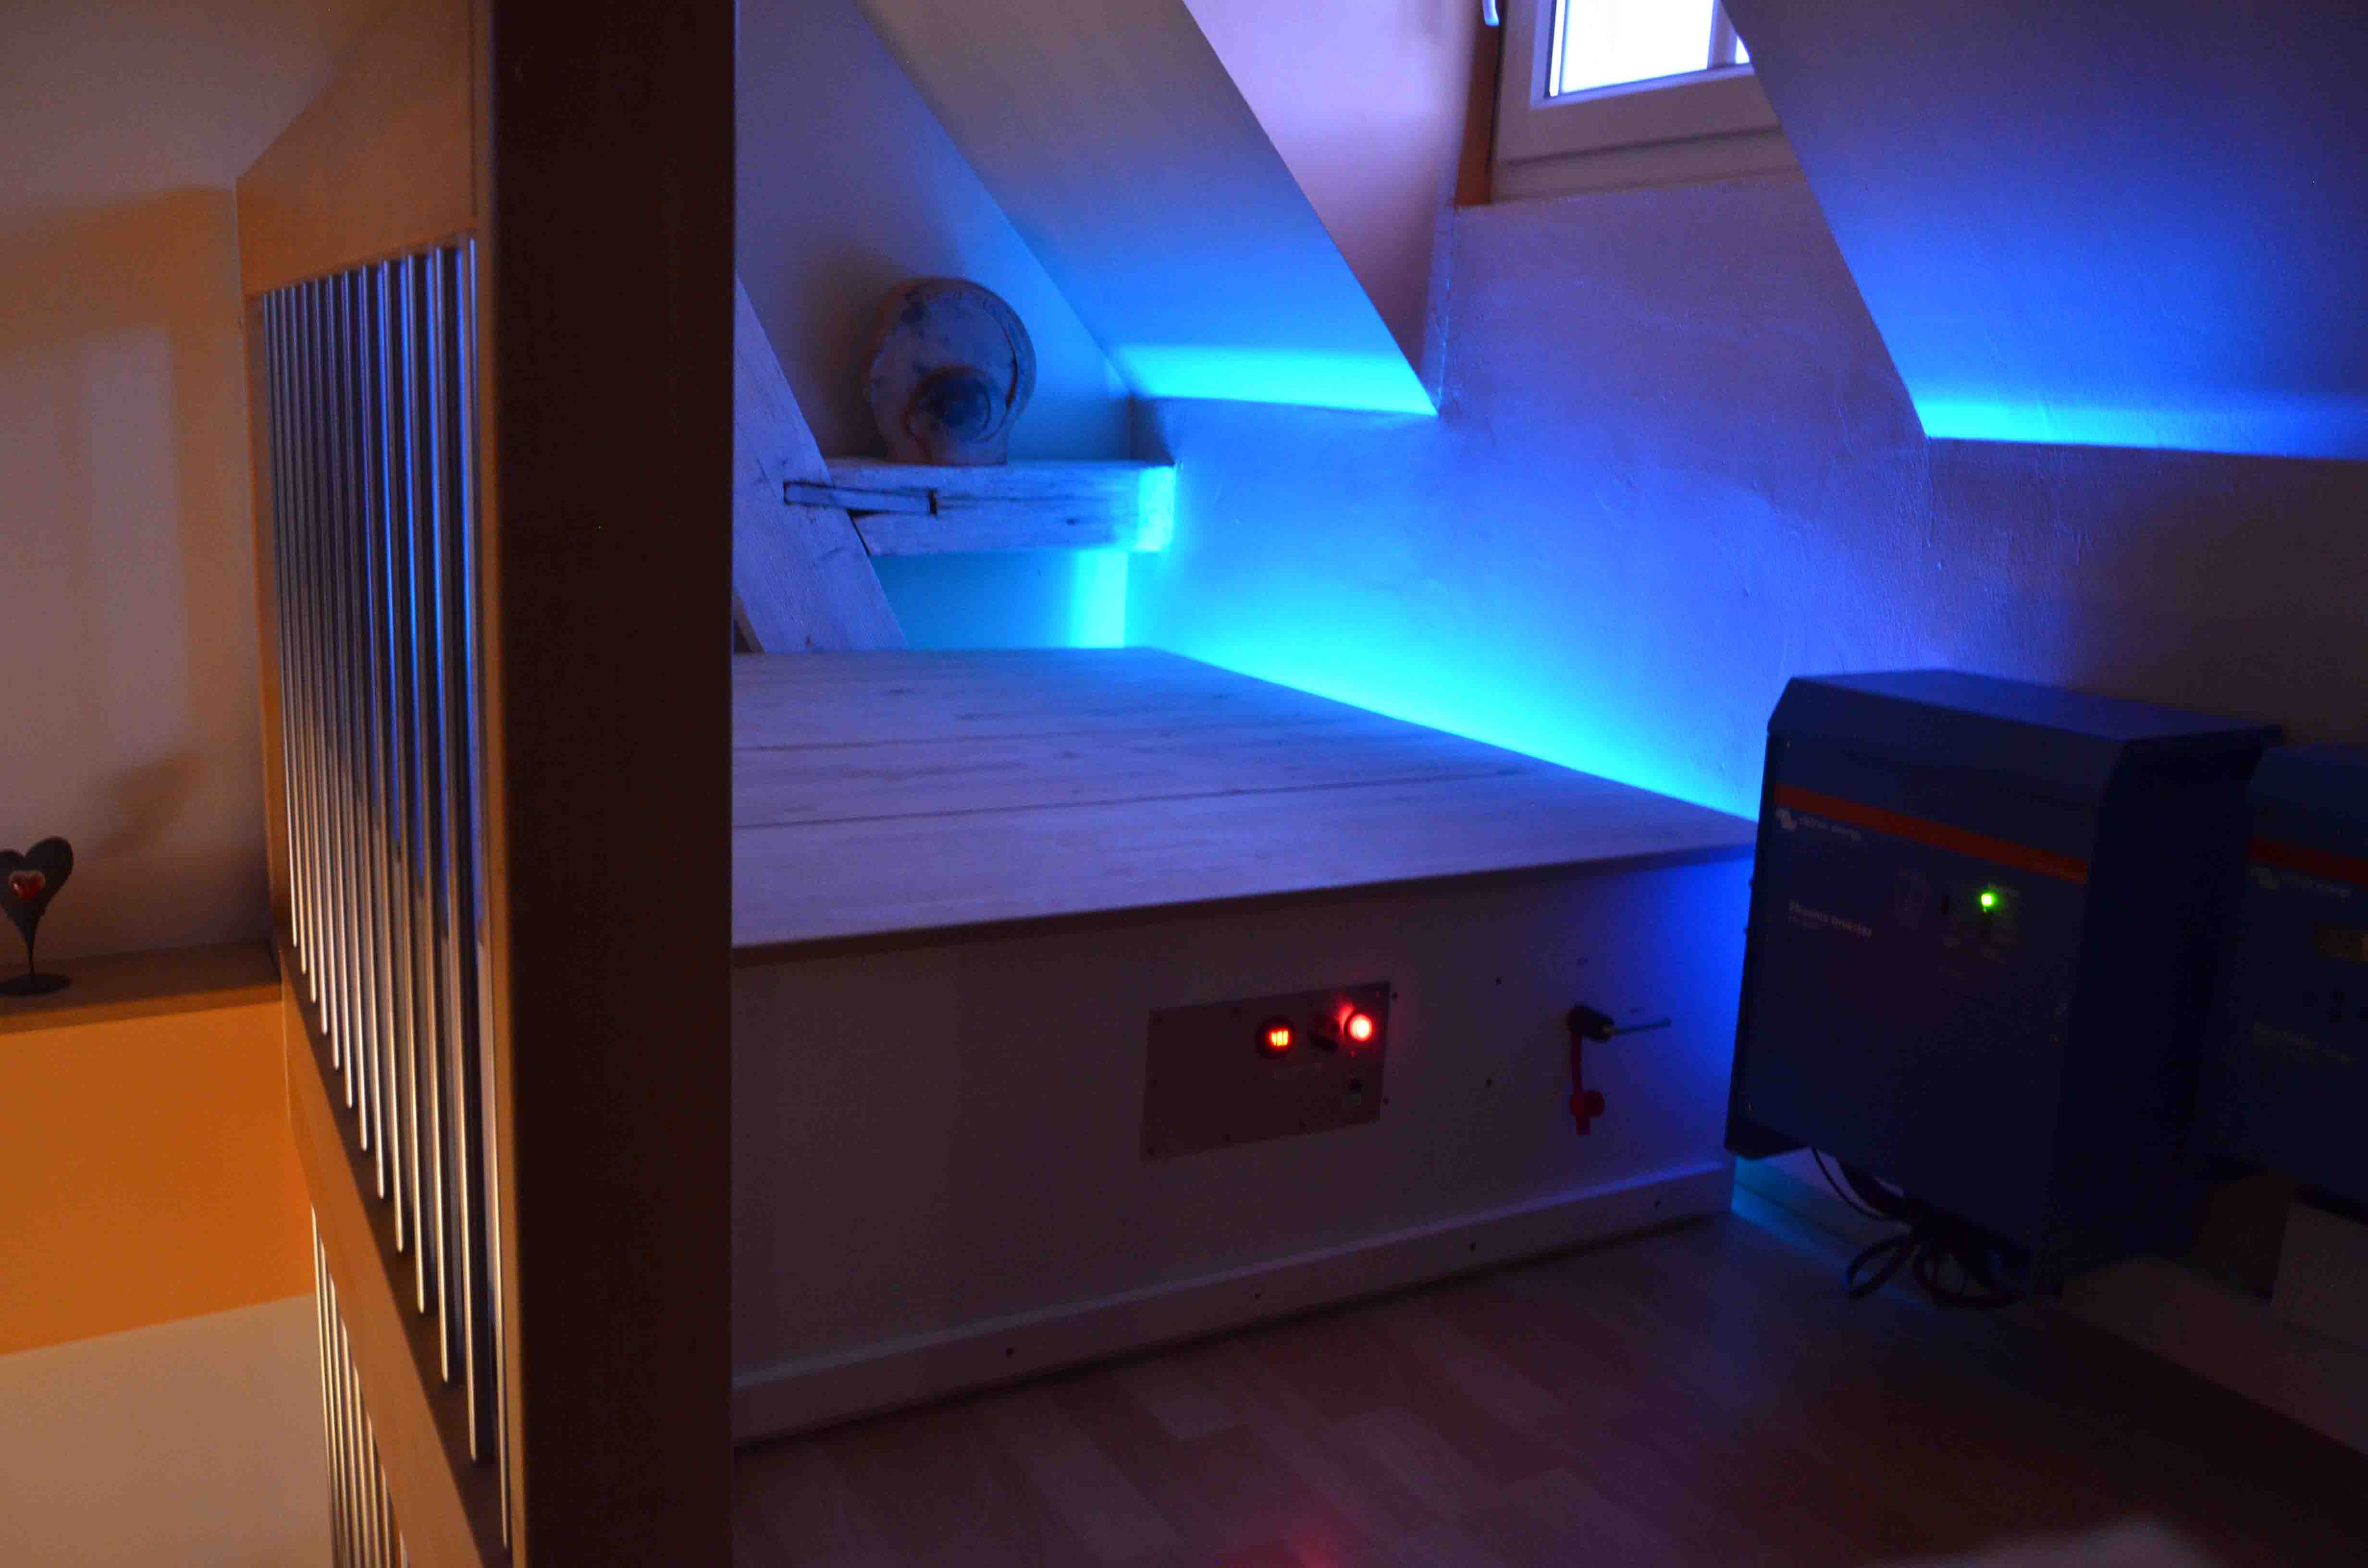
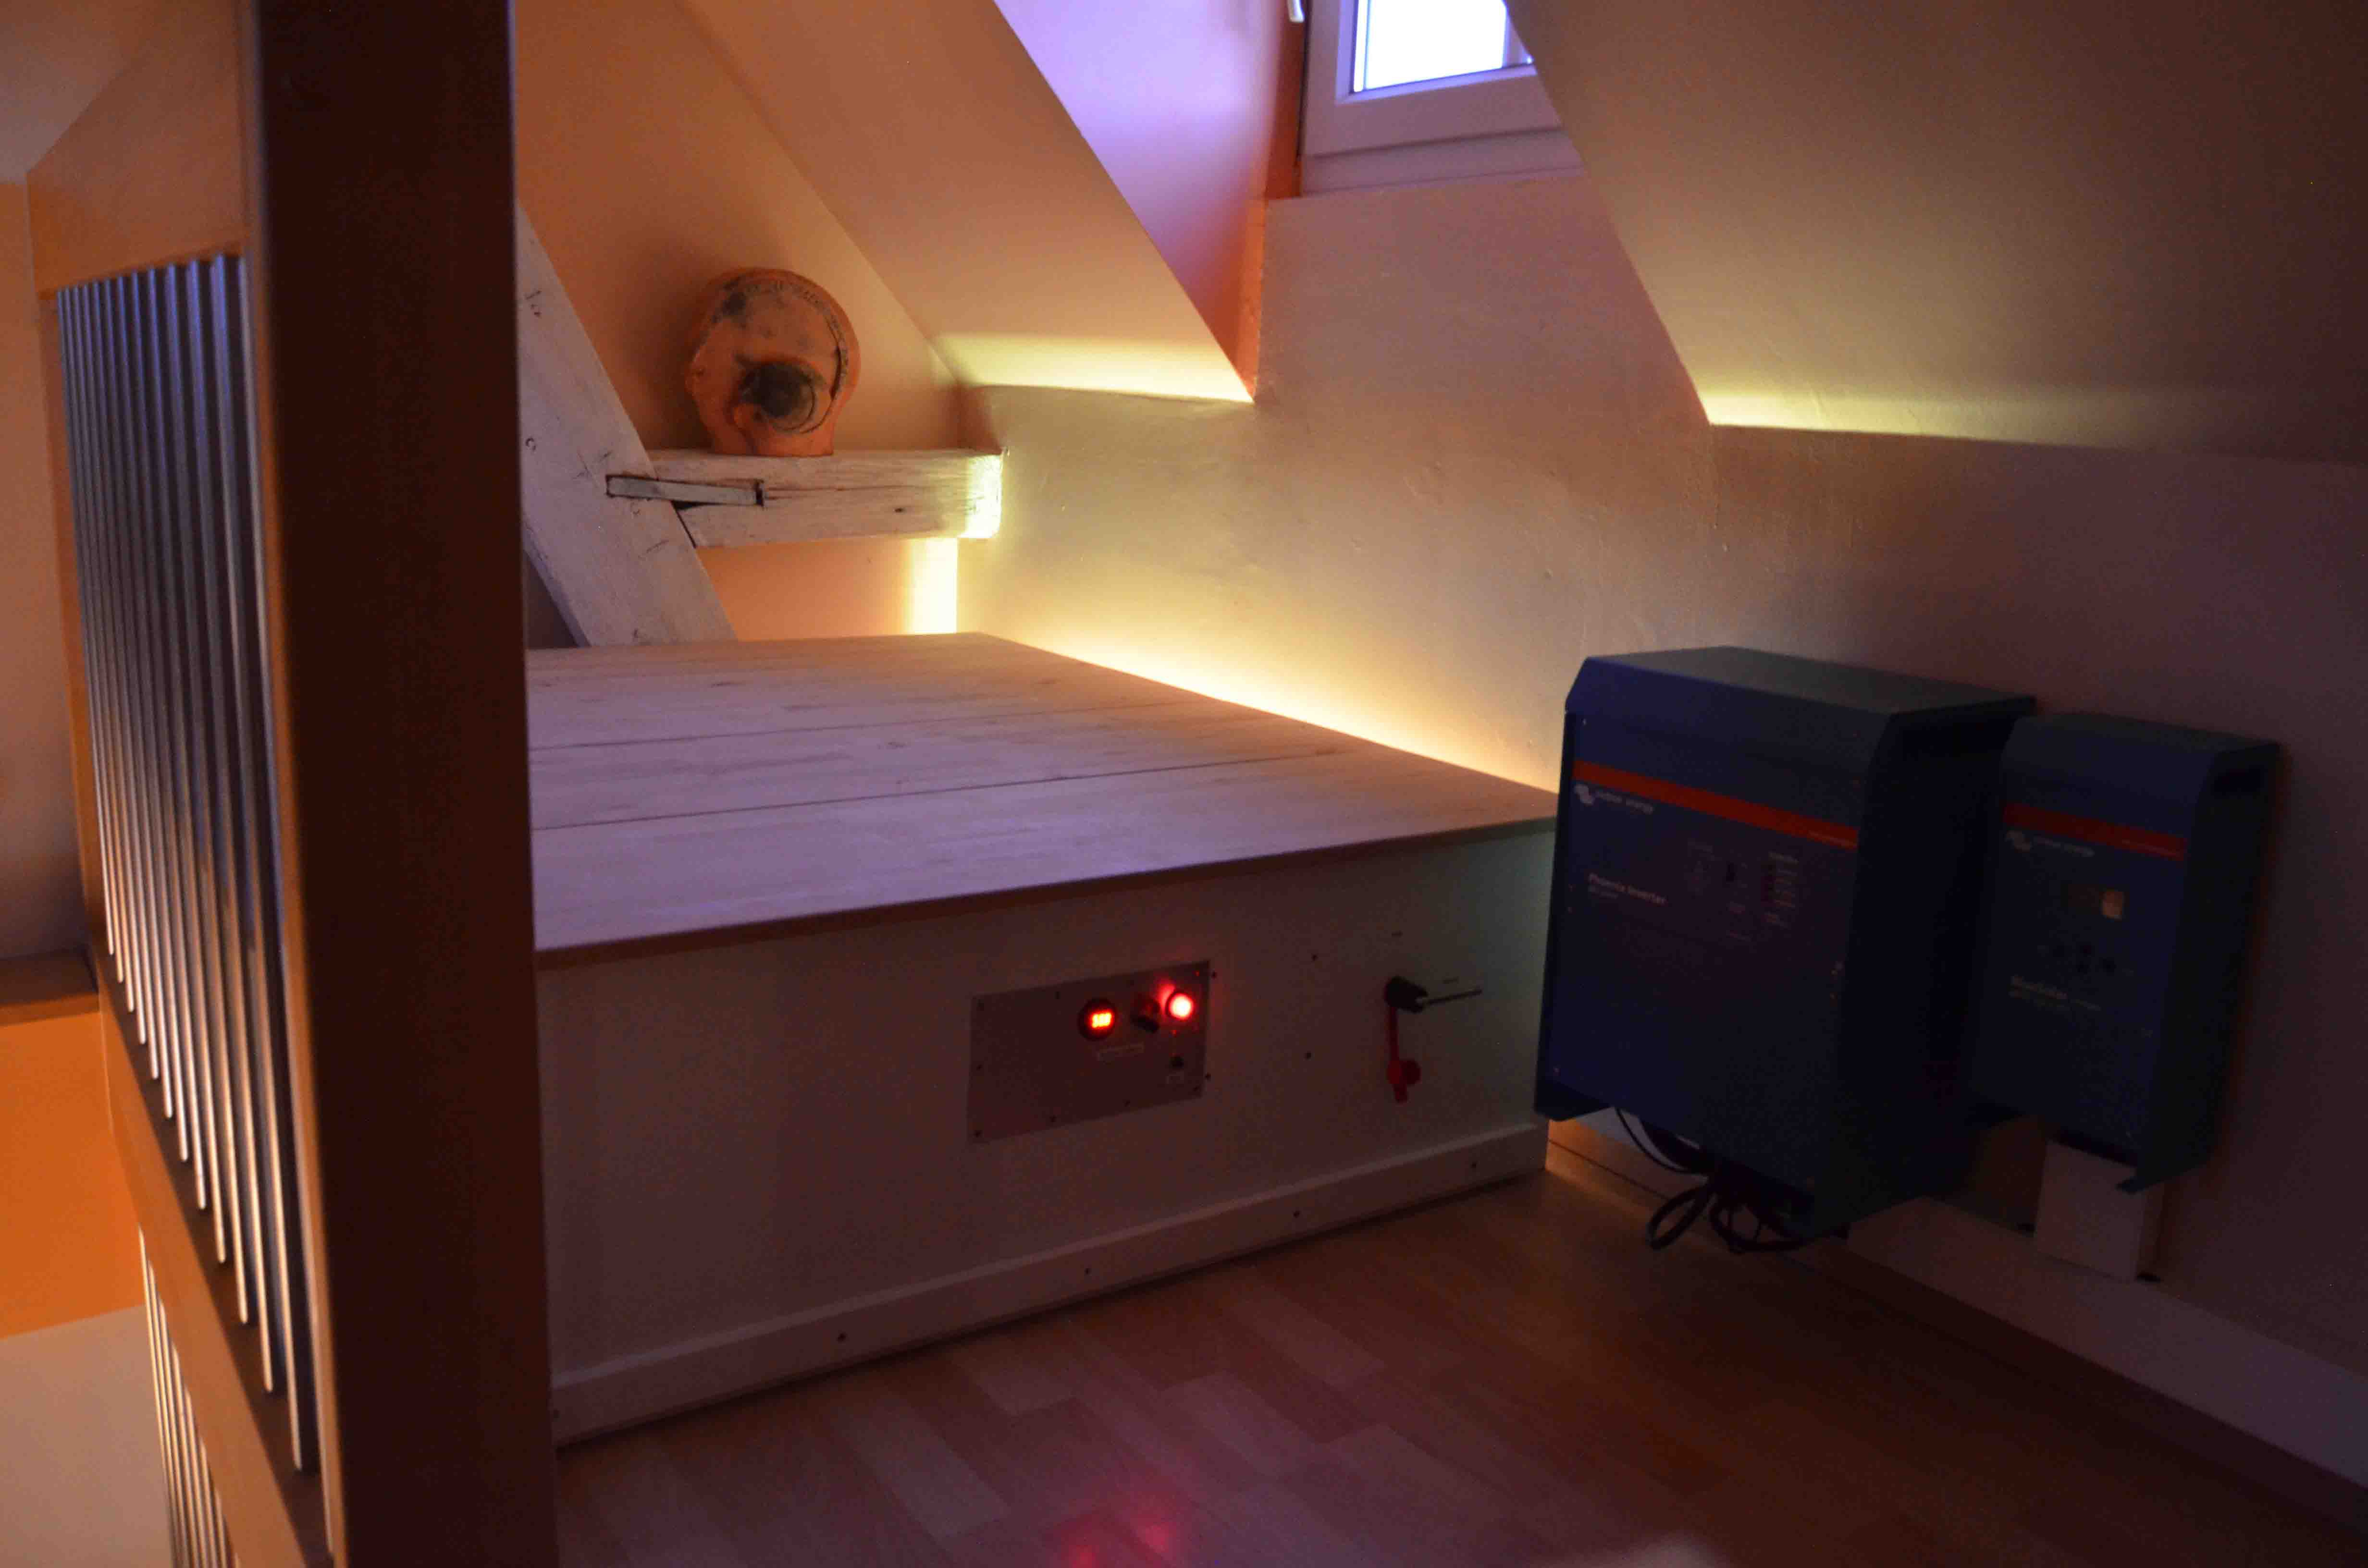
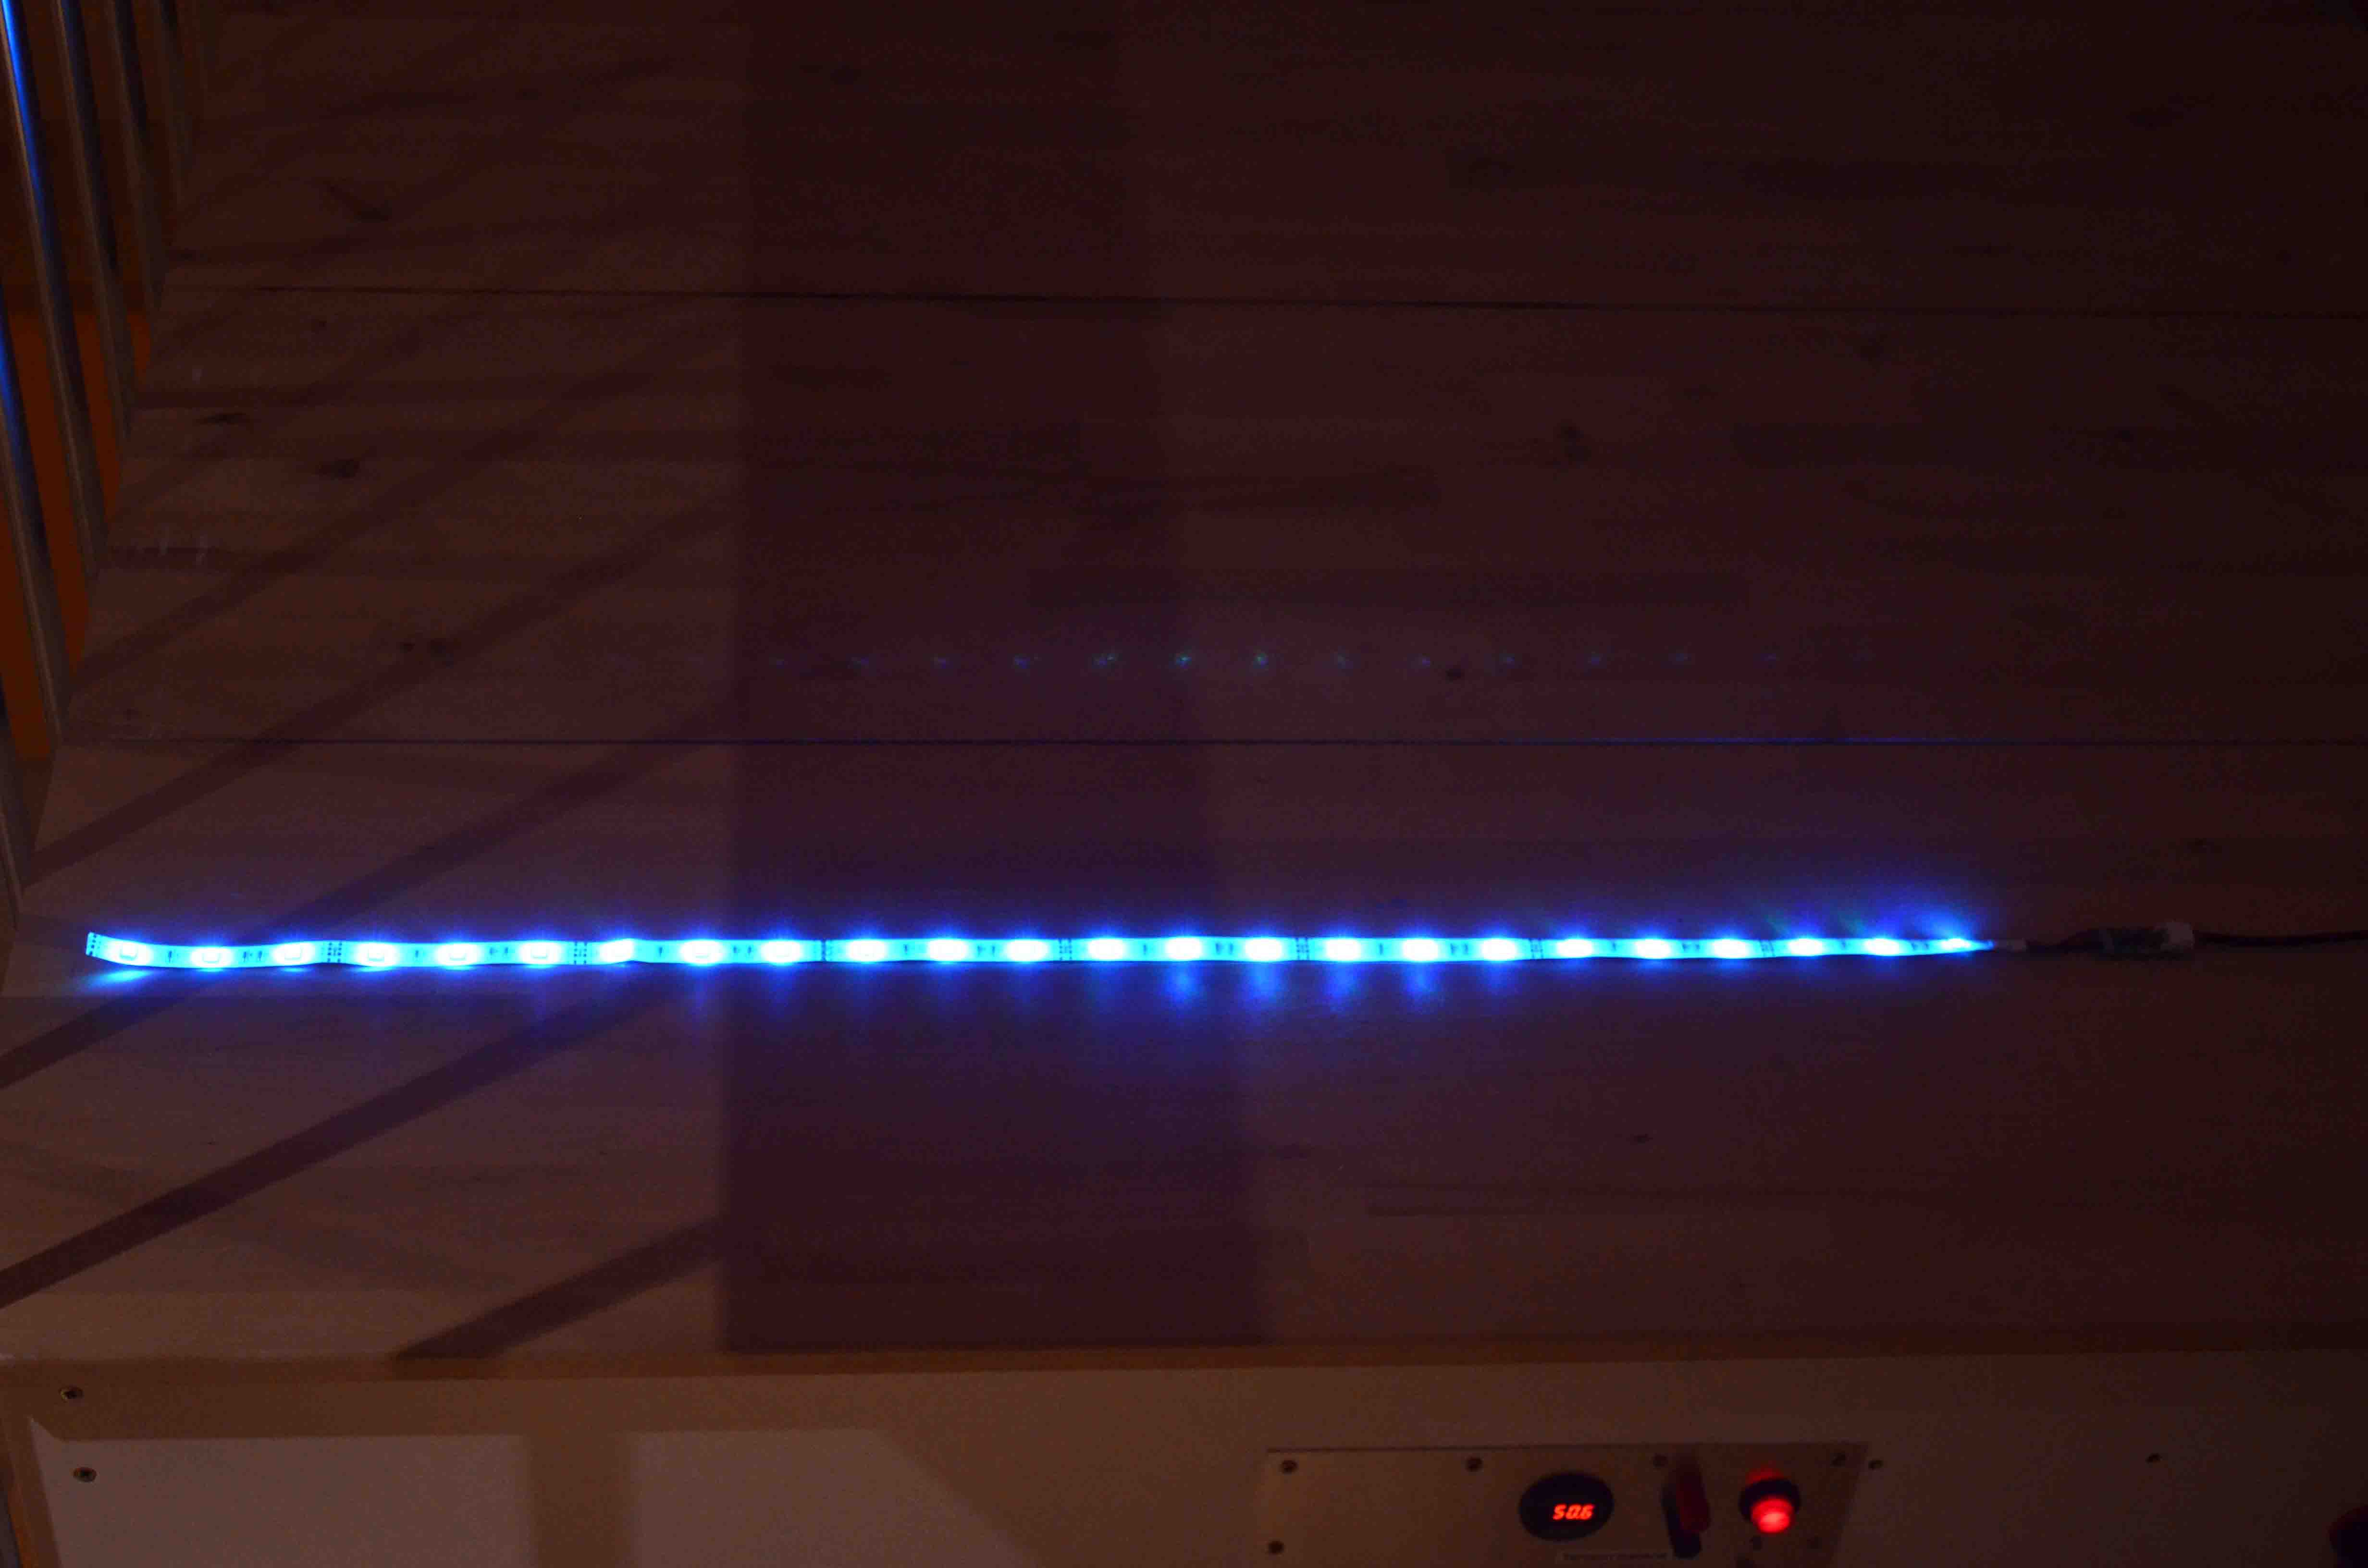
01/04/2015 at 17:08 • 0 commentsI found it cool to add a LED lighting behind the battery box. The LEDs are lit only at night and create then a peaceful atmosphere in the house.
The "base" color of the LEDs depends of the current supply status of the house:
Blue: the electricity is provided by the PV system
Red: the power is provided by the gridI added also some proportion of green to indicate the battery state of charge. So I get 4 basic colors:
Cyan (blue + green) : PV supply and fully charged battery
Blue: PV supply and nearly discharged battery
Red: supplied by the grid and the battery is fully discharged
Yellow: the house is grid supplied and the battery is nearly fully chargedOf course, all intermediate colors exist, depending on the battery state of charge
Cyan: PV mode and fully charged battery Yellow: grid mode and fully charged battery ![]()
![]()
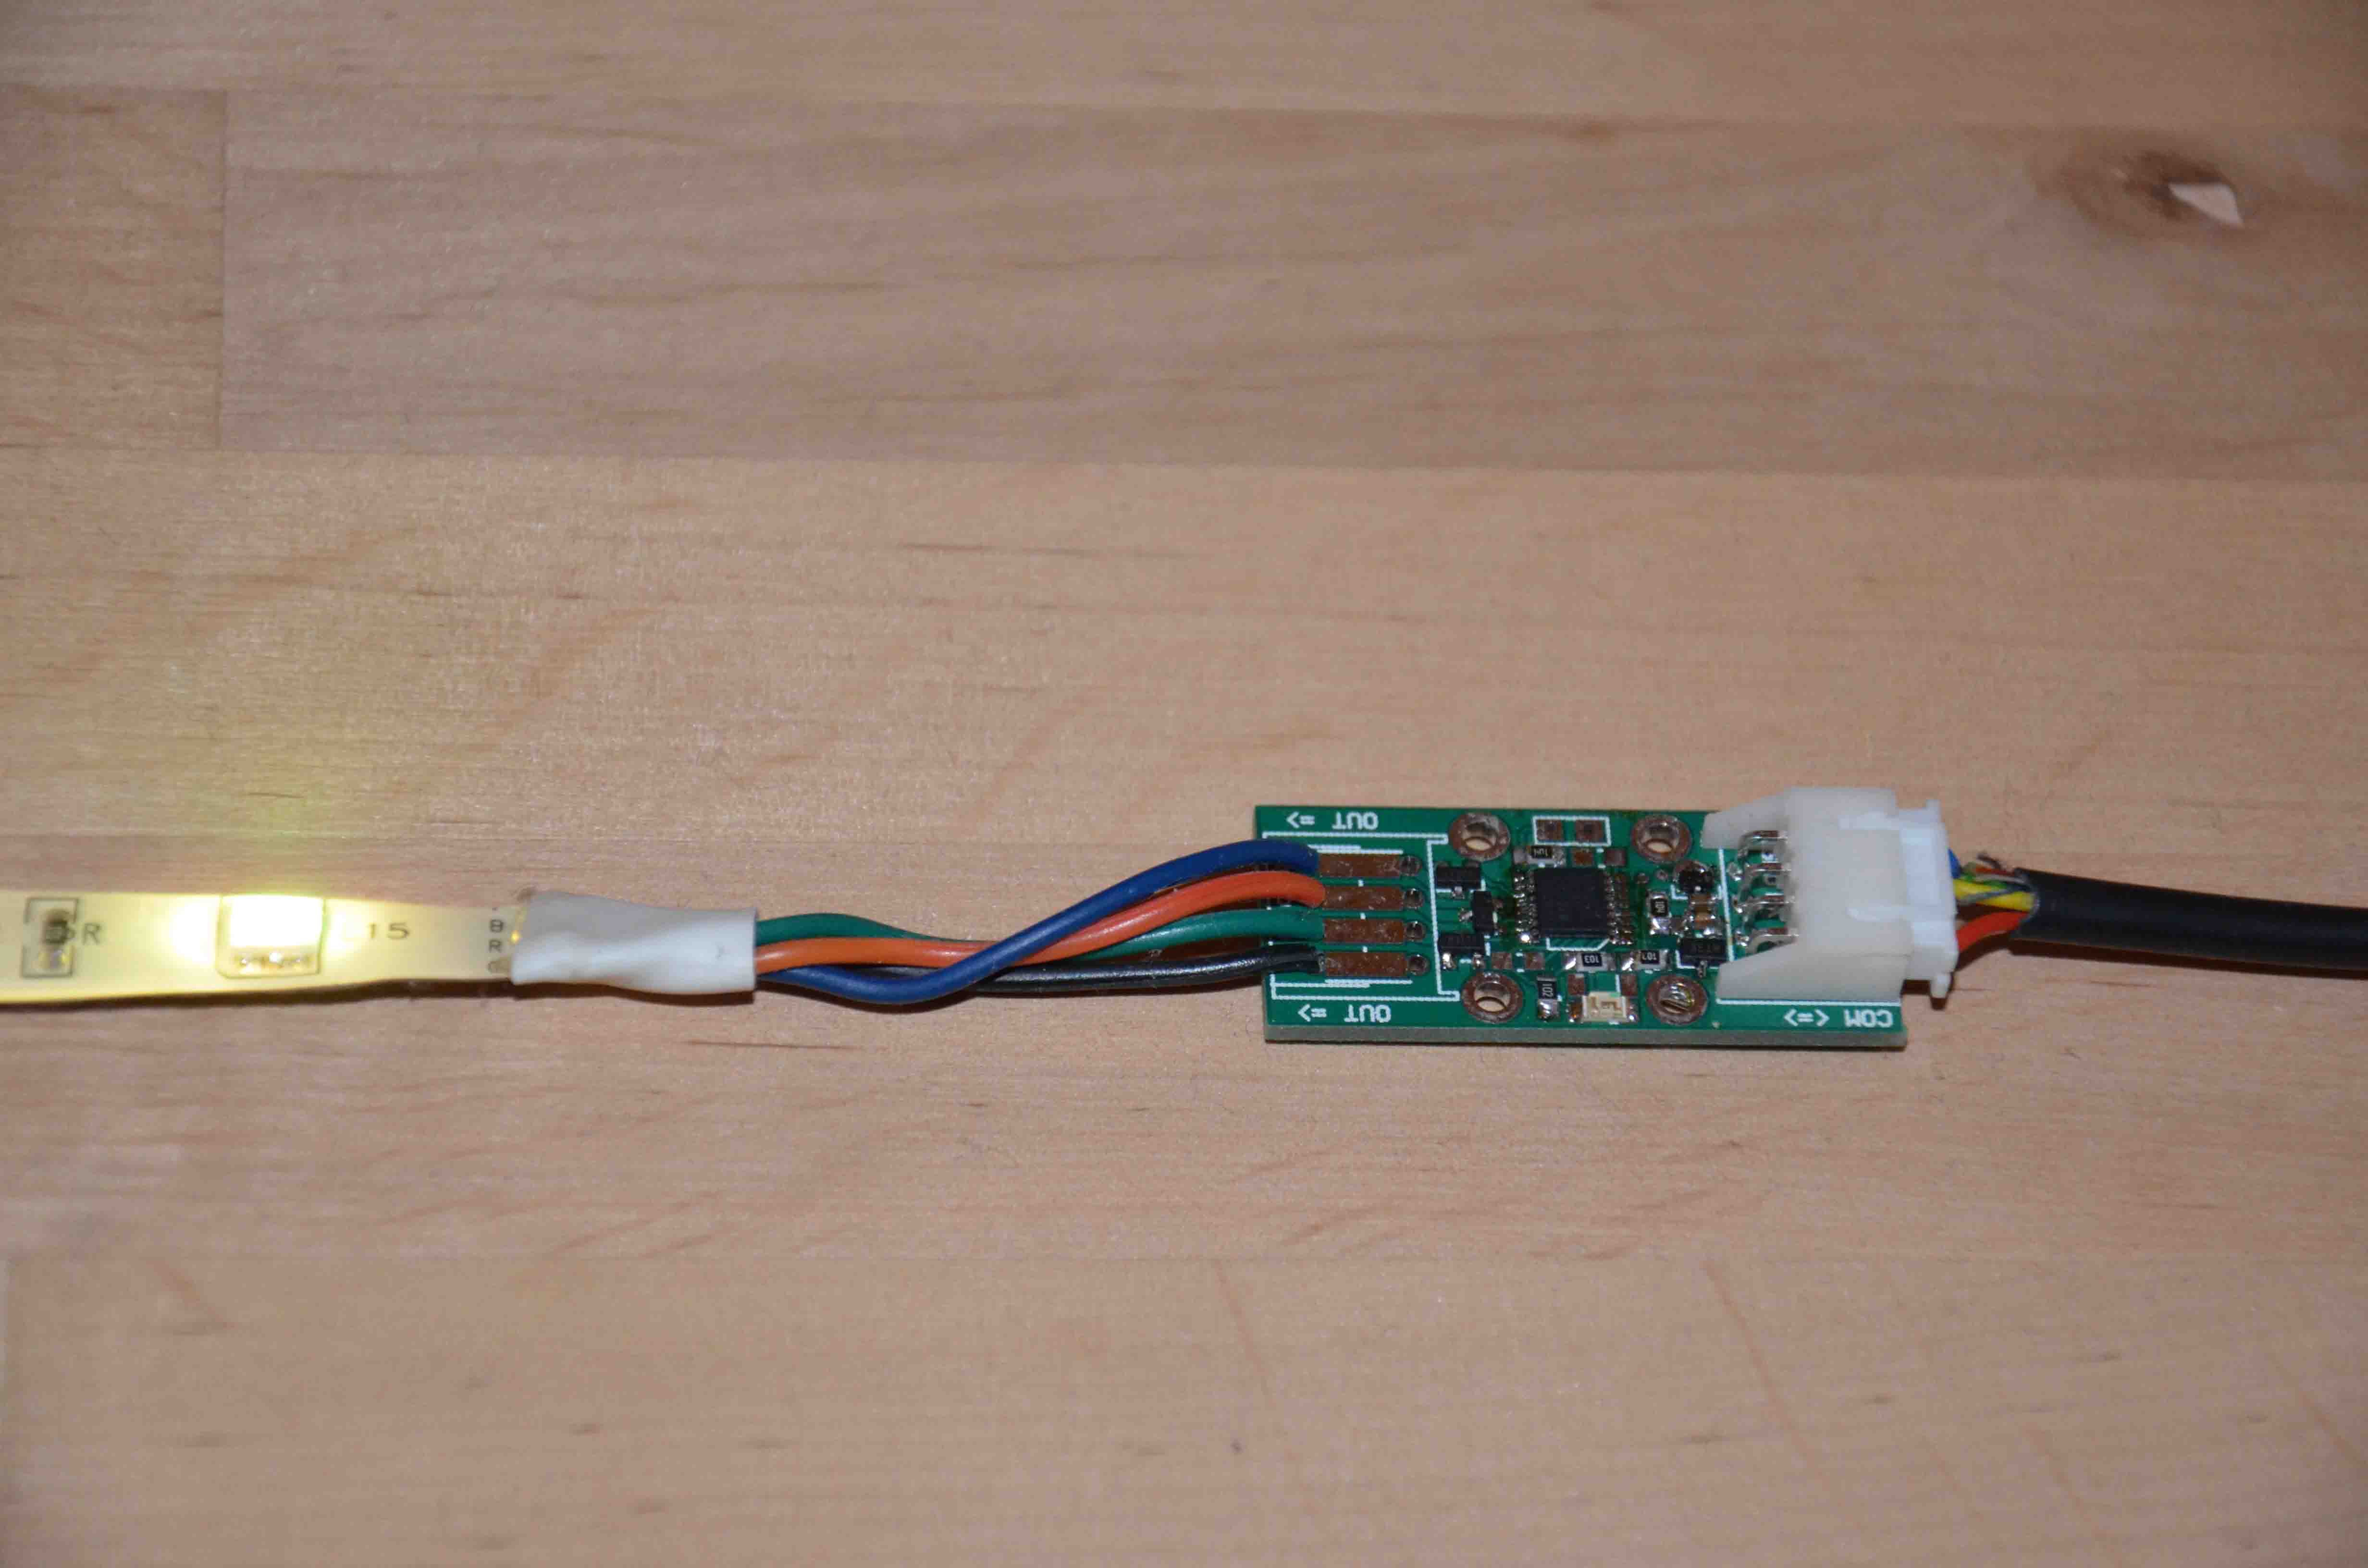
The light is provided by a short piece of low cost chinese RGB LED strip.
![]()
The LED strip is connected to a small Cortex M0+ controller board designed by my friend Gilles
The controller board gets its 12 VDC supply from the PVBM board (PV Battery Manager). The PVBM provides also the intensity of each color through a serial line.
![]()
-
The Android Application
10/29/2014 at 15:53 • 0 commentsNone of the electronic boards making up the monitoring provide any "Man-Machine Interface". I have chosen to interact with the system through a Web site and an Android Application. This option provides the same level of interactivity at home or when I am away from home (it occurs 5 days a week).
The Android Application was developped first. It allows "real time interaction" with the system.
It comprises 5 screens. I just swipe to navigate through the screens.
The screens are organised as follows :
- Synoptic
- Solar field
- Battery
- Inverter
- Counters
Note: the screenshots have been made on my "old" Galaxy Note 1. Android version is 4.1.2
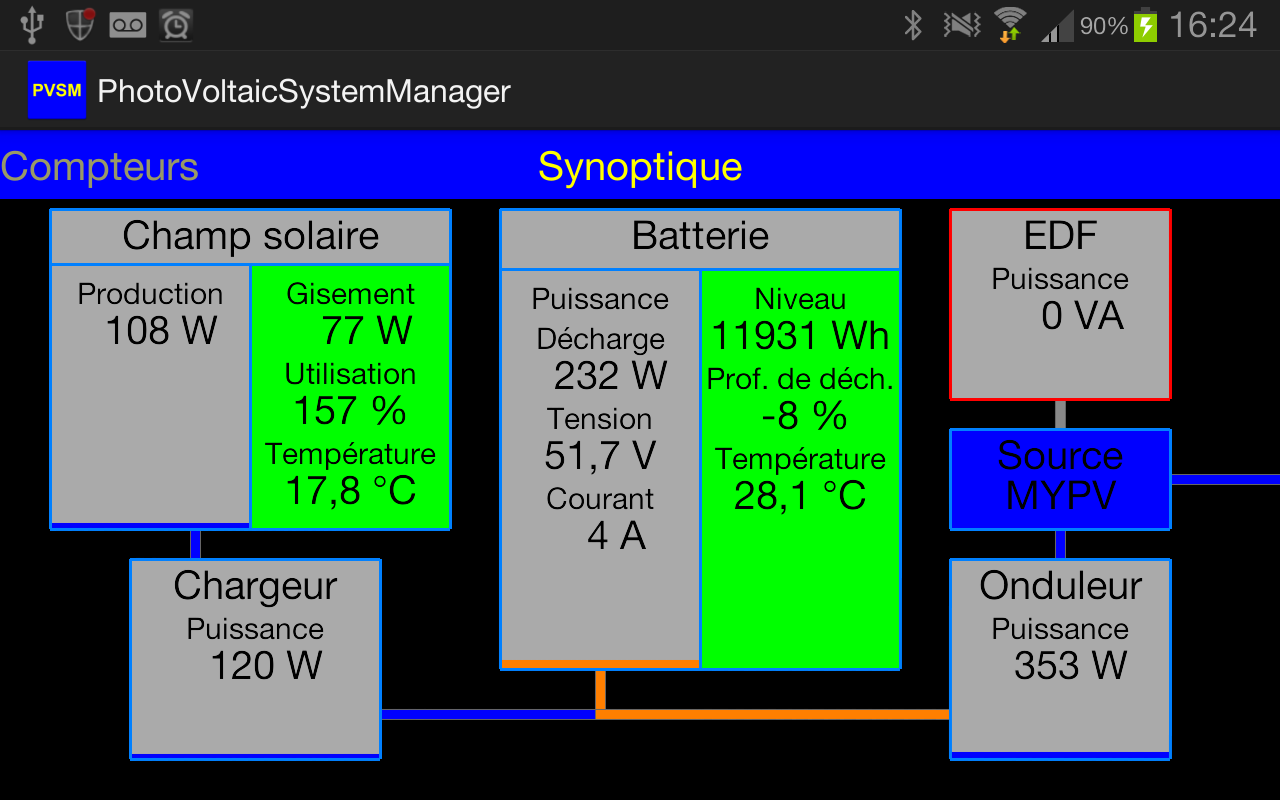
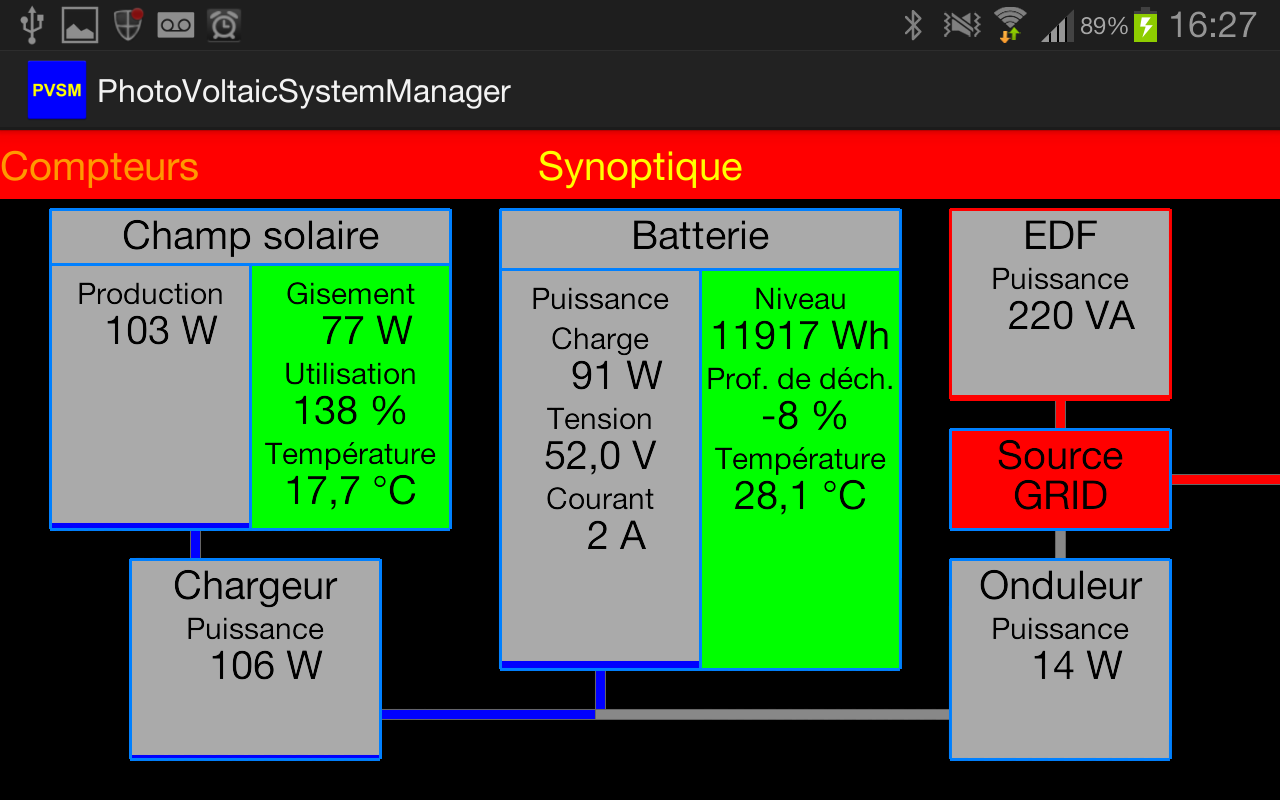
The Synoptic screen
The application starts on this screen. It summarizes al the important figures of the system
![]()
![]()
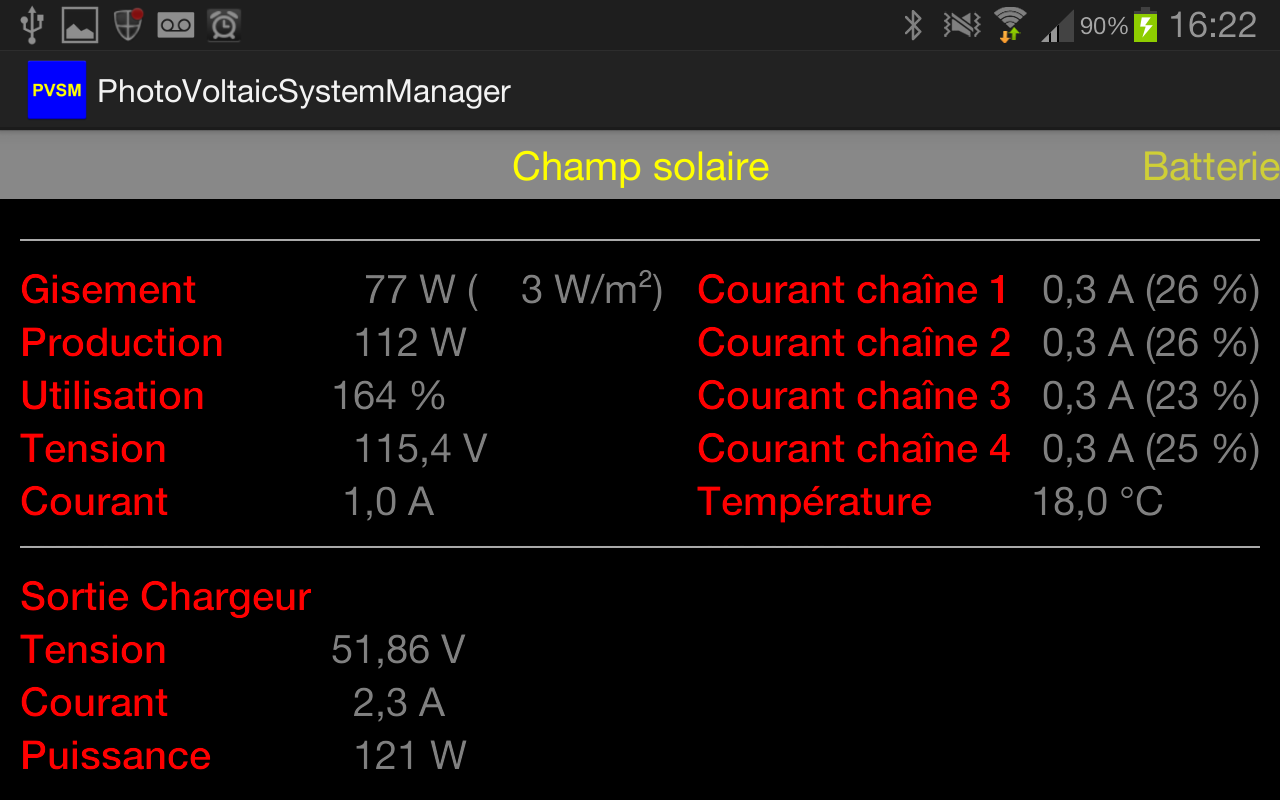
The Solar Field screen
![]()
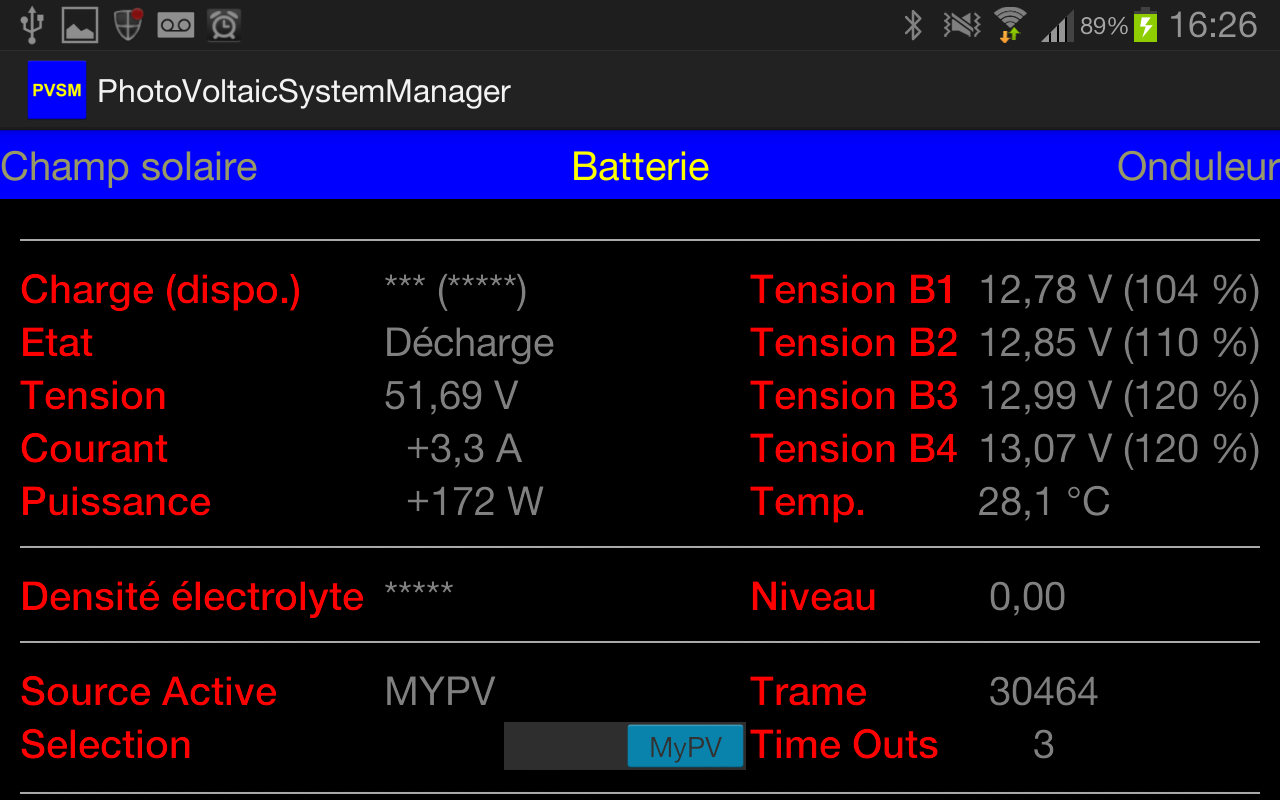
The Battery screen
![]()
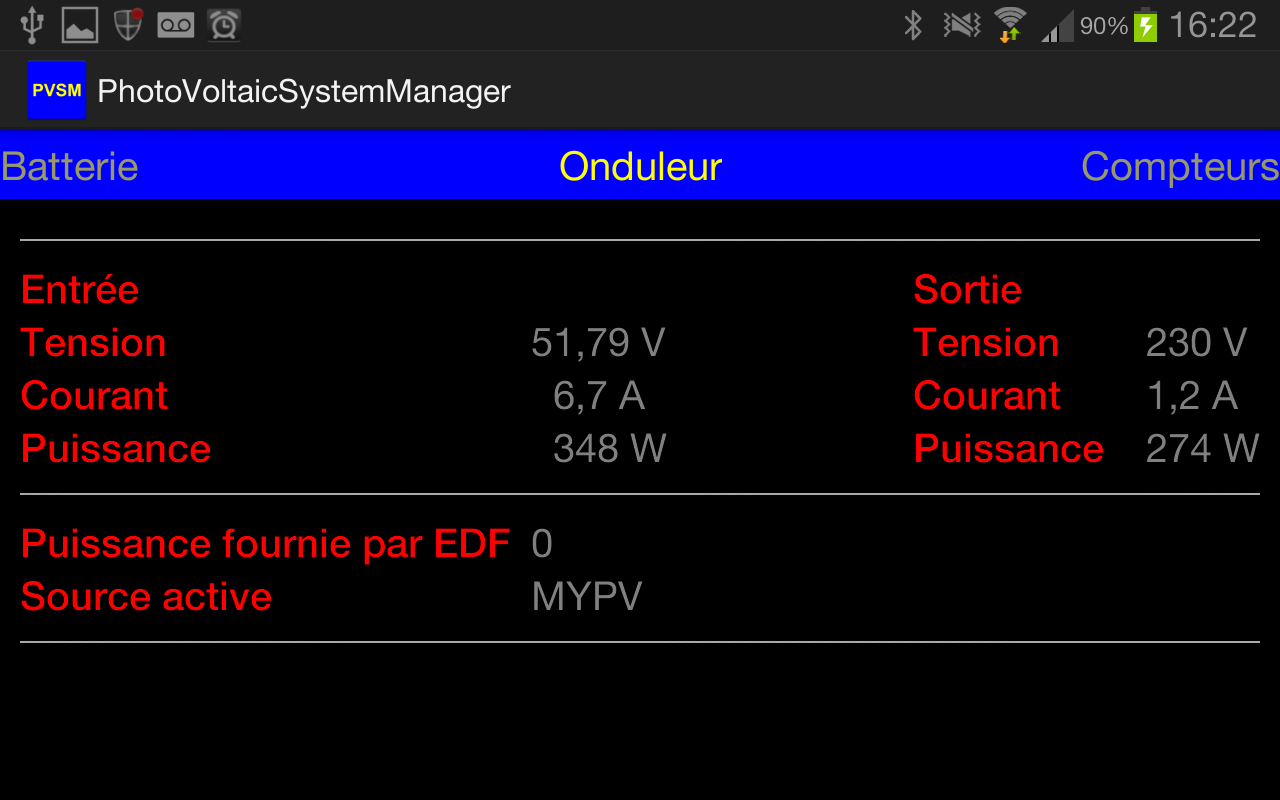
The Inverter screen
![]()
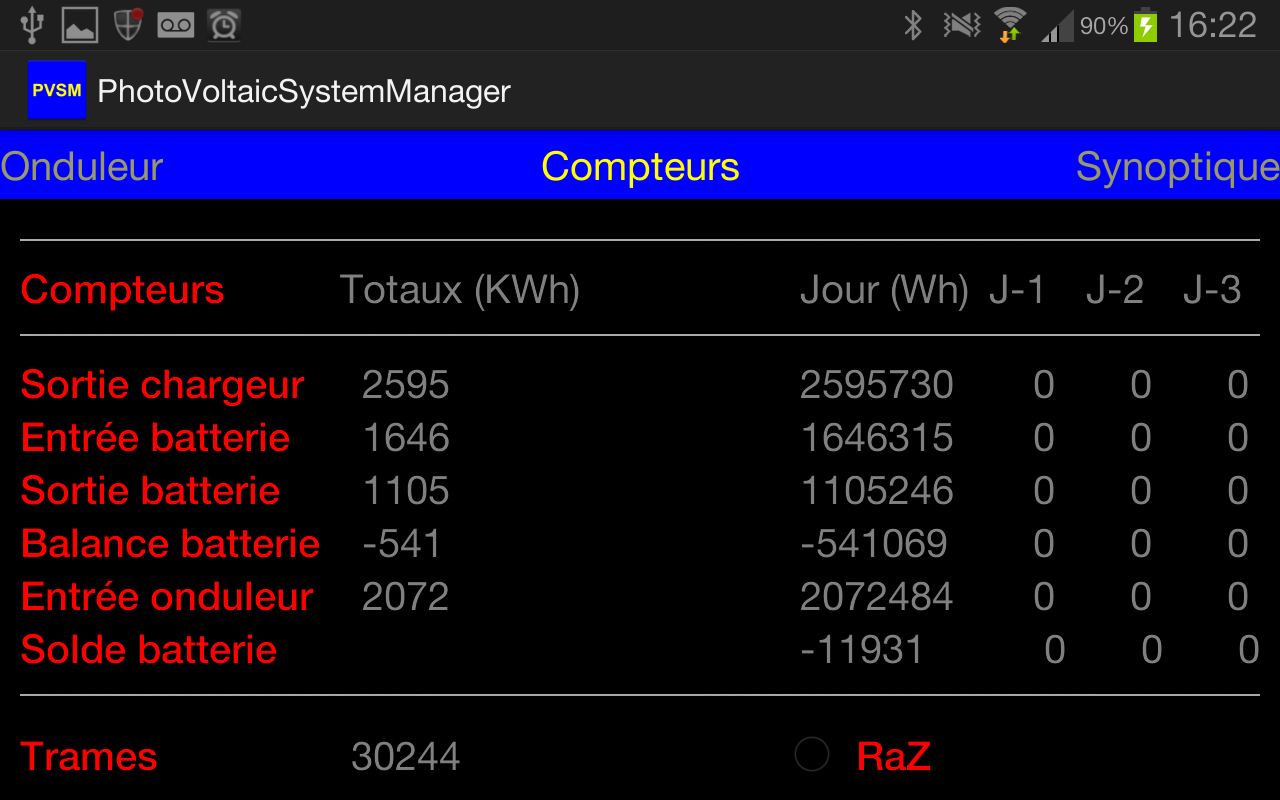
The Counters screen
![]()
-
Inside the Big Battery Box
10/26/2014 at 14:23 • 0 commentsThe battery box has got several features that are worth to be mentioned.
(Sorry for the annoying dashes in some comments. It's the only way I found to get a good aspect for the pictures...)
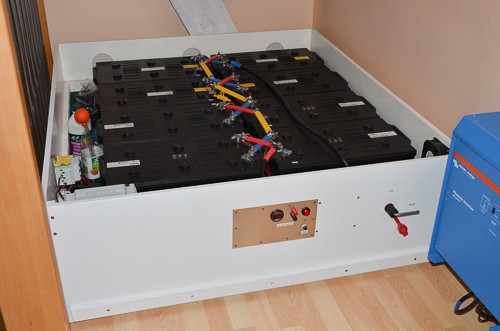
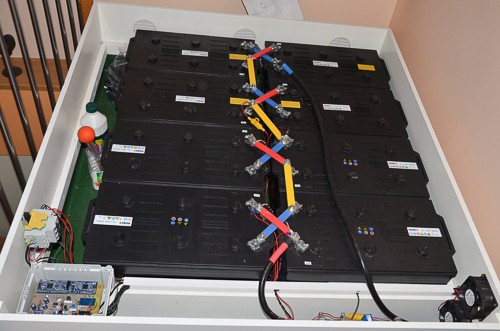
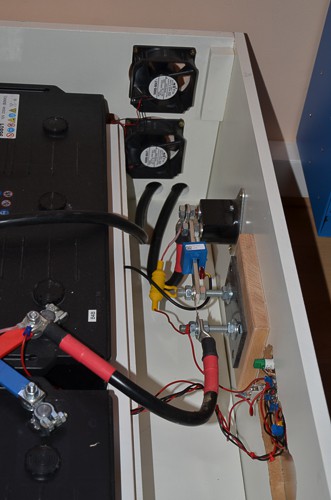
General View Close up on the 8 batteries The battery box contains 12V / 230Ah semi stationnary lead acid batteries. The 8 batteries are grouped 2 by 2 in parallel. 4 groups of 2 are connected in series. This constitutes a "2S4P" pack of 48 V / 460 Ah . It can provide 23 KWh at 50 % of depth of discharge. The battery box weighs approximately 500 Kg. The battery pack is located very close to the converter in order to minimize cable losses. The green surface on the left side of the battery is a Polyethylene liner. This liner protects the wooden floor against a leak of acid that would be catastrophic otherwise. ---------------------------------------------------------------------------------------------------------------------------------------------------------------------------------------------------------------------------------------------------------------------------------------------------------------------------------------- ![]()
![]()
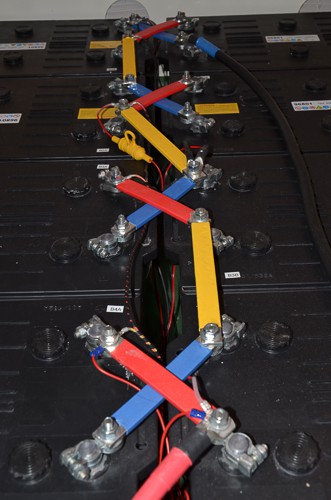
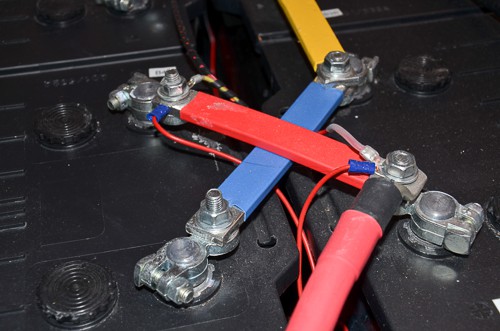
Batteries interconnect Connection detail The current flowing through the battery pack may reach up to 200 A. In order to minimize losses, the battery are interconnected by the means of short solid copper bars. The cross section of these bars is 120 mm². This yields a current density of less than 2 A/mm² in the worst case. The bars are tinned to avoid corrosion and insulated with thermo-retractable sleeve. The light gage wires are for voltage measurement. The cable to the inverter has a cross section of 95 mm². --------------------------------------------------------------------------------------------------------------------------------------------------------------------------------------------------------------------------------------------------------------------------------------------------------------------------------------------------------------------------------------------------------- ![]()
![]()
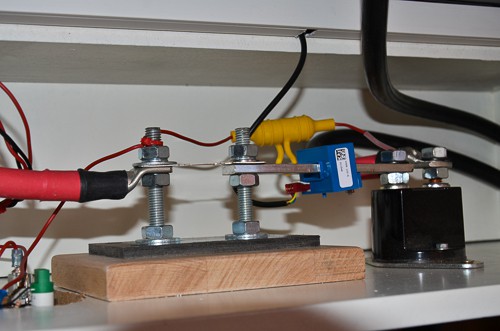
Front of the box When the battery voltage reaches 56 Volts, bubbles of hydrogen and oxygen come out of the batteries. 2 powerful fans eventually blow these gases out of the box. This close up shows (left to right) the 200 A fuse, the current transducer (blue box) and the power switch (black box on the right). The current sensor is placed across a copper bar. ![]()
![]()
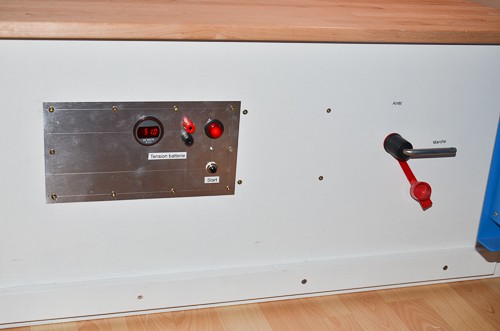
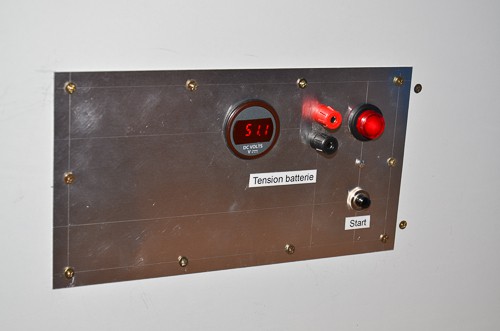
Front panel equipment The big lever on the right is the battery power switch. This lever is put on the "Off" position only during maintenance. ------------------------------------------------------------------------------------------------------------------------------------------------------------------------------------------------------------------------------------------------------------------------------------------------------------------------------------------------------------------------------------------------------------------------------------------------- The basic "dashboard" comprises a digital voltmeter, a pair of banana plugs for an external voltmeter, an LED indicator and a "Start" push button. During system start-up this button allows slow charging of the converter's input capacitors (33 000 µF) through a resistor before turning the power switch on. Otherwise the huge current inrush could make these capacitors explode. (it happened once in the beginning ;-(). ![]()
![]()
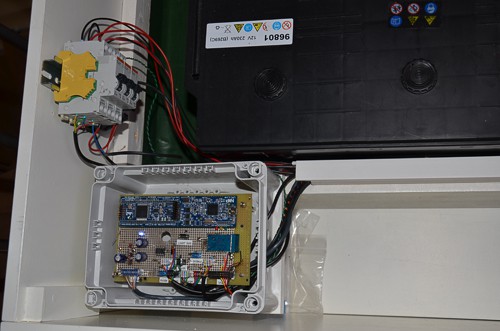
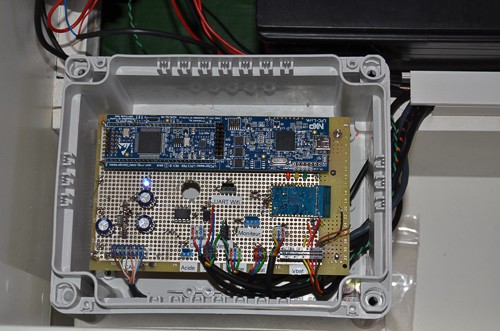
The Battery Management System The management of the battery is one of the most demanding task in an autonomous PV System. This Battery Management System is based on an NXP Cortex M3 32 bit Microcontroller board equipped with a powerfull LPC1769 chip running at 120 MHz.
The circuit breakers located on the left manage redounded +24 V DC distribution to supply the electronic boards.The Battery Management System has following features :
- Redundant power supply
- 5 battery Voltage meas. inputs
- 1 current meas.input
- 1 temperature meas. input
- Inverter control output
- Fan control output
- Deco Lighting control
- Wifi interface
- CAN bus interface
- Monitoring interface
----------------------------------------------------------------------------------------------------------------------------------------------------------------------------------------------------------------------------------------------------------------------------------------------------------------------------------------
![]()
![]()
-
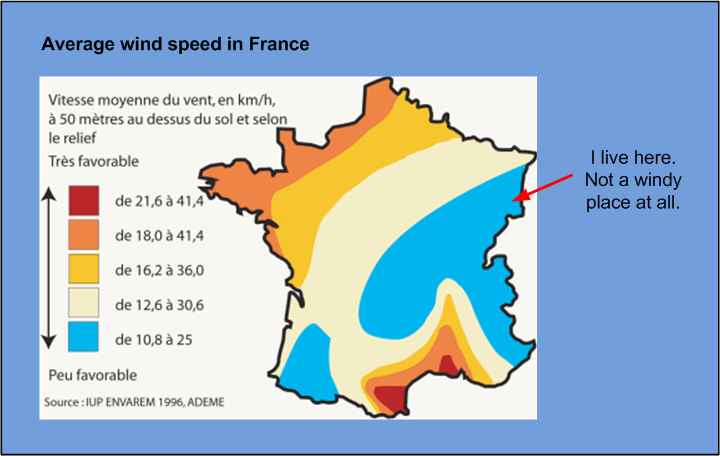
Why not add a wind generator ?
09/01/2014 at 07:29 • 0 commentsOff-grid systems comprise often a wind generator. In many places, there is a quite a lot of wind in winter. Unfortunately, my place is never windy, neither in summer, nor in winter.
Investing in a wind generator would be wasted money, for sure.
![]()
-
Why is it so important to monitor a Photovoltaic System ?
08/21/2014 at 06:35 • 0 commentsDue to my job, I'm away from home 3 days per week. The remote monitoring gives me valuable real time informations regarding the yield and the health of the System. I can even remotely switch between Solar and Grid with my smartphone while having a beer in a bar. I also get a notification when the switching occurs automaticaly. Keep in mind that the system is online 24/24 - 7 days per week.
PV systems last for many years. Some parameters like the efficiency are prone to slow drift due to following factors :
- Solar panels getting dirty
- Battery wear out
- Terminal blocks getting loose
The database provides long term (20 years) recording and allows comparison between large amounts of data. This helps finding out the root causes of efficiency drifts.
PV systems must also be tuned to deliver their maximum yield. Curves and charts provide valuable data regarding the behavior of the system every day. These informations help in taking modification decisions.
-
What comes next ?
08/20/2014 at 07:01 • 0 commentsFacts
During summer, the solar production is so efficient that a lot of energy cannot even be consumed. It would be very useful to store this surplus of energy for later use, for example in winter when the days are so short. An electricity storage with a capacity of 500 KWh would be perfect. Unfortunately such a battery is currently not affordable for an individual. We have to find something else to use this energy...
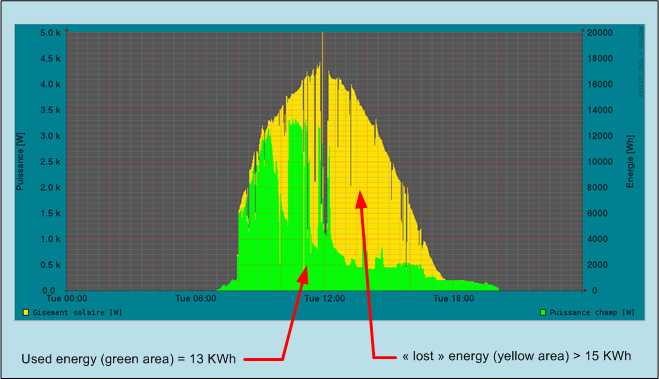
Following chart captured on August 19th, 2014 depicts the situation:
The yellow area in the background is the solar irradiance (available power). The green area is the energy used by the system. The surface of the green area is 13 KWh. The visible yellow area is the energy that has not been used by the system. The surface of the area is obviously more than 15 KWh.
![]()
An option would be to use this available energy to heat water for domestic use. Our sanitary hot water is produced by a natural gas boiler. If I insert an electrical hot water tank in series before the tank of the boiler, the gas boiler need not to heat the water anymore (provided solar power was sufficient to heat the water). So our natural gas bill will decrease thanks to solar electricity.
That seems to be a great idea ! - Let's see if it is feasible and if it's worth the money.
Feasibility of Photovoltaic Hot Water production
A 4 person family uses up to 200 L of hot water per day. The electrical power of 200L tanks is generally 2 KW. That figure is compliant with my Inverter rating.
To heat up 200 L of water, one needs approximately 10 KWh. This is compliant with the surpluses of my PV system.
It will not be possible to manage the hot water tank simply with an ON-OFF switch. The available sun power will often less than 2 KW. So an ON-OFF scheme would lead to eventually drain the battery. That is not acceptable. I will implement a triac dimmer to manage precisely the power drained by the hot water tank. This triac module will be connected to the PV System CAN bus. The microcontroller managing the hot water dimmer will be able to compute preciseley the available power thanks to the data available on the bus and set the triac firing angle accordingly.
How much natural gas bill reduction can I expect ?
My calculations predict a 100 € yearly saving on the gas billHow much does it cost ?
A tank costs 400 €
Pipes and accessories : 100 €
Electronic board + box: 200 €
Total cost: 700 €Provided the gas price does not increase, the ROI will be of 7 years. That's OK, let's start the project.
Design
This project is fully designed now and is currently being tested with a dummy load. See my HackADay project.
-
My PV System Software Aspects
08/19/2014 at 14:31 • 0 commentsBackground
In a "connected project" like this one, the software plays an essential part.
A large quantity of code has been written, tested and integrated over a period of more than one year. On the other hand, I expect a lifetime of 20 years for my installation. Some parts will probably have to be maintained or even changed during this period. I hope I'll be able to reuse my software without any major changes when it happens.
In order to minimize the "technological risks" related to obsolescence I have adhered to a few programming standards that may have a good chance to last for years:
- Android + Java: open Operating System
- Linux + Python: open Operating System
- HTML + CSS + Javascript + PHP : Universal standards
- C language: partly portable universal standard language
Regarding the communication media I have also chosen the most current standards, hoping they will be long-lasting :
- CAN bus
- Ethernet
- Wifi
- Bluetooth
Intellectual property
All the code involved in this project has been written by my friend Gilles KREBS and myself, or belongs to one of us. The applicable license is Creative Common 3.0 CC-NC-SA.
-
Frequently Asked Questions
08/19/2014 at 13:53 • 0 commentsWhen I show my PV system to my friends, they often ask following questions:
Q: How much did your PV system cost ?
A: The total budget is close to 14 000 €Q: What about the ROI (Return On Investment) ?
A: It will take 20 years to amortize the installation with the current electricity price (0.12 €/Kwh). If this price rises, it will take less time...Q: Is it an expensive engineering gadget or does it really work ?
A: it really works. From end of winter to end of autumn, the production is sufficient for our daily needs (4 people family). During summer we even have large surpluses. We use all our traditional appliances without restrictions: dishwasher, electric kitchen oven, washing machine and even the clothes dryer, sometimes 3 times a day. The only change I made was to replace traditional bulbs by LED lights. A well designed PV system produces plenty of energy and provides a high level of comfort to the inhabitants.
My Off-grid Solar System Monitoring
How I did to remotely control and monitor my home made Off-grid Photo voltaic System