jeromekelty
-
Build Log 4- accelerometers
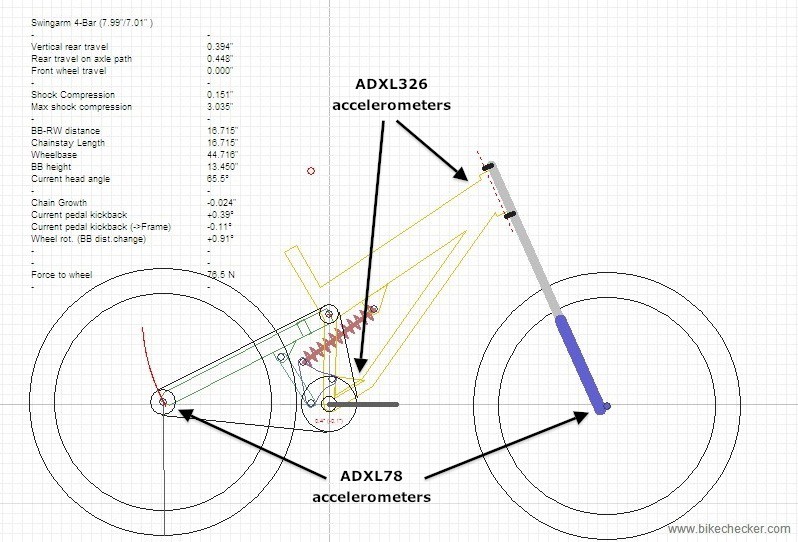
08/14/2014 at 06:13 • 2 commentsThe linear sensors will measure the suspension travel vs. time but I also need four accelerometers to measure the vertical axis g-forces at the front and rear axles and at two points of the main frame- near the steerer tube and crankset. The axles will see upwards of 40 g so I'll use an ADXL78 accelerometer mounted as close to the axle as possible. The accelerometers mounted to the two frame positions will be the ADXL326 since the frame will see a much lower vertical force at these points.
![]()
With this setup I'll be able to take readings that reflect the difference in suspension settings relative to what is happening at the wheels. If I ride over a specific course over and over I can compare the the accelerometer readings in the frame and axles at any given point in time and immediately see what changes are created by altering compression and rebound damping settings.
-
Build Log 3- More circuit testing
08/13/2014 at 19:04 • 0 commentsI assembled the charging and battery monitoring circuit and tested my circuit (minus the XBee radio, which I don't have yet) and checked out the low voltage warning as well as current draw. The Sparkfun Uh-Oh battery monitor is super simple to use - just adjust the trim pot to the voltage cutoff you want and the big green LED turns on when the battery voltage drops to that point. It's possible to solder a couple of wires to the Uh-Oh board and connect it to the Spark Core and have the Spark Core send my phone a message when the battery voltage drops but really that's kind of overkill- the big green LED tells me everything I need to know and it'll be easy for my kids to see when using this for their projects.
![]()
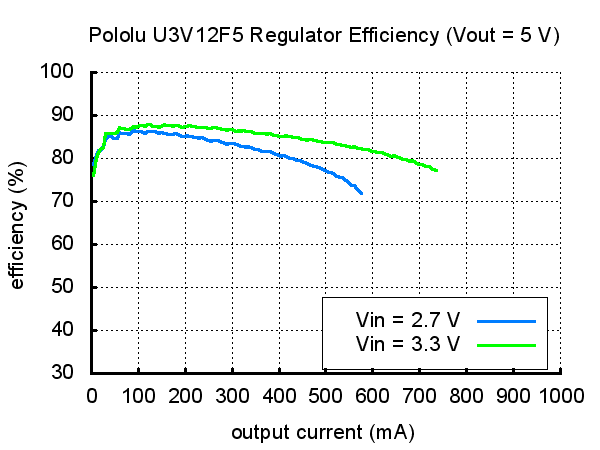
I also checked the current draw and it's just under the specs on the Spark Core data sheet since I was getting 280mA draw with the OpenLog writing at full speed. The OpenLog draws around 6mA at full speed. The XBee Pro is supposed to draw around 215mA so I should see a bit north of 500mA total current draw when the circuit is fully assembled. The Pololu 5V boost regulator is good for about 700mA so I have a little bit of headroom there. Right now the battery monitor is set to turn on at 3.2V so I may play around with that a bit once the circuit is finished. Here's the current output vs. voltage input graph of the Pololu 5V boost regulator.
![]()
-
Build Log 2- linear sensors
08/13/2014 at 04:56 • 2 commentsTwo readings I want to take are the position of the suspension fork and rear shock. This will show me the amount of suspension compression as well as the rate of compression and rebound. This is typically measured using a linear potentiometer but it has also been done using an acoustic transducer or linear velocity transducer. A good quality linear pot would be the Active Sensors CLS 1322 series and a 100mm sensor cost is around $180- and I need two pots. While that is a very competitive price it's still too high for me so I've been working on a less expensive solution.
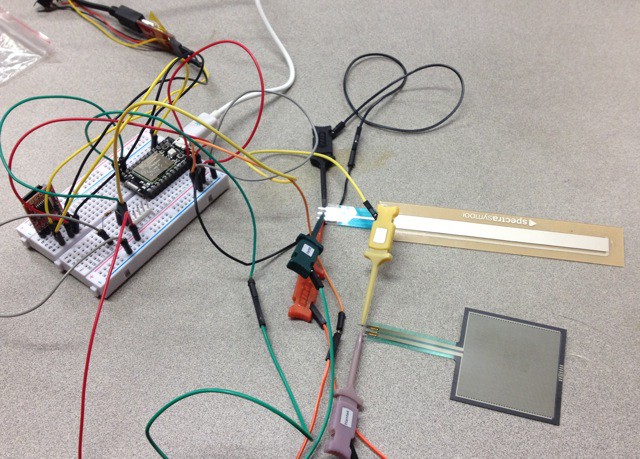
My idea is to use a Spectra Symbol SoftPot membrane potentiometer and a small Igus linear slide to create a low cost linear pot. I'll make an Aluminum backing plate and the SoftPot wiper will attach to the sliding block on the Igus linear slide. I'll also have to figure out some way to make a cover...
![]()
-
Build log 1- prototyping
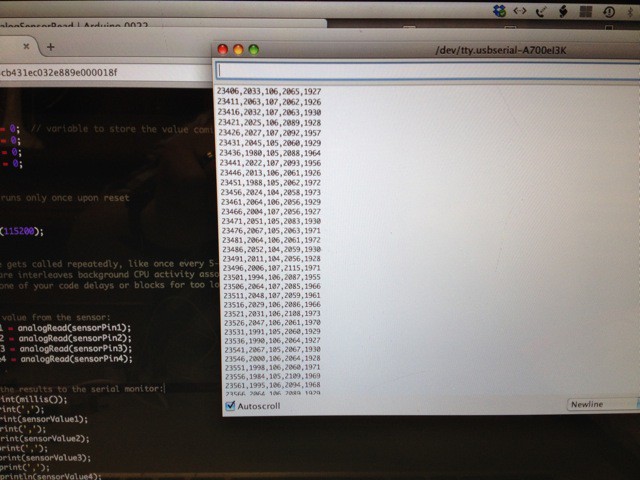
08/12/2014 at 18:52 • 0 commentsThe first thing I did was play around with the Spark Core and OpenLog with a bit of code and a few random sensors to see what kind of data rates I could get. I quickly stuck everything on a breadboard and wrote a bit of code to log some data. The Tx line from the Spark Core was connected to a FTDI adapter so I could view the data in a serial monitor as it was being written to the OpenLog SD card. Worked like a charm! I was logging data at 200Hz (one reading per sensor every 5 milliseconds.) To put that in perspective, the RaceTech ShockClock data logger logs 2 readings approximately every 4 milliseconds. Given that it takes roughly 25ms @30mph for a 26" wheel to absorb the upward impact of a 4" tall square edged bump I think 200Hz will be fine.
For the sake of comparison I also tried logging with an Arduino Uno and I was able to get data logged on average around 500Hz (it would start out around 1KHz and then drop to around 700Hz before settling down to an average of 500Hz.) I also tried an Arduino Pro Mini 3.3V I had on hand and it wasn't any faster than the Spark Core. Interestingly the Pro Mini would slow down dramatically as I logged more channels.
![]()
![]()
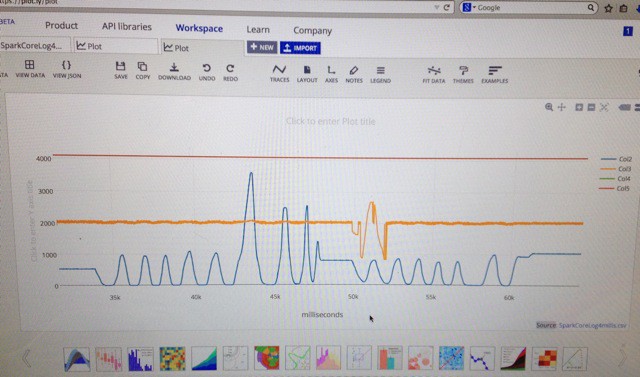
I removed the SD card and renamed the .TXT file as a .CSV file and plotted the data on a graph using Plot.ly -piece of cake!
![]()
DIY Data Logger
An easy to build wireless data logger that I'm using to analyze mountain bike suspension performance