Sensor system:
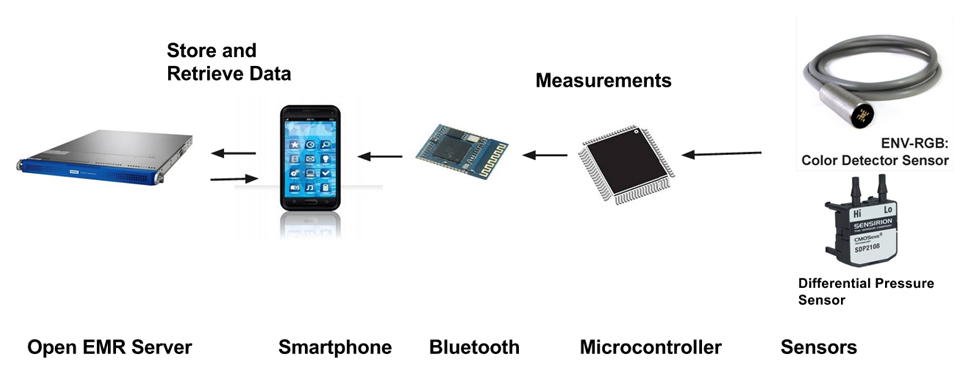
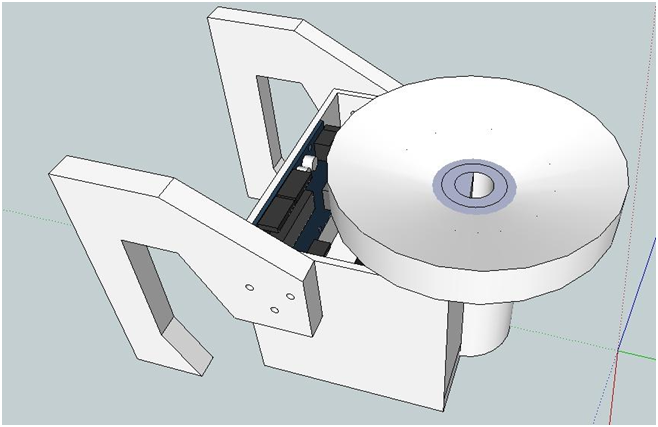
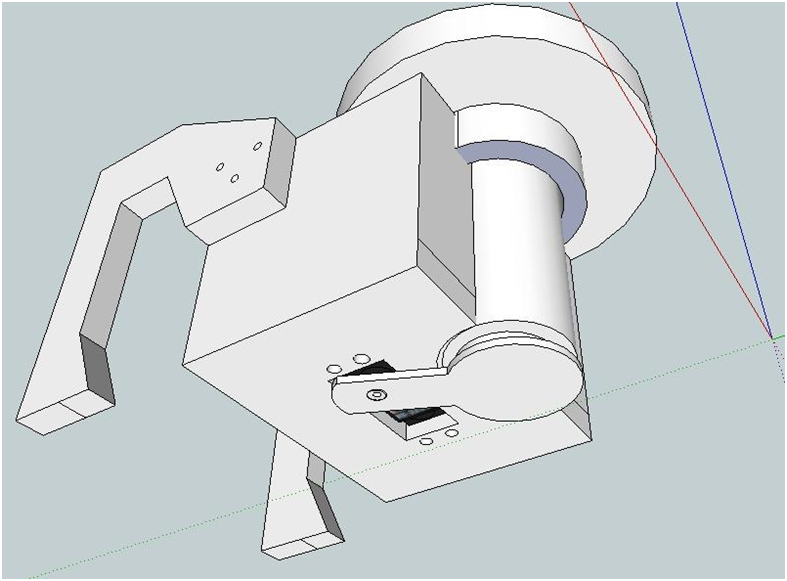
The measurement system consists of a small urine collection device embedded in the user’s toilet. Urine enters the device through a funnel and is collected in a small measurement area. There, a color sensor measures the color of the urine. The color sensor is controlled by an arduino microcontroller. The color sensor communicates with the arduino via a serial connection.
Two gauge pressure sensors are used to calculate the difference in pressure between two points in the column of liquid. The pressure between the two points in a column of a liquid is related by the height between the points, and the density of the liquid. Because the height between the points and the area of the column is fixed, these two pressure measurements give us a method of determining the liquids density, which is directly related to the specific gravity. The pressure sensors are both on a single SPI bus on which the Arduino is the master.
The Arduino individually selects each of the sensors by manipulating the Slave Select line of each sensor, and then proceeds to clock data to receive the readings from the sensors. The pressure measurement is computed by converting the received bit stream into a pressure reading. This measurement is then converted to a measurement of specific gravity by finding the difference between the two pressure readings, given the other parameters of the fluid column and height difference between the pressure sensors.
Other sensors like pH, specific gravity, or absorption spectrum can be incorporated into this embedded device to provide additional functionality. Information from the sensors is then transmitted via bluetooth to the users smartphone. The arduino controls the bluetooth module using a serial connection.
Data management:
The users smartphone receives the data and an application sends it to a modified open EMR server. The open EMR server has been extended with php scripts to store the urine information in a custom table within the database. Other sensor information can easily be added to the table. The smartphone application can also pull data from the server to show the user past hydration data. The server also supports querying for specific data, for example, all urine data between two dates.
Data Interpretation:
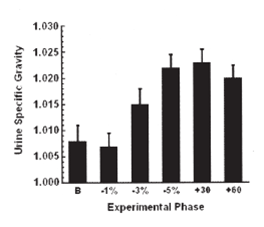
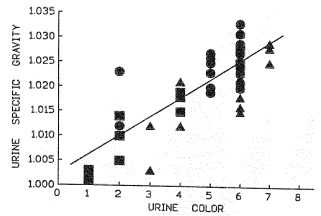
The smartphone app uses information from a urine color chart to provide hydration recommendations to the user based on the measured urine color. Currently in the plan, recommendations are based off of a linear model taken from the RGB values of a color chart. The RGB values from the color sensor are averaged and then compared with this linear model. This should provide a rough recommendation based on the users hydration. The specific gravity value is also presented to the user comparing it with the clinically normal values.
The app will also be able to show hydration trends to the user using information from the server. The team plans to use personal historical hydration data to provide smart recommendations which are tailored to the user.


 IoTool
 Rohan Menon
"Excellent project! I recently came across a project that featured a beer/urine color chart, and I think it would be interesting to see more projects that involve networking. Here's the link to the project: https://www.ahsaasprogram.pk/
I'm also curious about what can be done with the urine after it's been used - such as filtering or recycling it in some way."