6/3/2017 -
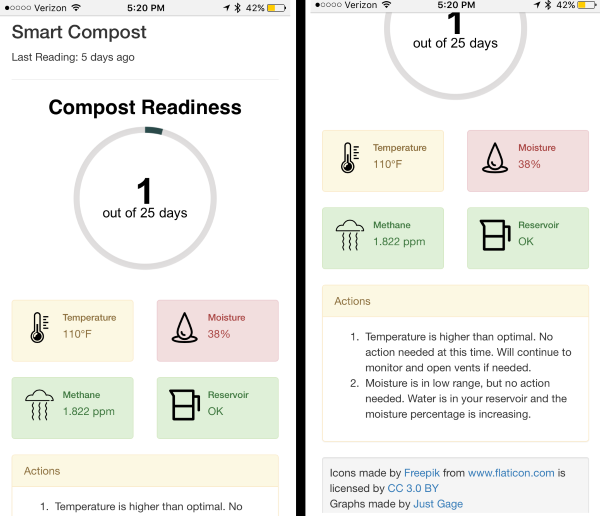
I am in the process of creating a dashboard for the Compost System. The version is still very much in the early stages, but will share what I have created to date:

- The gauge shows the number of days until the compost is ready (25 days at greater that 110 degrees F).
- The sensor indicators are red, yellow, and green based on the state of the sensor
- The actions panel shows the interpretation of the data, and the actions the user must take. This also has a red, yellow, and green indicator.
The dashboard is written in HTML/Javascript, leveraging:
- Bootstrap
- JustGage.js
- icons from Freepik
The data is stored in a SQLite database. The data is retrieved by making a http call to an php.file (see code in attachments section for details).
Right now, the actions are hard coded into the HTML; I am still in the process of writing the logic for determining when a particular action needs to take place. For example, if the temperature is low, but the ambient temperature is low as well, then we would want to wait 5-10 hours to determine if the temperature rises before asking the user to take more corrective actions (e.g. stirring the compost or adding more nitrogen-rich materials).
 Darian Johnson
Discussions
Become a Hackaday.io Member
Create an account to leave a comment. Already have an account? Log In.