-
1About IoTool
IoTool, a multi-awards winning smartphone gateway and API allows IoT research and fast prototyping with minimal costs in domains: IoT, eHealth, Sport & Wellness, Home Automation, Industry 4.0 and Logistics.
Currently IoTool supports more than 100 different sensors with more than 277 sensor readings (like, Arduino, Audio, Bosch XDK, Internal Smartphone, TI SensorTag, Video and similar), 50 actuators (like Arduino, Flic, Internal Smartphone, Lifx and similar) and different types of triggers connected to ordinary smartphone through a very flexible extensions system. Any new sensor, action, actuator, algorithm, trigger or cloud sync uses its own extension (similar like printer drivers). External developers can develop their own extension (usually an extension can be made in hours) and their own UI for any type of IoT solutions.
IoTool works on Android devices (phone, tablet, Android TV, Raspberry PI with Android OS installed). IoTool on smartphone can process (collect, encrypt, store, show values and diagrams, sync to Cloud) up to 24.000 records per second, for example 12 lead ECG with 2000Hz per lead.
IoTool modules:
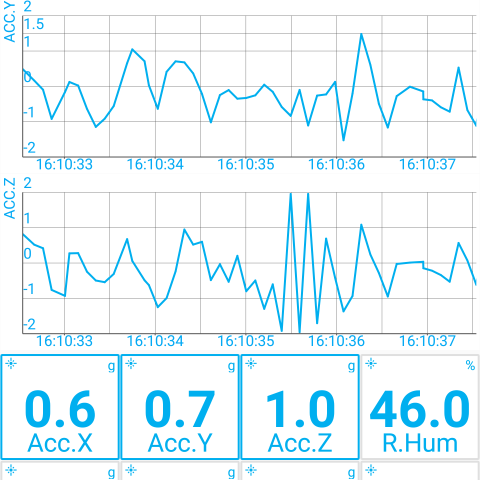
Dashboard
![]()
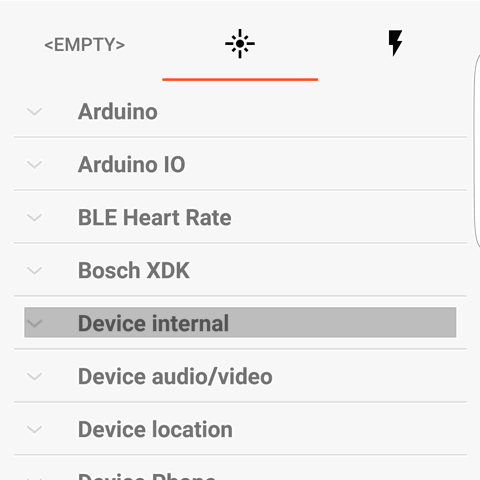
Sensors and Virtual sensors (algorithms)
![]()
Messages
![]()
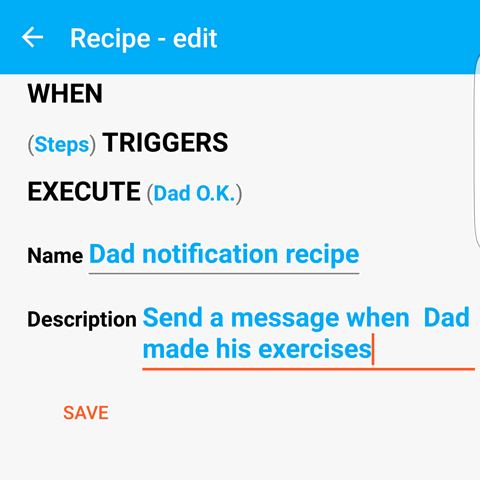
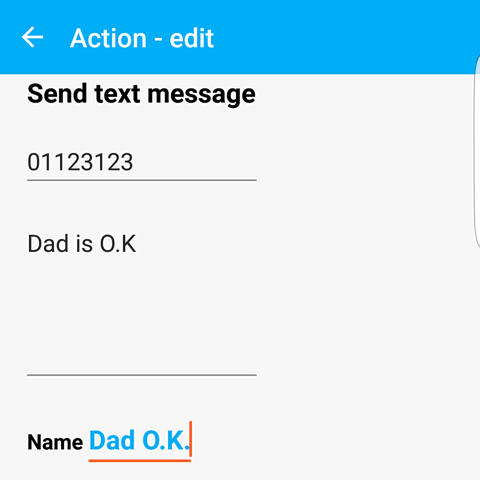
Triggers, Actions and Recipes
![]()
![]()
![]()
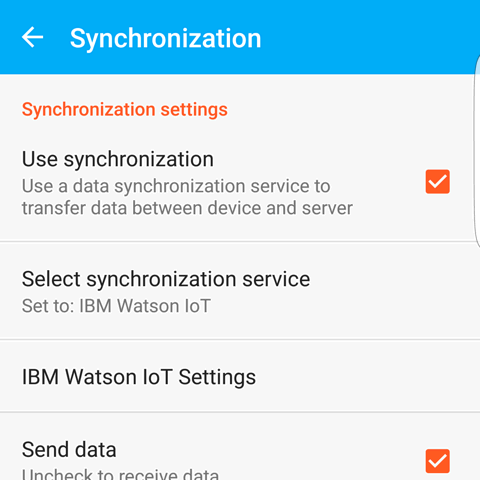
Cloud
![]()
-
2IoTool installation
- Register and Login to IoTool.io
- Select extensions needed for a project
- Download IoTool from the Play Store (link is on iotool.io main page).
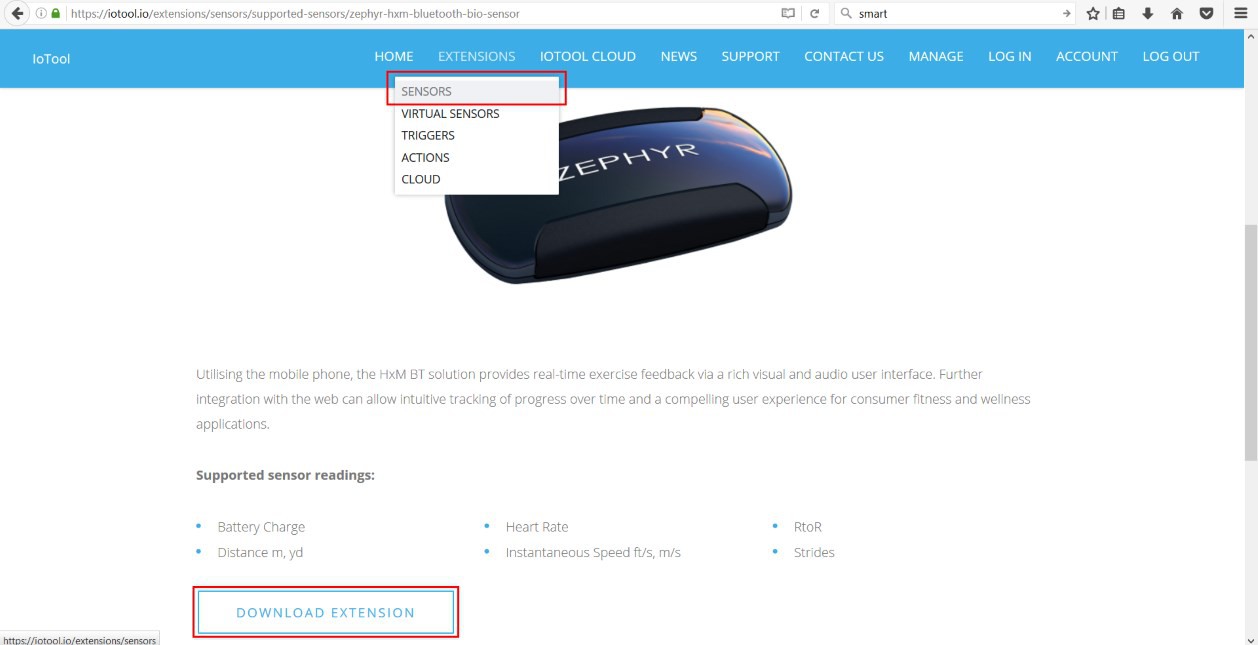
- Select and download sensor extensions (iotool.io / EXTENSIONS / SENSORS) to your smartphone. If you wish to use only internal Android sensors, use "Android sensors - Service: Device internal".
![Extensions]()
![Download]()
-
3IoTool setup and test
- Read the User manual (iotool.io / SUPPORT / USER MANUALS / IoTool User manual) and set up sensors and IoTool dashboard to get the Sensor readings you wish.
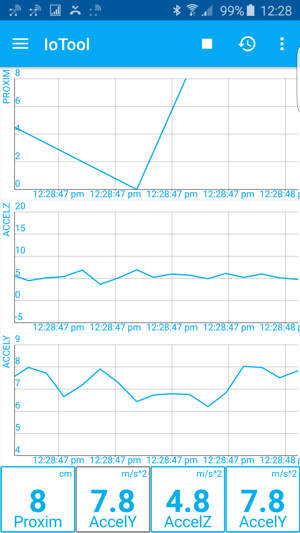
- After the dashboard START button is pressed, you should see all selected Sensor readings on the IoTool dashboard in real-time.
![IoTool-screen]()
-
4Export data to CSV
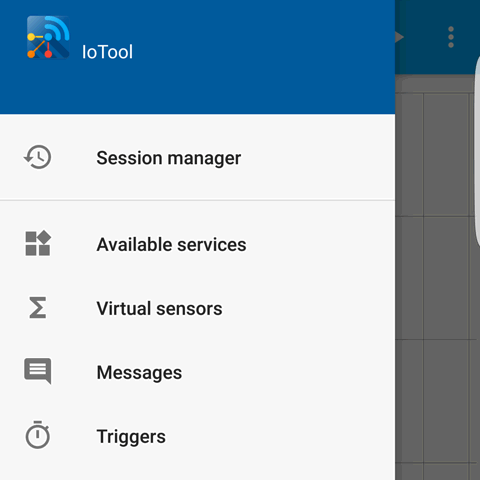
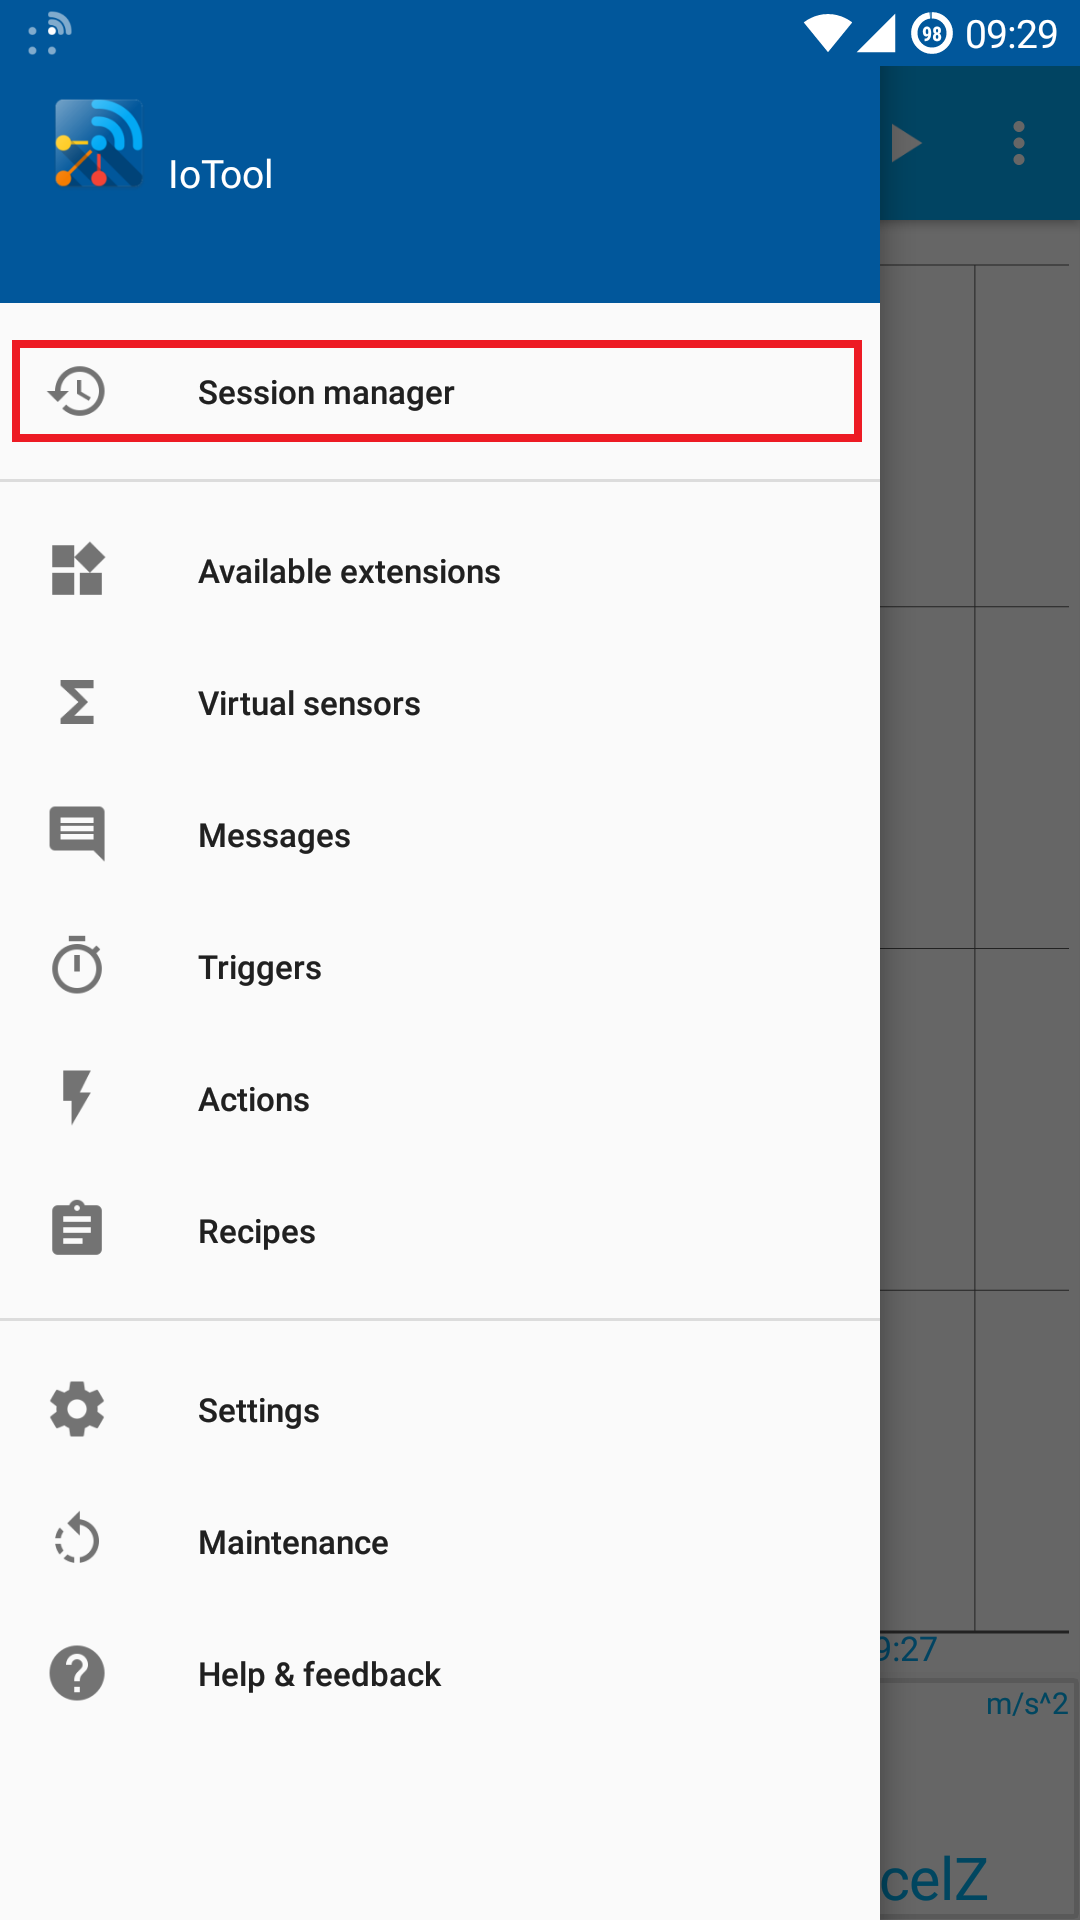
- Open the main drawer and select Session manager.
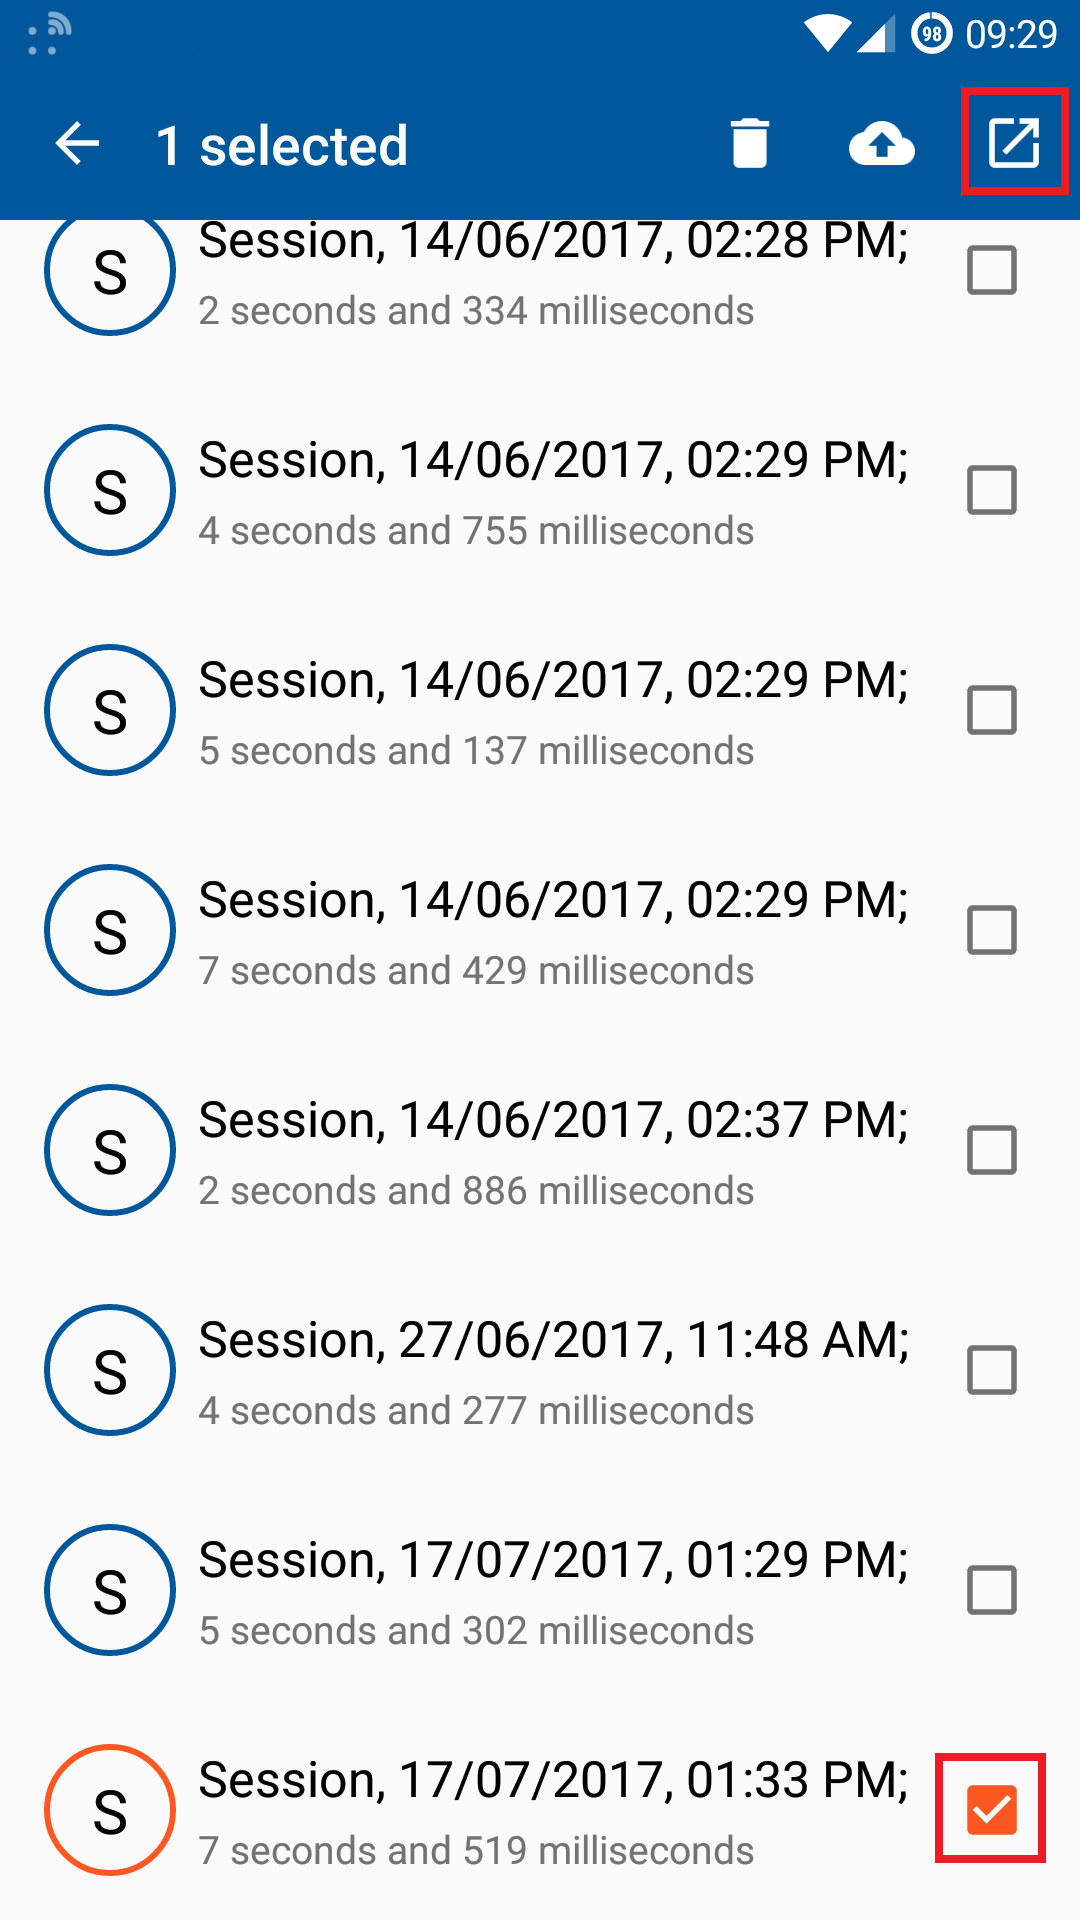
- Find the session you wish to export (newest are at the bottom), long press it and select the Export button in the top right corner. Select the Save/Share method that you prefer.
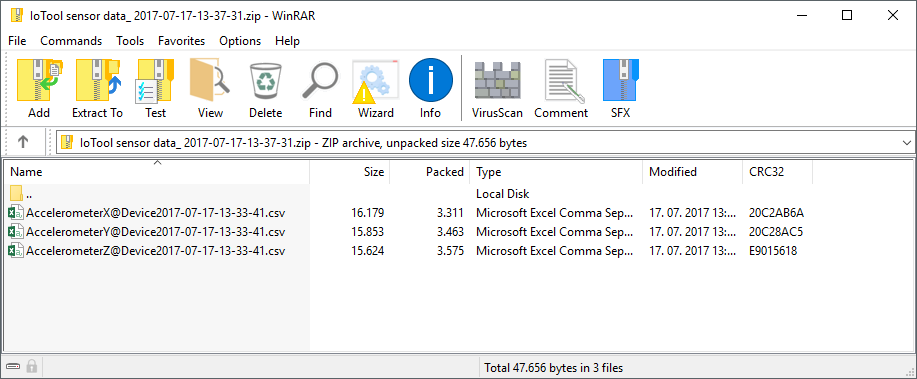
- You will now have a zip file at the location of your choice.
![]()
![]()
-
5Visualize captured data in Microsoft Excel
- Open and extract the saved zip file. Each sensor you recorded will have its own csv file using commas as separators.
- Start a new Excel workbook and import the csv file. If the csv file is opened directly Excel might not recognize the separators.
- The Text Import Wizard will open. Follow it through the steps. Make sure that you have selected only the comma as a delimiter in step 2.
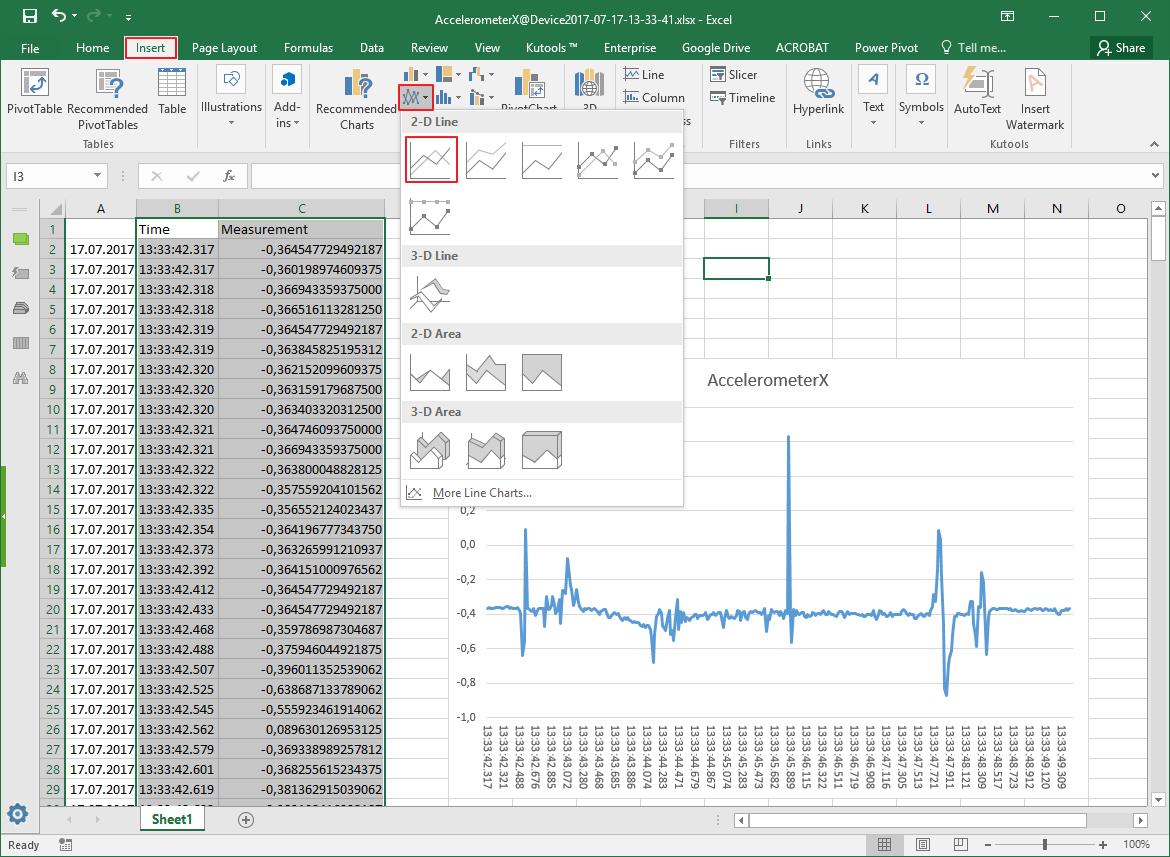
- After the import is done make sure that all values have correct data types. Let’s select the data we want to have graphed and display it using a simple line chart.
- We can now clearly see the sharp movements that were detected by the phone’s accelerometer.
![]()
![]()
![]()
Collect IoT data with IoTool and a smartphone
Learn how to measure, export and visualise sensor data on an Android smartphone using the IoTool app. Valid for many different sensors.
 IoTool



Discussions
Become a Hackaday.io Member
Create an account to leave a comment. Already have an account? Log In.