On my LED matrix I could display the outside temperature/humidity data thanks to OpenWeatherMap API, it simply reads a sensor somewhere near my location which I trust to be correct and calibrated. However, I have never been able to get the conditions inside the apartment. The way this project was designed allows the RPi to be connected yet to another sensor/service and display the data on the LED matrix without modifying it or its firmware.
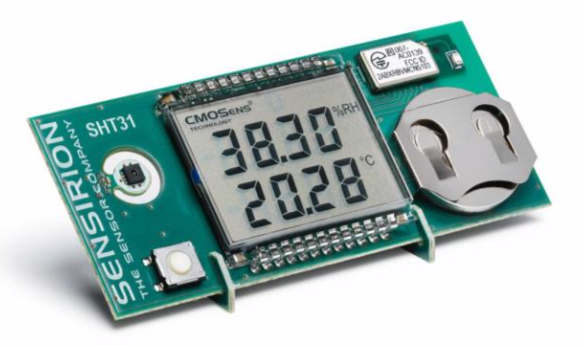
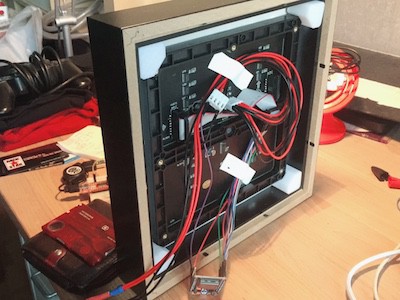
I was able to get my hands on an SHT31 development module. It's a small board, powered by a coin cell, containing the SHT31 temperature/humidity sensor, a screen displaying the data and, perhaps most importantly, a Bluetooth LE module which can be used to retrieve data over the air.
There are some temperature/humidity sensors that use the ESP8266 to convey the data directly over WiFi, I have some as well, the issue with the ESP8266 is its power consumption and the proximity to the sensor, the local heating tends to bias the sensor values. Therefore, Bluetooth LE is a perfect candidate for more accurate readings, for an over-the-air, battery-powered device. On the image above you can see the trouble the PCB designer went though to make sure the sensor is affected as little as possible by the other electronics, by making a cutout around the sensor.
I set myself to get the the SHT31 development board connected to the RPi server and interface it with Node-RED. First, I replaced my RPi 2 server with a RPi 3B+ to have access to the integrated Bluetooth. Then I found this nice project on GitHub that did exactly want I wanted: get the data out of the SHT31 development module using GATT.
Next hurdles were to figure out how to:
Connect to the module to the RPi
Install the SHT31 module dependancies
Customise the output script for my module
Integrate it to Node-RED
---------- more ----------
Pairing and connect to the SHT31 module
The first step was to connect the module to the RPi 3B+, this was relatively straight forward, but needed some trial and error. These are the minimum steps to get the SHT31 development module to pair and connect to the RPi.
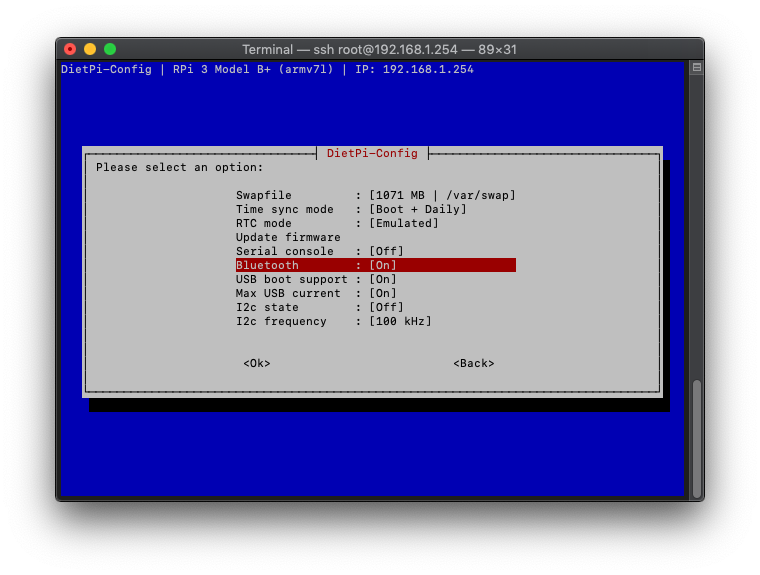
The Bluetooth needs to be enabled on the RPi, in my case it was a matter of calling dietpi-config, go into Advanced Options and turn on Bluetooth:
At this point it's useful to have the SHT31 Bluetooth off, so that you can distinguish it from other Bluetooth devices around. The SHT31 Bluetooth is switched by holding down the button on the board.
Call "bluetoothctl" in the terminal, it'll open the Bluetooth controller from which you'll pair and connect to the SHT31.
Type "scan on", this will start scanning all the Bluetooth devices and shows their MAC address. Enable the SHT31 Bluetooth and wait for it to show up. In my case it was FB:52:05:5E:F9:92.
Type "scan off" to stop the device enumeration.
Type "pair <MAC>", in my case it was "pair FB:52:05:5E:F9:92". Wait for the pairing to succeed (might take a couple of seconds).
Finally type "connect <MAC>" to connect to the device. In my case it was "connect FB:52:05:5E:F9:92".
Type "exit" to quit the bluetoothctl tool.
SmartGadget-GATT
The SmartGaget GATT project on GitHub explains what to install, but here's the quick list of commands to get this done:
The example script that comes with the needs to be adjusted, the MAC address of the module needs configuration and the output is not quite suited for Node-RED.
Edit the copied example file with your preferred command-line editor: nano sht31.py, and modify the MAC address and output type:
import smartgadget
import json
sm = smartgadget.SmartGadget(adapter_name='hci0', device_mac='FB:52:05:5E:F9:92')
data = {"temperature": sm.temperature(), "humidity": sm.humidity(), "dew": sm.dew()}
print(json.dumps(data))
At this point you should be all set to get the data from the SHT31 module, try it out with:
python3sht31.py
You might need to wait for a couple of seconds for the reply to arrive. Then you'll see something like this:
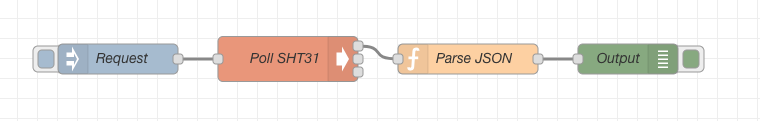
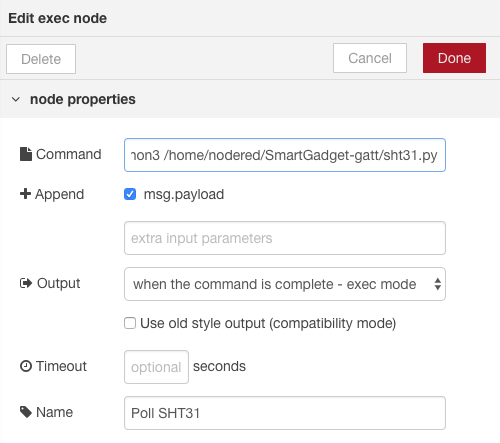
Node-RED provides a nice module to execute a command named "exec". This module is going to call the modified script and wait for the response.
The command entry must be the following:
python3 /home/nodered/SmartGadget-gatt/sht31.py
The script has been modified to output JSON data, but that's a string, in order to get a usable object for the flow it needs to be parsed. Add a JSON node to the output of the "exec" node, name it "Parse JSON" for example.
This is not enough though, Bluetooth is kind of a hardware thing, which requires more privileges than Node-RED usually has. Node-RED needs to be added to the "bluetooth" group with the following command:
usermod -a -G bluetooth nodered
After modifying groups a reboot is required, simply type "reboot".
Finally, when you hit the "Request" button in Node-RED you'll be greeted with the up-to-date SHT31 sensor values and can do whatever you want with them, such as displaying them on a RGB LED matrix.
Conclusion
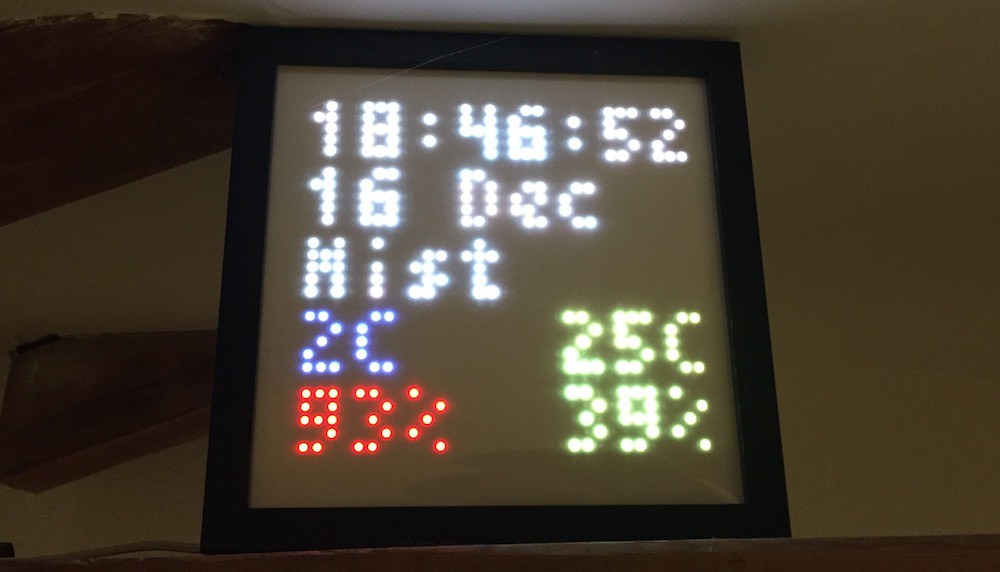
My LED matrix is now displaying the temperature and humidity conditions outside and inside the apartment.
This project wouldn't be complete with instructions on how to set up your own MQTT broker. The MQTT broker is a piece of software, running on a server somewhere in the world (ideally in your own house) where the RGB LED Matrix connects to. The server generates a 32x32 pixel image and sends it to the matrix which displays it.
This log summarises how I set up my server. If you want to learn more about the MQTT protocol I highly suggest this website. However, as far as this project is concerned, you don't need any other prior knowledge than the ability to follow a numbered list:
I used a Raspberry Pi 2 (RPi) to set up the MQTT broker, the RPi hardware version does not really matter for this project as any version can handle the software we're about to install. The purpose is to have an "always-on" tiny computer to update the display.
I like to set up my headless RPis with Diet-Pi distribution in favour of Raspbian. It offers some advantages over the Raspbian Lite (memory, tuning, responsiveness, space usage...). Diet-Pi also makes it easy to install optimised versions of the required packages.
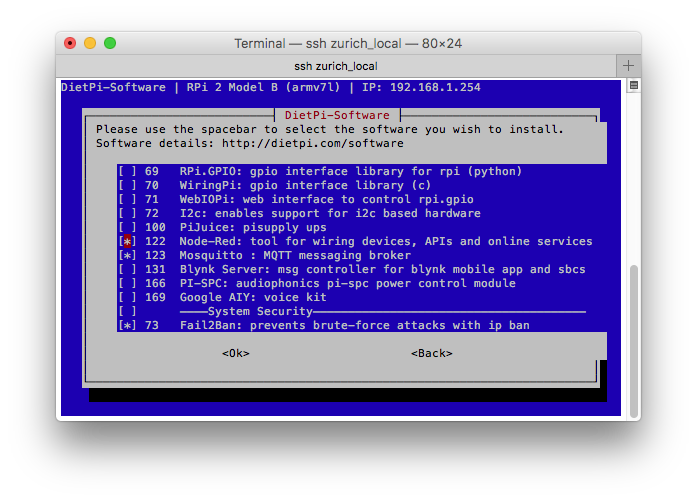
Once the RPi is installed and configured to connect to the local access point it's ready to get the Mosquitto broker and the Node-RED front end:
Type dietpi-software into the command line to get access to the RPi optimised software packages.
Select "Software Optimised".
Check the Node-Red and Mosquitto packages with space bar:
Press "Enter" to get back to the main menu.
Scroll down to "Install" and wait for the system to finish installing the packages.
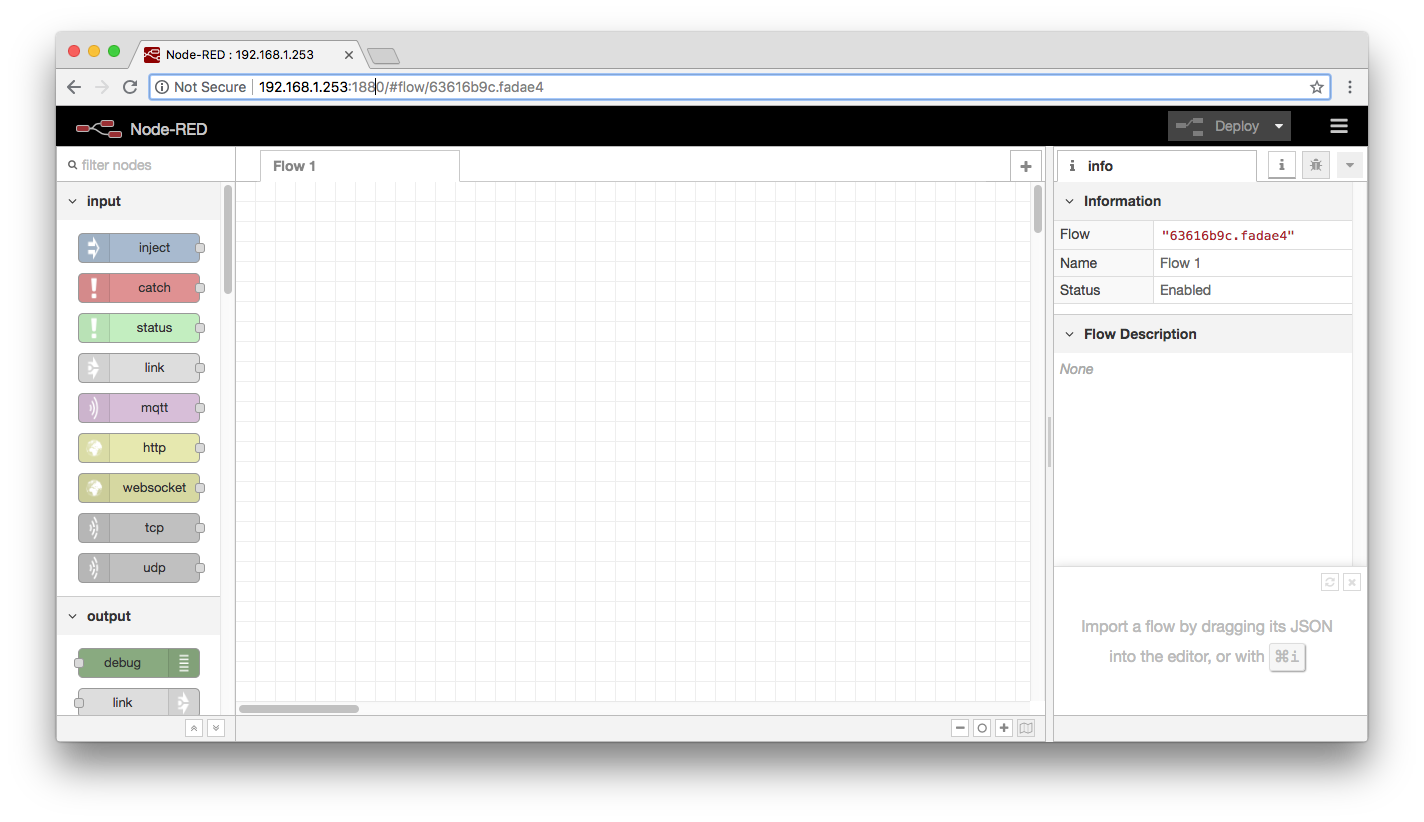
You now have a fresh install if Node-RED that is ready to talk to your Mosquitto broker and exchange messages. Using your web browser navigate to the IP of your RPi on port 1883, for me it is 192.168.1.253:1883. You should see something resembling the following:
It is time to start building the display script. However, I don't expect anybody to have JavaScript skills, so instead simply import the Node-RED "flow" I have prepared. From the right top corner click on "Import" and select "Clipboard". Paste the contents of "rgb_led_matrix_wordclock.js" inside it and press the "Import" button.
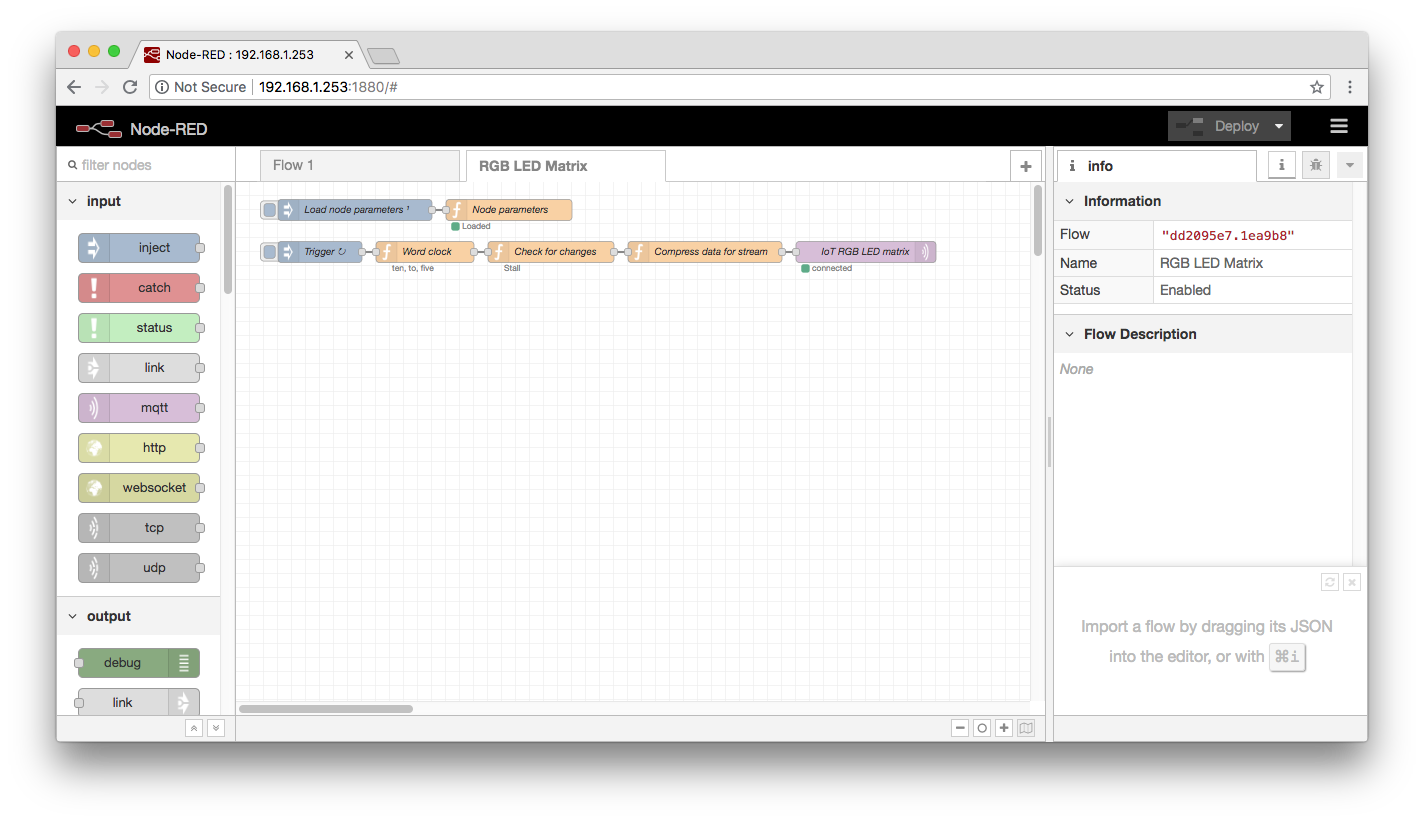
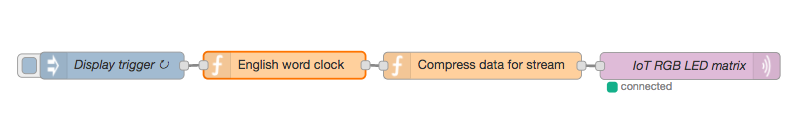
You should see the following new flow in the Node-RED front end:This flow will publish a new message every minute with a topic named "display", this is the topic name the ESP32 should be configured to listen to for this system to work. Click the "Deploy" button for the flow to start.
If you have properly configured your RGB LED Matrix, with the proper access point credentials, IP of the RPi and topic name of the message, then it should be able to receive the messages published by this flow:
You can modify, explore, add all sorts of flow items. Even make flows send messages between themselves. Node-RED is very versatile and graphic aspect allows to visually organise the message flows. Have fun displaying your own data.
I wanted to display some logos on the RGB LED Matrix in view of the MacroFab Design Contest: Blink an LED. I decided to show the Hackaday Jolly Wrencher, the MacroFab logo and Mouser Electronics logo. I found all of these with a simple search, resized and edited them slightly:
The problem was that the Node-RED could only accept RGB values between 0 and 255, not a PNG file. I have yet to program a PNG parser in JavaScript, this wasn't the point of the task though.
I found this nice website that converted PNG images to XLSX files with the RGB pixel values from 0 to 255. The formatting wasn't quite right, so I applied some regex-fu and voilà: an illegible stream of numbers that, when sent to the RGB LED Matrix, would display the following logos:
I couldn't take a video as the update rate of the LED display gave a large black scan line when using my phone camera. That's not visible to the human eye though.
The RGB LED matrix has been functioning for a couple of months now and I have noticed a few bugs. Overall checking this display has become part of my daily routine. I especially like the full control aspect of it (software-wise).
Thanks to its versatility I was able to decide exactly what to show according to my needs, this is how I use it:
I show the time and date, the outside weather, temperature and humidity (To = temperature outside, Ho = humidity outside).
Bugs:
When the ESP loses connection to the MQTT broker on the RPi it struggles to connect again, it will display "MQTT CONNECT" indefinitely. I don't quite understand why this happens and I need to investigate it. I did foresee that happening and prepared it to reconnect in case of loss of communication, but I've learned that the ESP and its WiFi stack are not as reliable as I hoped.
The double buffering sometimes gets corrupted, the screen starts to flash random stuff or flickering. I believe this is due to some corner case, this is extremely rare and difficult to reproduce.
For both of these cases a power cycle helps to put things back in order.
Another issue is that the OTA update does not work, I am not sure why that is, but I cannot upload code over the air as the ESP does not show up in Arduino IDE.
That being said these problems are rare and the hardware is solid. If you want to build one please do and send a picture of how you use it :)
In line of making this project as complete as possible I list in this log the components, where I got them, how much they cost and possible alternatives.
To build this project, while buying all the components, the cost comes down to $40 for the version with the prototyping cables, with the PCB and components it's about $50, this does not include the Node-RED/MQTT server.
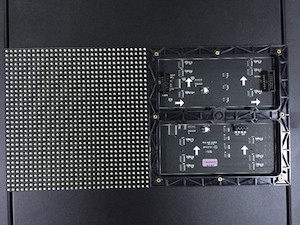
RGB LED Matrix
I won my RGB LED matrix and technically got it for free, it was from Adafruit and is sold for $40. That was the one on all the pictures here. I bought a second matrix to build another one, this time from Aliexpress and it works just as well, but is half the price (including shipping).
The matrix comes with the power supply cable. It has screw-terminal connectors on the input and two JST-VH 4-pole female connectors on the output.
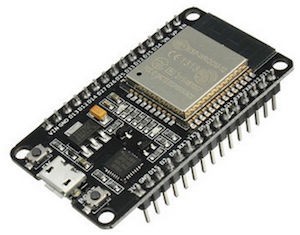
If one is inclined to use the adapter PCB then only the 15-pin version is suited. Otherwise, with prototyping cables, any ESP32 breakout should be compatible, as long as 11 GPIO pins are available (careful: not all GPIO are usable on the ESP32).
Mouser: €8.50 (footprint not compatible with the adapter PCB)
Power supply
These can be bought from eBay/Aliexpress. I cannot provide a source for this one as I salvaged mine from an old appliance. As long as it can output 5V at 2A minimum it should be fine. I would avoid using a phone charger as they can often supply only up to 1A and may overheat and be unreliable. I estimate the cost of this part to about $5.
Note that you need some kind of adapter, crimps, or just plain solder to connect the power supply cable to the matrix power cable.
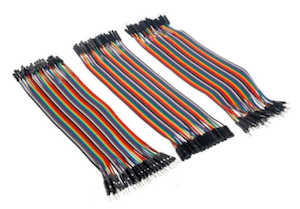
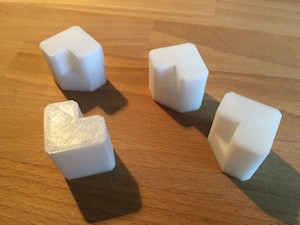
Prototyping cables
If you want to use prototyping cables then those can also be bought from eBay/Aliexpress for very cheap, the result might be messy, but it'll work.
However, Digikey has a minimum order price of about $50 before the shipping becomes free (shipping is about about $20). It might be cheaper to buy from eBay or JLCPCB sister company LCSC (I have no experience with them though).
I rounded the cost of the four 3D printed corners to about $1. This is about 21g of PLA plastic (0.021kg * $30/1kg = $0.63) and 2h or printing time on my slow 3D printer (0.05kW * 2h * $0.2/kWh=$0.02). Of course, this part can be substituted with anything that can position the matrix inside the frame, like wood pieces or some sticky stuff.
Since this project requires an MQTT server and knowledge on how to set it up it makes the building/coding curve a bit steep at first.
I wanted to make this project more accessible and set up my own Node-RED server to publish, once a minute, the english word clock display to a public MQTT broker (HiveMQ) where one can point the matrix to test it:
I updated the dummy configuration file in GitHub repository so this will be the default setting. The time is UTC+1 (Swiss time), so unless one is in the same timezone the clock will be wrong… but good enough for a test.
The other issue with unprotected public MQTT brokers is that anybody can send data to the broker with the same topic name and then the matrix will behave strangely. I simply expect fair usage.
---------- more ----------
Once the matrix is set up and working one can make a private server. How to set up a Node-RED server is a bit out of the scope of this project, but the most important thing, after the set up is the flow design.
The Node-RED flow that generates the english word clock display looks like the following:
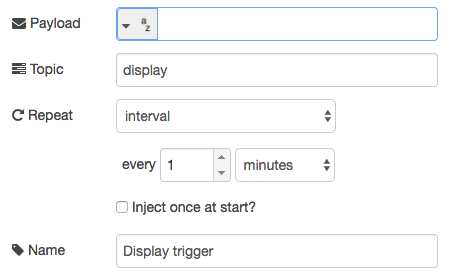
The configuration for the trigger:
The JavaScript code inside the "English word clock" function that generates this display:
var matrix_w = 32;
var matrix_h = 32;
var font_pixel = {
"width": 3,
"height": 5,
" ": "000000000000000",
"<": "001010100010001",
">": "100010001010100",
"%": "100001010100001",
"=": "000111000111000",
".": "000000000000010",
":": "000010000010000",
"-": "000000111000000",
"/": "001001101100100",
"'": "010010000000000",
"0": "011101101101110",
"1": "010110010010010",
"2": "110001010100111",
"3": "110001010001110",
"4": "101101111001001",
"5": "111100110001110",
"6": "011100111101111",
"7": "111001010100100",
"8": "111101111101111",
"9": "111101111001110",
"A": "010101111101101",
"B": "110101110101110",
"C": "011100100100011",
"D": "110101101101110",
"E": "111100111100111",
"F": "111100111100100",
"G": "011100111101110",
"H": "101101111101101",
"I": "111010010010111",
"J": "001001001101010",
"K": "101101110101101",
"L": "100100100100111",
"M": "101111111101101",
"N": "101111111111101",
"O": "010101101101010",
"P": "110101110100100",
"Q": "010101101111011",
"R": "110101111110101",
"S": "011100010001110",
"T": "111010010010010",
"U": "101101101101011",
"V": "101101101010010",
"W": "101101111111101",
"X": "101101010101101",
"Y": "101101010010010",
"Z": "111001010100111",
"a": "000110011101111",
"b": "100110101101110",
"c": "000011100100011",
"d": "001011101101011",
"e": "000011101110011",
"è": "110011101110011",
"f": "001010111010010",
"g": "000011101011110",
"h": "100110101101101",
"i": "010000010010010",
"j": "001000001001110",
"k": "100101110110101",
"l": "110010010010111",
"m": "000111111111101",
"n": "000110101101101",
"o": "000010101101010",
"p": "000110101110100",
"q": "000011101011001",
"r": "000011100100100",
"s": "000011110011110",
"t": "010111010010011",
"u": "000101101101011",
"v": "000101101111010",
"w": "000101111111111",
"x": "000101010010101",
"y": "000101101010100",
"z": "000111011110111",
};
// General canvas drawing function, draws a black image by defaultfunctiondraw_canvas(callback){
// Allocate screen datavar data = newArray(32*32);
// Initialise image data to black screenfor(var i = 0; i < data.length; i++)
{
// Set chars instead of numbers
data[i] = {"red": 0, "green": 0, "blue": 0};
}
// Call the callback to fill the rest
data = (callback)(data);
return data;
}
// Helper function to set a pixel value within limitsfunctionsetPixel(data, x, y, color){
if(x >= 0 && x < matrix_w && y >= 0 && y < matrix_h)
{
data[y * matrix_w + x] = color;
}
return data;
}
functiondraw_letter(data, pos_x, pos_y, letter, color = {"red": 1, "green": 1, "blue": 1}, font_type = font_pixel){
if(font_type[letter] === undefined)
{
return;
}
for(var y = font_type["height"] - 1; y >= 0; y--)
{
for(var x = font_type["width"] - 1; x >= 0; x--)
{
// If pixel is set draw itif(font_type[letter].charAt(y * font_type["width"] + x) == 1)
{
data = setPixel(data, pos_x + x, pos_y + y, color);
}
}
}
return data;
}
functiondraw_text(data, pos_x, pos_y, text, color = {"red": 1, "green": 1, "blue": 1}, font_type = font_pixel){
// Return immediately when text is not providedif(!text)
{
return;
}
// For every letter draw it on the canvasfor(var i = 0; i < text.length; i++)
{
// Add one pixel width between letters
data = draw_letter(data, pos_x + i * (font_type["width"] + 1), pos_y, text[i], color, font_type);
}
return data;
}
functiondraw_english_clock(data){
var d = new Date();
// Get the hourvar hour = d.getHours();
var hour_text = ["midnight ", "one", "two", "three", "four", "five", "six", "seven", "eight", "nine", "ten", "eleven", "twelve", "one", "two", "three", "four", "five", "six", "seven", "eight", "nine", "ten", "eleven"];
// Get the minutesvar minute = d.getMinutes();
var minute_text = ["", "one", "two", "three", "four", "five", "six", "seven", "eight", "nine", "ten", "eleven", "twelve", "thirteen", "fourteen", "quarter", "sixteen", "seven- teen", "eighteen", "nineteen", "twenty", "twenty- one", "twenty- two", "twenty- three", "twenty- four", "twenty- five", "twenty- six", "twenty- seven", "twenty- eight", "twenty- nine", "half", "twenty- nine", "twenty- eight", "twenty- seven", "twenty- six", "twenty- five", "twenty- four", "twenty- three", "twenty- two", "twenty- one", "twenty", "nineteen", "eighteen", "seven- teen", "sixteen", "quarter", "fourteen", "thirteen", "twelve", "eleven", "ten", "nine", "eight", "seven", "six", "five", "four", "three", "two", "one"];
// Construct the minute phrasevar time_text = minute_text[minute]
if(minute === 0)
{
// Exact hour is an exception
time_text = hour_text[hour] + " o'clock";
}
elseif(minute <= 30)
{
// Before and on 30 minutes it is past the current hour
time_text += " past " + hour_text[hour];
}
else
{
// After 30 minutes it is "to" the next hour (modulo 24)var next_hour = (hour + 1) % 24;
time_text += " to " + hour_text[next_hour];
}
time_text = time_text.split(" ");
draw_text(data, 1, 1, "It is", {"red": 255, "green": 255, "blue": 255});
draw_text(data, 1, 7, time_text[0], {"red": 255, "green": 255, "blue": 255});
draw_text(data, 1, 13, time_text[1], {"red": 255, "green": 255, "blue": 255});
draw_text(data, 1, 19, time_text[2], {"red": 255, "green": 255, "blue": 255});
draw_text(data, 1, 25, time_text[3], {"red": 255, "green": 255, "blue": 255});
return data;
}
msg.payload = draw_canvas(draw_english_clock);
return msg;
The JavaScript code inside the "Compress data for stream" function that compresses the data for transfer:
var rgb = new Buffer(msg.payload.length * 2);
for(var i = 0; i < msg.payload.length; ++i)
{
// Maximum values are 255, divide by 16 to get 4 bits per pixelvar red = (msg.payload[i].red >> 4);
var green = (msg.payload[i].green >> 4);
var blue = (msg.payload[i].blue >> 4);
// Send 2 bytes per pixel
rgb[i*2] = (red & 0xff);
rgb[i*2+1] = (green << 4) + (blue & 0xf);
}
msg.payload = rgb;
return msg;
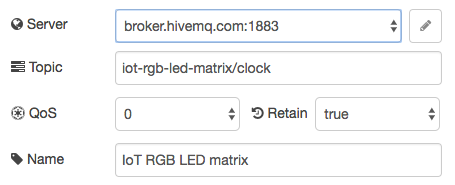
The configuration of the broker in the last node must obviously be different if one implements it on their own server, at least don’t use the same topic name:
All this will get you started on your very own display styles and graphics.
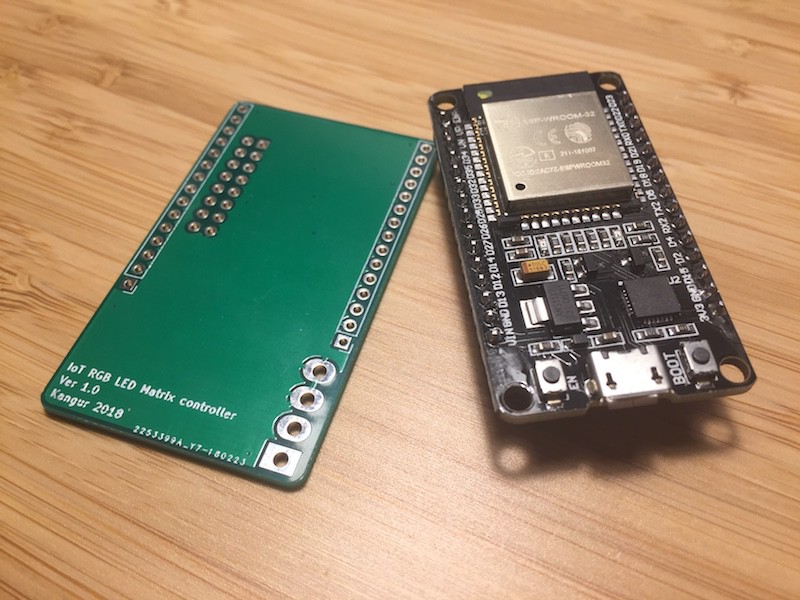
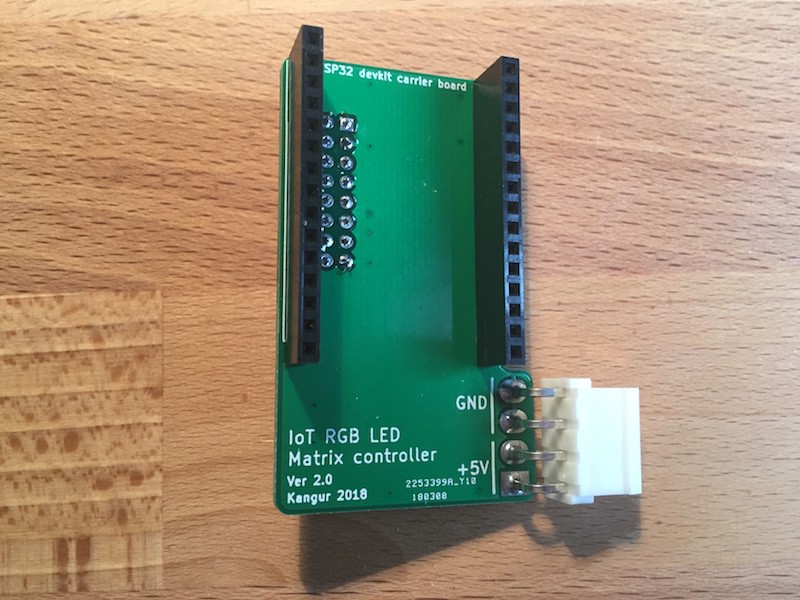
The wires inside the frame were bothering me, it was messy and unreliable. Any movement of the frame might have made the device inoperable and it was easy to make connection mistakes. On the other hand the ESP32 module needed so many passives and soldering without an oven was impossible.
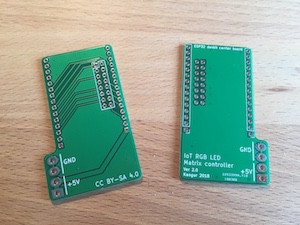
I decided to make a breakout for a breakout. I designed a board around the ESP32 devkit board that had the footprint for the RGB matrix connector, the ESP32 devkit module and also for the 5V power input connector. The devkit breakout of the ESP32 module already had a voltage regulator from 5V to 3.3V and all the bits for programming (USB-UART, Micro-USB connector…).
I rolled my PCB:
Looks good right? But...
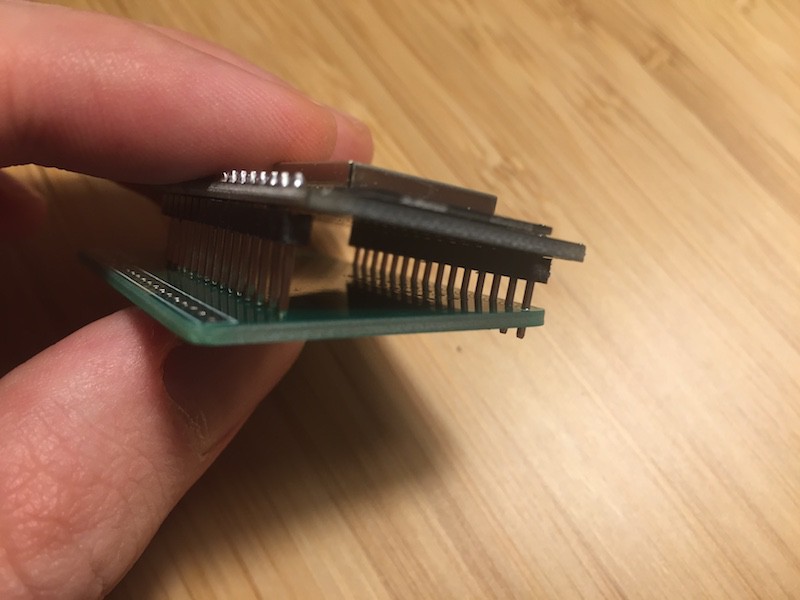
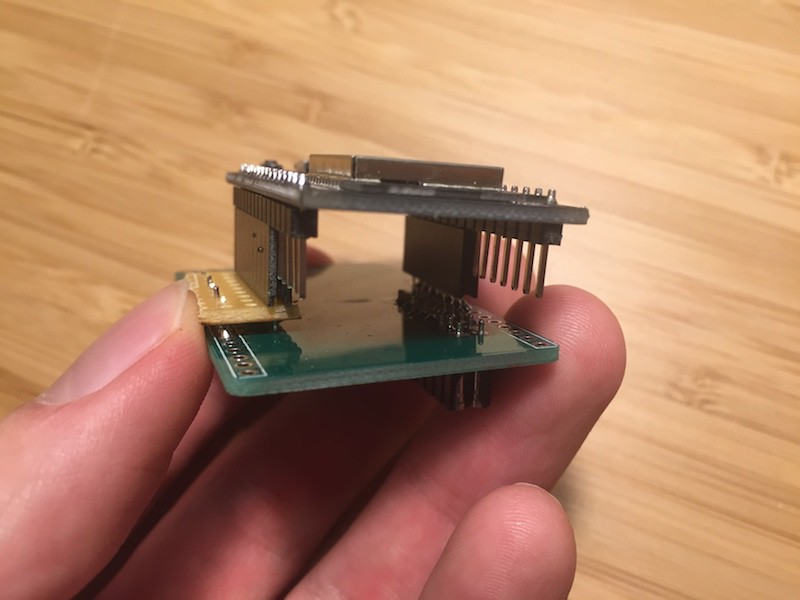
This was a pretty hard fail, the board was so easy to make that I didn’t even double check the ESP32 devkit footprint. I did however succeed in testing it before I reordered a corrected batch:
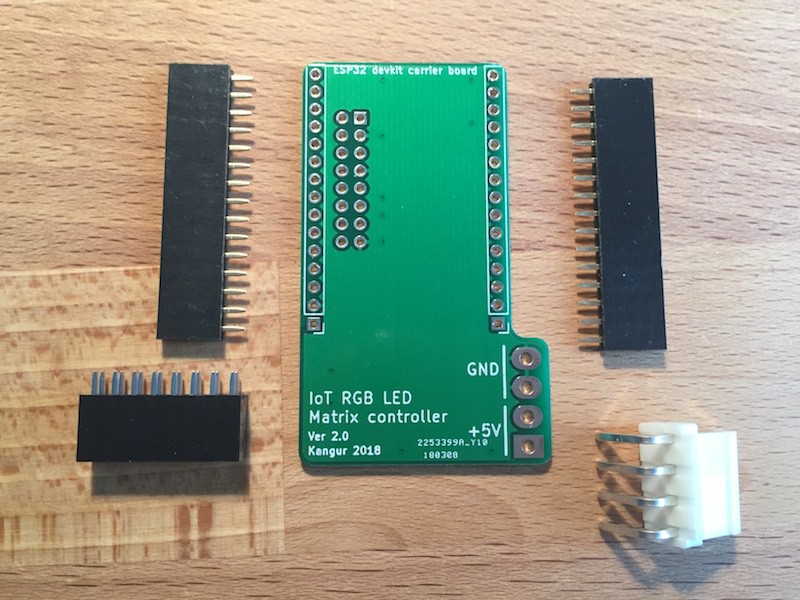
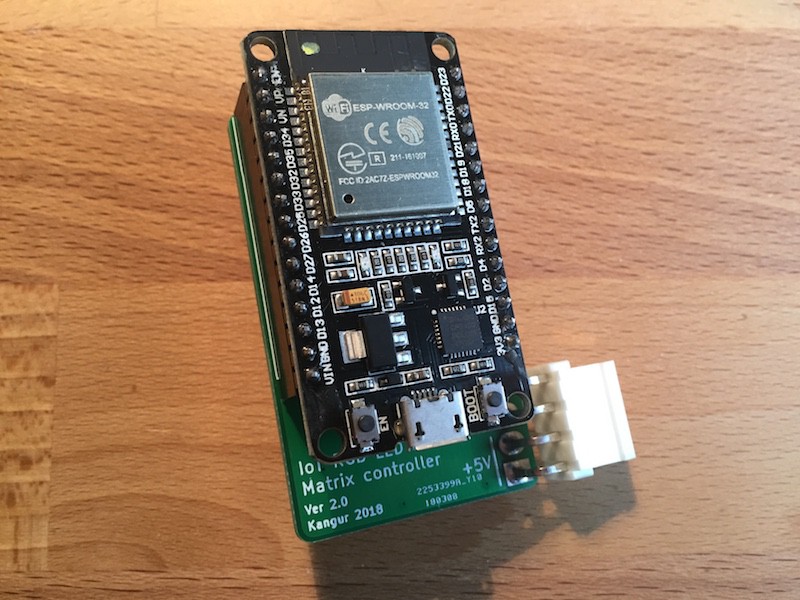
My second try worked out well (traces are on the other side):
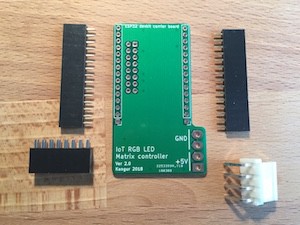
1x, 4 pin, JST-VH, male connector, 3.96mm pitch, part number: B4PS-VH(LF)(SN)
The 15 pin connectors are not really needed, the ESP32 devkit module can be soldered directly to the board. The female connectors are handy so, but they make the ESP32 module touch the backside of the frame...
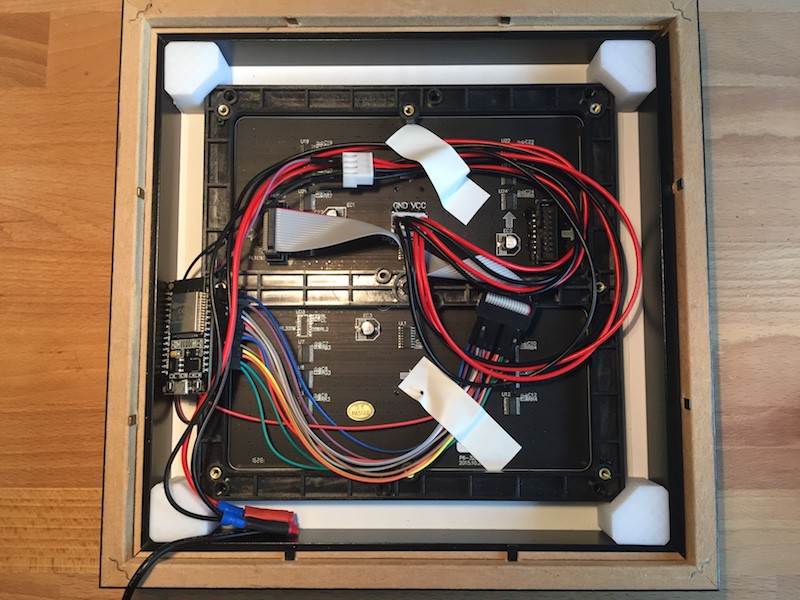
This was the insides before:
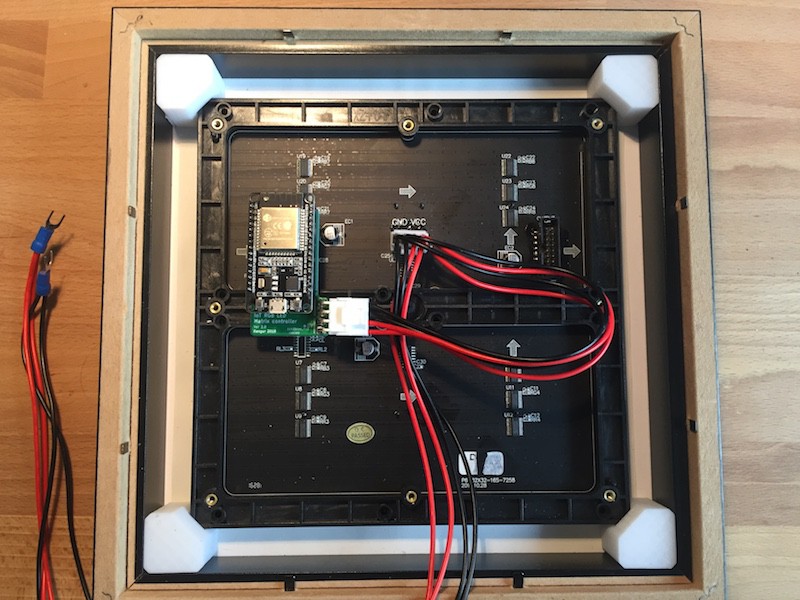
And now:
The power cable came with the matrix. It has two outputs, presumably to power a second screen.
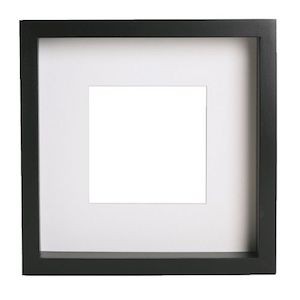
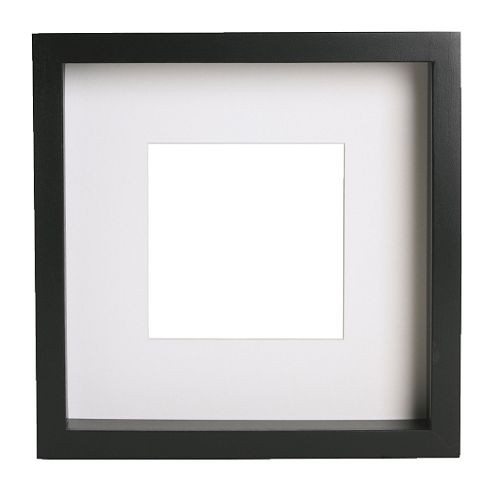
Recently, while moving and getting some furniture from IKEA, I found the perfect frame to host the RGB matrix, the RIBBA frame:
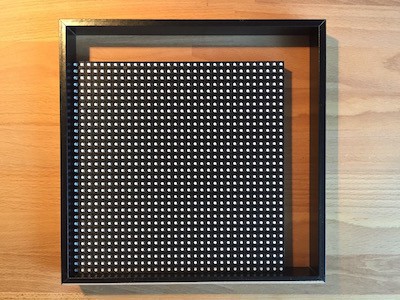
The matrix is 190.5mm x 190.5mm x 14mm, the frame is 230mm x 230mm x 45mm, plenty of space for the matrix and the electronics. The frame has a white cardboard insert that can be cut to the matrix size:
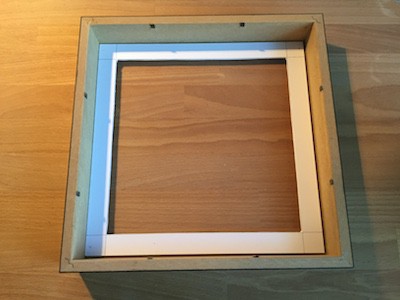
However the matrix will not be centred...
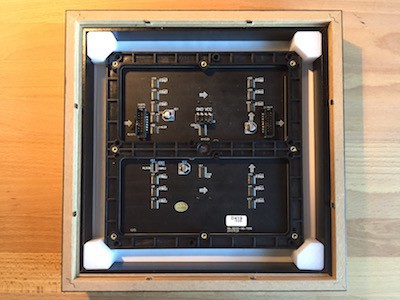
So I 3D printed some corners to center the matrix in the frame and push it against the front face:
The electronics are not looking very professional though, I need to rethink that, wires are pretty unreliable...
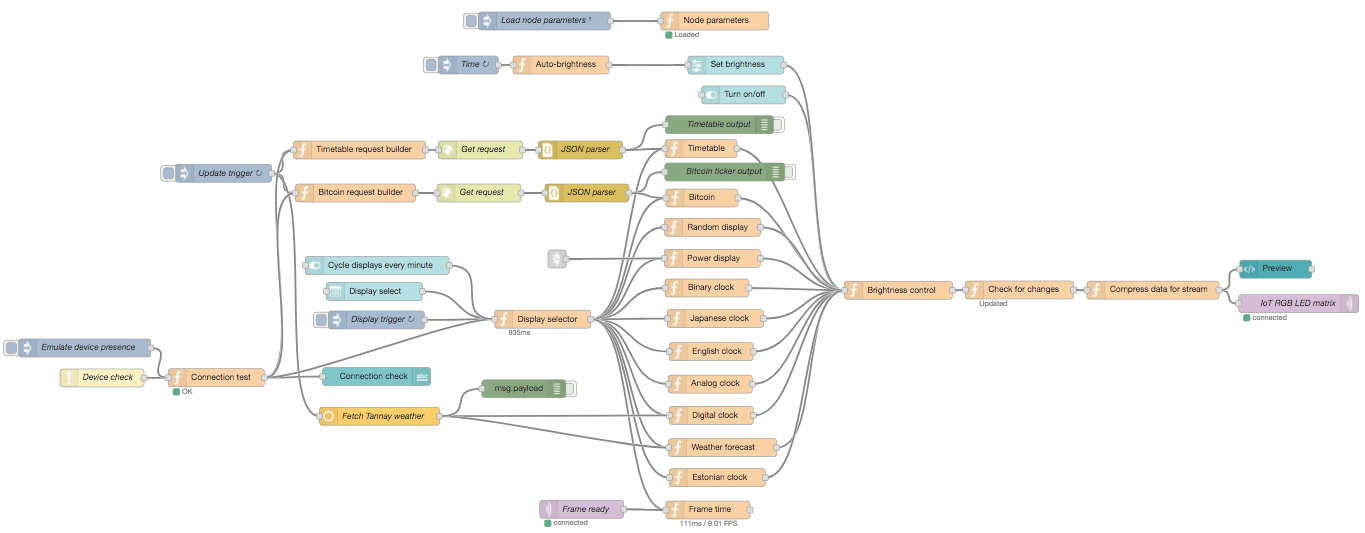
Writing the ESP32 firmware, with all its timing critical constraints, was only half of the job, the actual image generation happens on an MQTT server (hosted on a Raspberry Pi). I've made one of my most complex flows:
It does the following things:
Fetch the data from different sources (weather data, public transport, Bitcoin value)
Parse the data according to selected display
Evaluate the screen update rate (the ESP32 sends back a "heartbeat" message every time it is updated)
Ping the matrix to make sure it is present
Send the data to MQTT only if the pixels have changed and the matrix has been successfully pinged
Apply a "brightness filter" to set the pixel intensity level according to the user settings
Compress the data to a binary stream for efficient transport (as efficient as it can be made with this framework...)
Update the Node-RED user interface
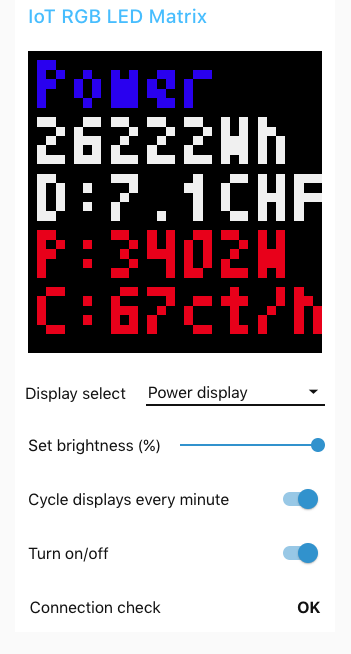
In the user interface one can:
See the preview of what is currently displayed
Select the matrix display
Set the LED brightness
Change the display every minute (selects the next one in the list)
Turn off the LED matrix (send a black screen and then stop sending updates)
Having highly limiting restrictions is a fun way to practice problem solving and creativity. In the case of the 32x32 pixel matrix I wanted to have lots of information on the display, but were challenged by the resolution. Despite this limitation it was possible to achieve very interesting things.
I programmed the animations using JavaScript and tried out different designs in a browser.
This project being an Internet-of-Things device I wanted to fetch interesting and relevant information off the internet and local sensors and display them.
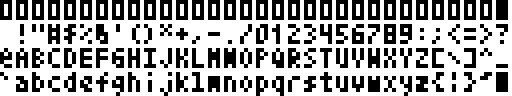
Super tiny font
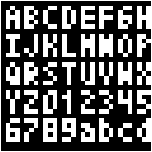
I searched for a small font to display human-readable letters to convey information. I found the TomThumb font which squeezed latin characters in a 5x3 area, if you think about it it's pretty amazing how our brain can distinguish them at such low resolution (context helps a lot though):
I had to adapt some letters, as not all of them perfectly fitted the 5x3 area (g, j, p, q, y). This amazing font allowed 32/4=8 characters per line and 32/6=5 lines of text:
Animations
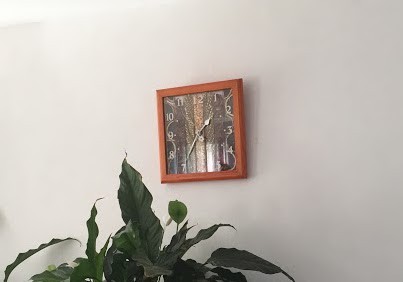
The first thing that I wanted to display was time. My ultimate goal was to replace my dad's wall clock:
Here are the animations I came up with:
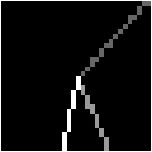
Analog clock
This one was pretty easy, simply evaluate the angle from the hours, minutes and seconds and draw lines from the center to the edges. I liked the way the hands extend up to the very edges of the matrix. One can tell which hand is which by the intensity of the hands.
I also tried to use red, green and blue colours to distinguish the hands, but it was atrocious.
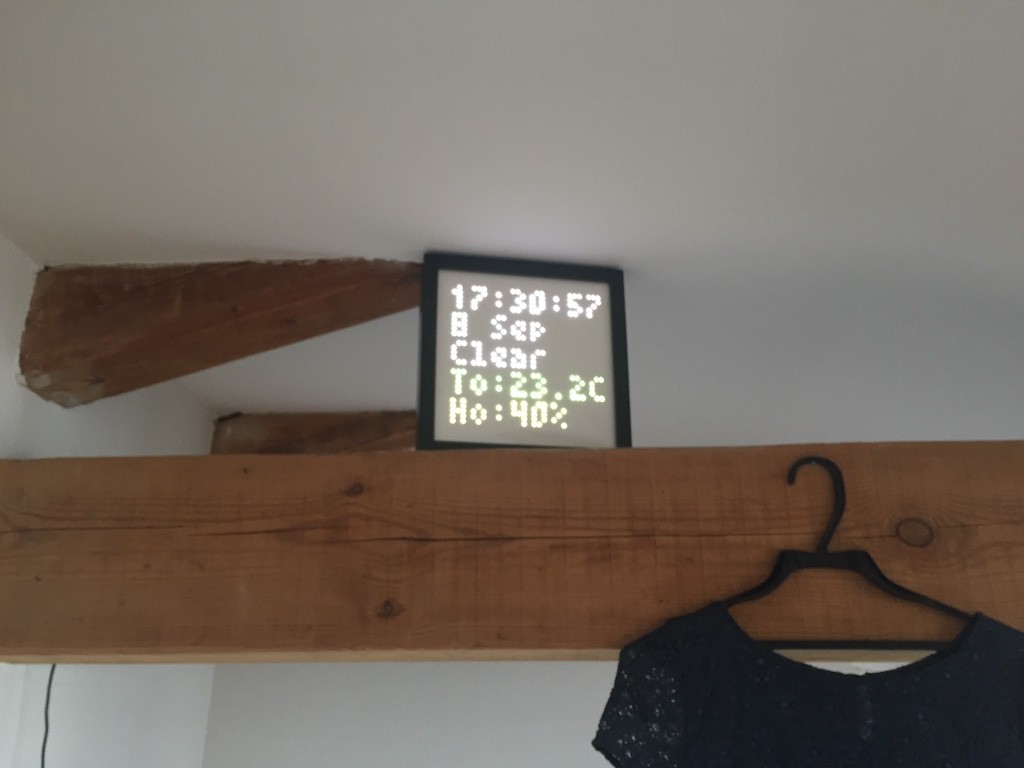
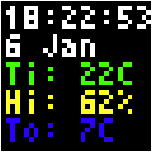
Digital clock
The digital clock only took the topmost line, so I added some more information on the next 4 lines: date, inside temperature, inside humidity and outside temperature which I got from openweathermap and update every 10 minutes.
The temperature colour is blue under 10C, cyan between 10-20C, green between 20-25C, yellow between 25-30C and red above 30C. The humidity is green between 40-60%, yellow between 20-40% and 60-80% and red otherwise.
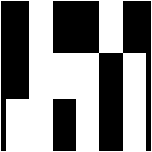
Binary clock
This one was for the sake of the exercise, completely useless for its function as it's not easily human-readable. The numbers are defined by 6 bits, so maximum value of 2^6-1=63. The most significant bit was on the left side, first line is hours, then minutes and then seconds.
This example shows a time of 16+2:16+8+4+1:32+16+4+1: 18:29:53.
Reading the time and getting your head around the powers of two usually meant that by the time you understood the time it had already changed.
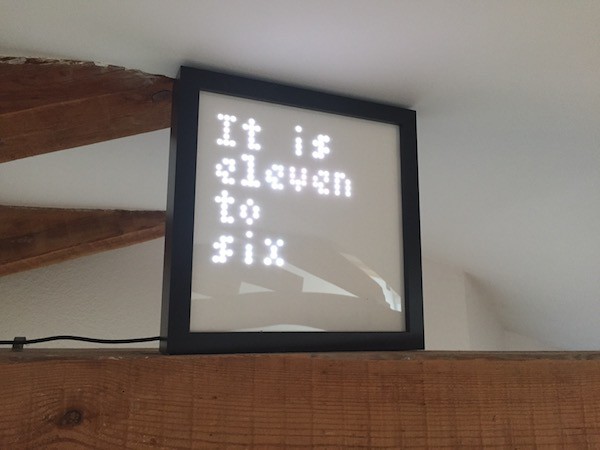
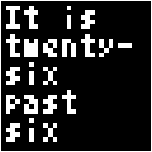
English word clock
Since there was enough space I wanted a clock that spells out the time in plain English. This is called a "word clock", there are many similar projects on Hackaday.io. Very human-friendly.
日本の時間
I'm very fond of Japanese, I wanted to make a "Japanese word clock" display where the time would be spelled in Japanese characters. Amazingly there was a full Japanese alphabet (Hiragana, Katakana and Kanji) that fit a 7x7 area per symbol called Misaki font (Geocities is still alive?). It has even been ported to Arduino so it was just a matter of reformatting it for JavaScript.
I tried to use only Katakana to tell the time, but there wasn't enough space as there was a hard limit of 4 characters per line and 4 lines with this font (16 symbols total). Also using only Katakana characters didn't look very nice.
Using Kanji fixed that and I must say I like it a lot:
今は午後六時二十六分です means "it is now 6:26 in the afternoon", although I doubt my dad can read it.
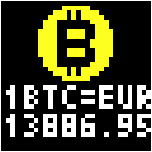
Bitcoin ticker
This animation was just a "why not" idea: a Bitcoin ticker that updates itself every minute. The data is taken from Blockchain ticker.
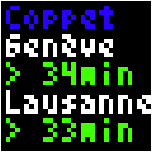
Train timetable
I used an open API to fetch the time for the next trains in departure from the local train station:
If the next train is more than 20 minutes away the text is green, between 20 and 15 minutes it becomes yellow and less than 15 minutes it becomes red to indicate that catching it won't be easy as it takes about 20 minutes to walk to the station. Under 10 minutes it will show the next departure.
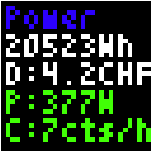
It shows the daily power usage in Wh, total day cost, live usage in W and live cost per hour. It gives a good overview and make one more aware of it. The instant power usage numbers become yellow and red depending on thresholds.