Wifi power mapping
Using an ESP8266 to look at wifi signals in great detail.
Using an ESP8266 to look at wifi signals in great detail.
To make the experience fit your profile, pick a username and tell us what interests you.
We found and based on your interests.
Get the github repositories listed below.
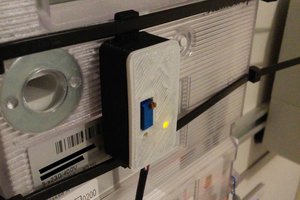
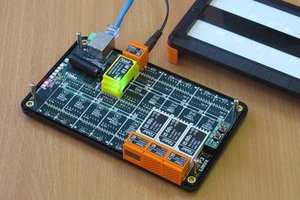
Program the ESP8266 with a copy of WS2812ESP8266, and attach a WS2812 LED to it, with the input pin on the WS2812 hooked to GPIO0 on the ESP8266.
Connect a computer running Linux to the ESP8266.
Create an account to leave a comment. Already have an account? Log In.
Cool, an array of these on a stick at a small interval would reduce time and reduce the number of passes needed, a matrix would reduce it to a one dimensional pass....
Who's up for building a "LED Cube" with these WiFi sensors, for real time 3D monitoring? :D
such a cool protect, I just installed an app on my phone that displays Wi-Fi RSSI. Didn't attempt a map, but I definitely saw fluctuations as much as 10 db moving just a couple inches. Have you tested different ways of measuring to corroborate your measurements? Also, wonder if the map is reproducible if you scan twice in a row.
I don't know enough about Wi-Fi, but I assume signal strength only affects data rate when below a certain threshold. That's why you don't notice these big power fluctuations in normal use.
to map a wifi without aliasing you need minimum 2 times its frequency according to sampling theorem I didn't understand sir can you help me
no, he is just mapping the /amplitude/ of the wifi signal, not the signal itself. think of an AM radio transmission transmitting an 1 kHz tone on a carrier of 1 MHz. We are interested in the 1 kHz audio signal - and for sampling this we are happy with a sampling frequence of 2 kHz.
Depending how fast the amplitude will change (according to the speed of the mill) a very low sampling frequ. wil be sufficient.
love it. Would have huge benefits in office layout I could imagine. Very useful!
I will certainly try the opposite of your method (swap ESP3288 with smartphone being moved) to produce a similar 3D mapping.
Did you try different channels (frequencies)? It looks sort of like you are mapping complex standing waves, and the peaks and valleys might shift depending on frequency.
Perhaps adding LEDs for additional frequencies to enable simultaneous mapping if that is not too CPU intensive? Or map using light intensity instead and using different colors for different frequencies?
It looks interesting! But I did'n understand, what does the color show (the average value of rssi/rcpi for all channels in current position or what)?
Interesting project. One idea would be to build a similar device and instead of led just record the signal strength onto a chip, attach it to a drone w/ programable gps for external use and or relative mapping of the interior space being measured, extract the data andplot the results in a 3d software with surrounding buildings or a wireframe of the building for interior visualization.
Great project. Do you think the emf from the servo motors might have caused an interference in the the wifi signal.
I very much doubt that, as I would imagine I would have seen more noise and variance.
great project
i believe a great use to it might be mapping metal bars or pipes inside walls. that might need a little software twist for mapping, but it would work, i guess ?
That may be difficult, I didn't see that when I did one of my pictures of a wall, either :-/
Very cool project!
Have you tried to do the same outside in an open space? I wonder if all those changes are due to our house walls...
OH MAN That is a neat idea! I didn't even think about that.
Become a member to follow this project and never miss any updates


 Lobeware
 Dmitry Slepov
 Matilde Grandi
Reminds me a scanning em picture of the brain