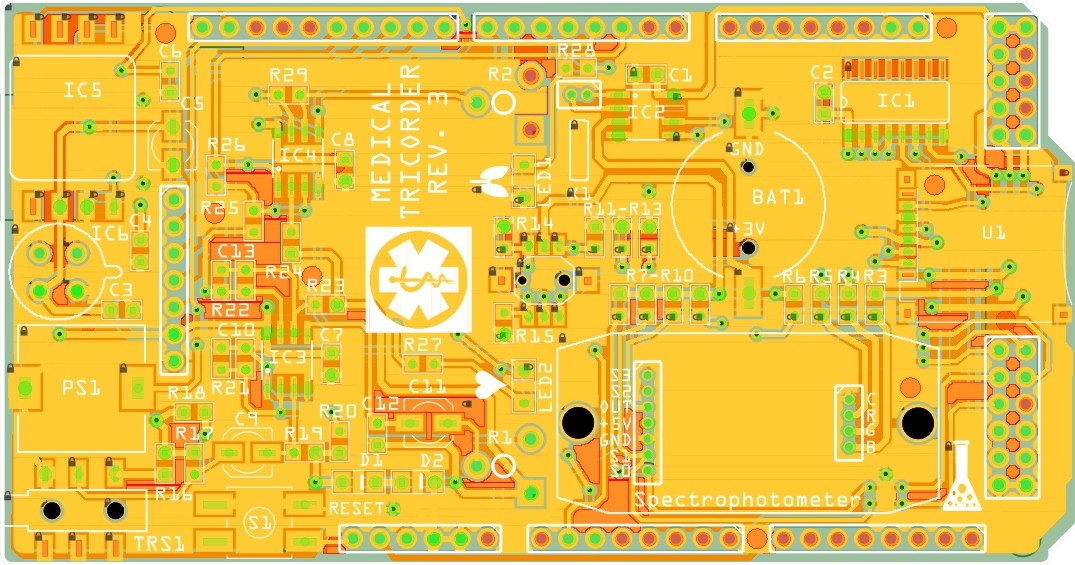
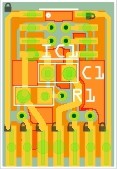
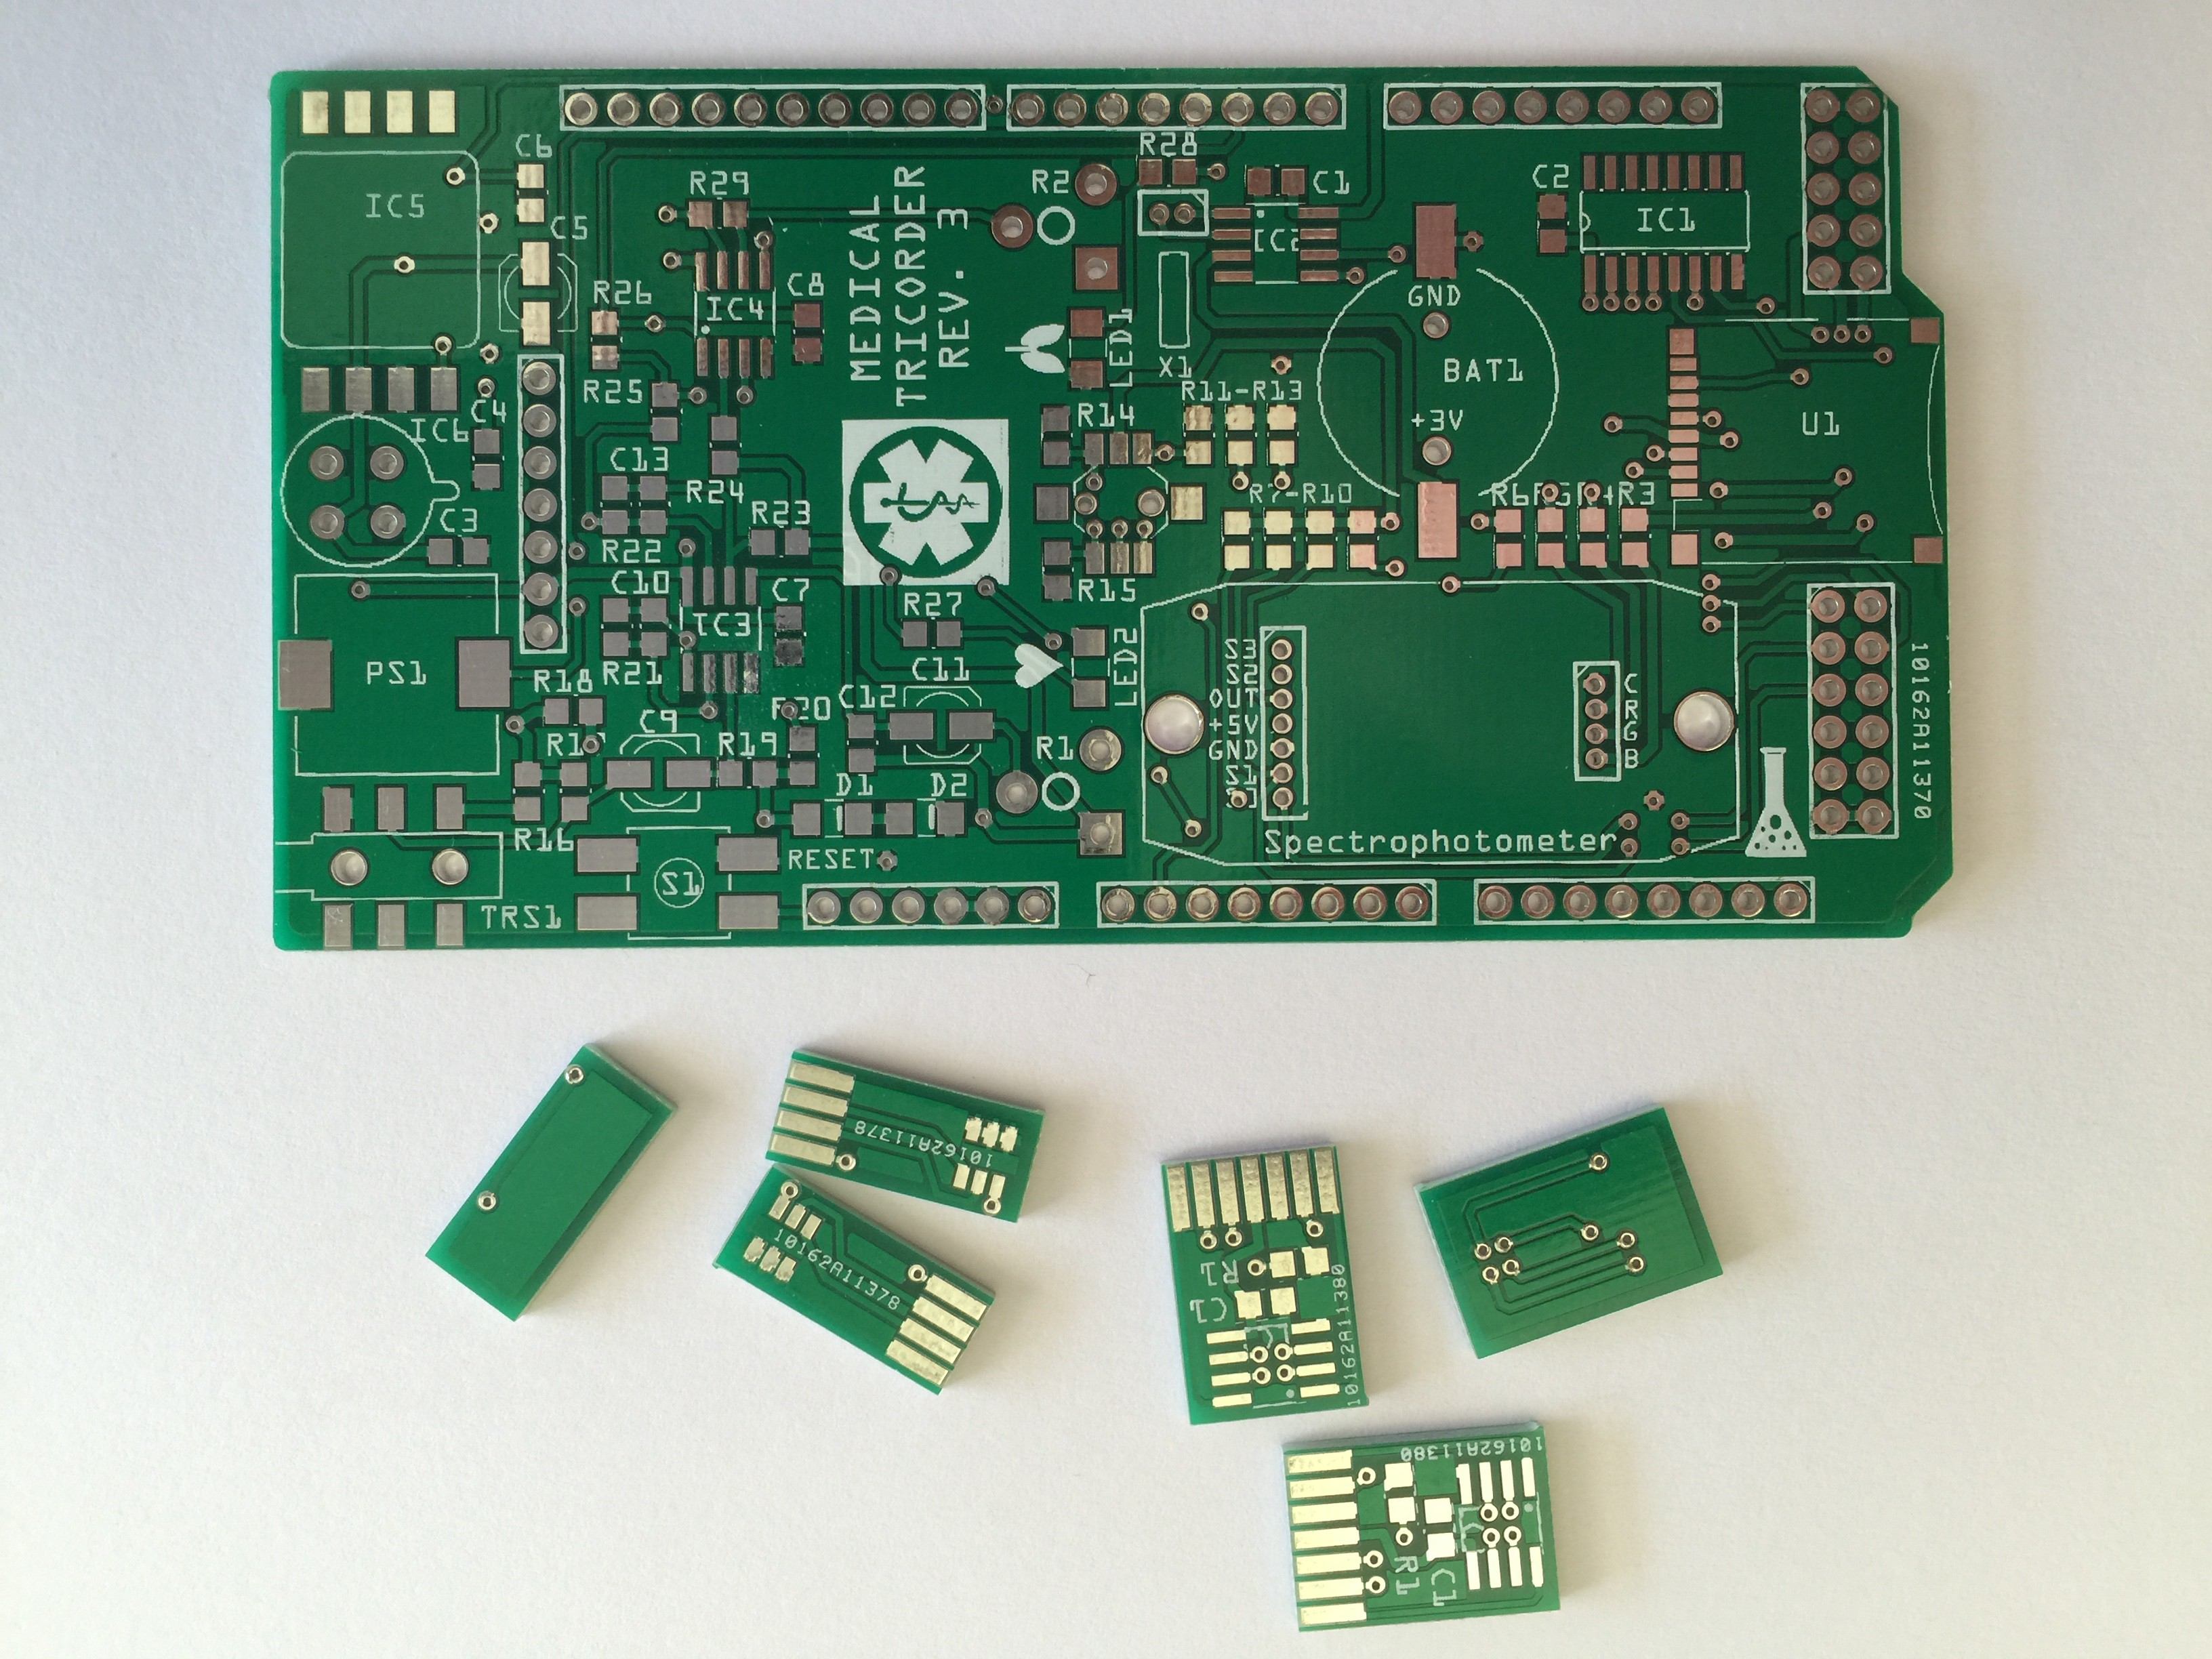
I have started working on the third revision of the medical tricorder. So far I have routed the new shield and the two PCB's which will carry the color sensor and RGB LED for the spectrophotometer.

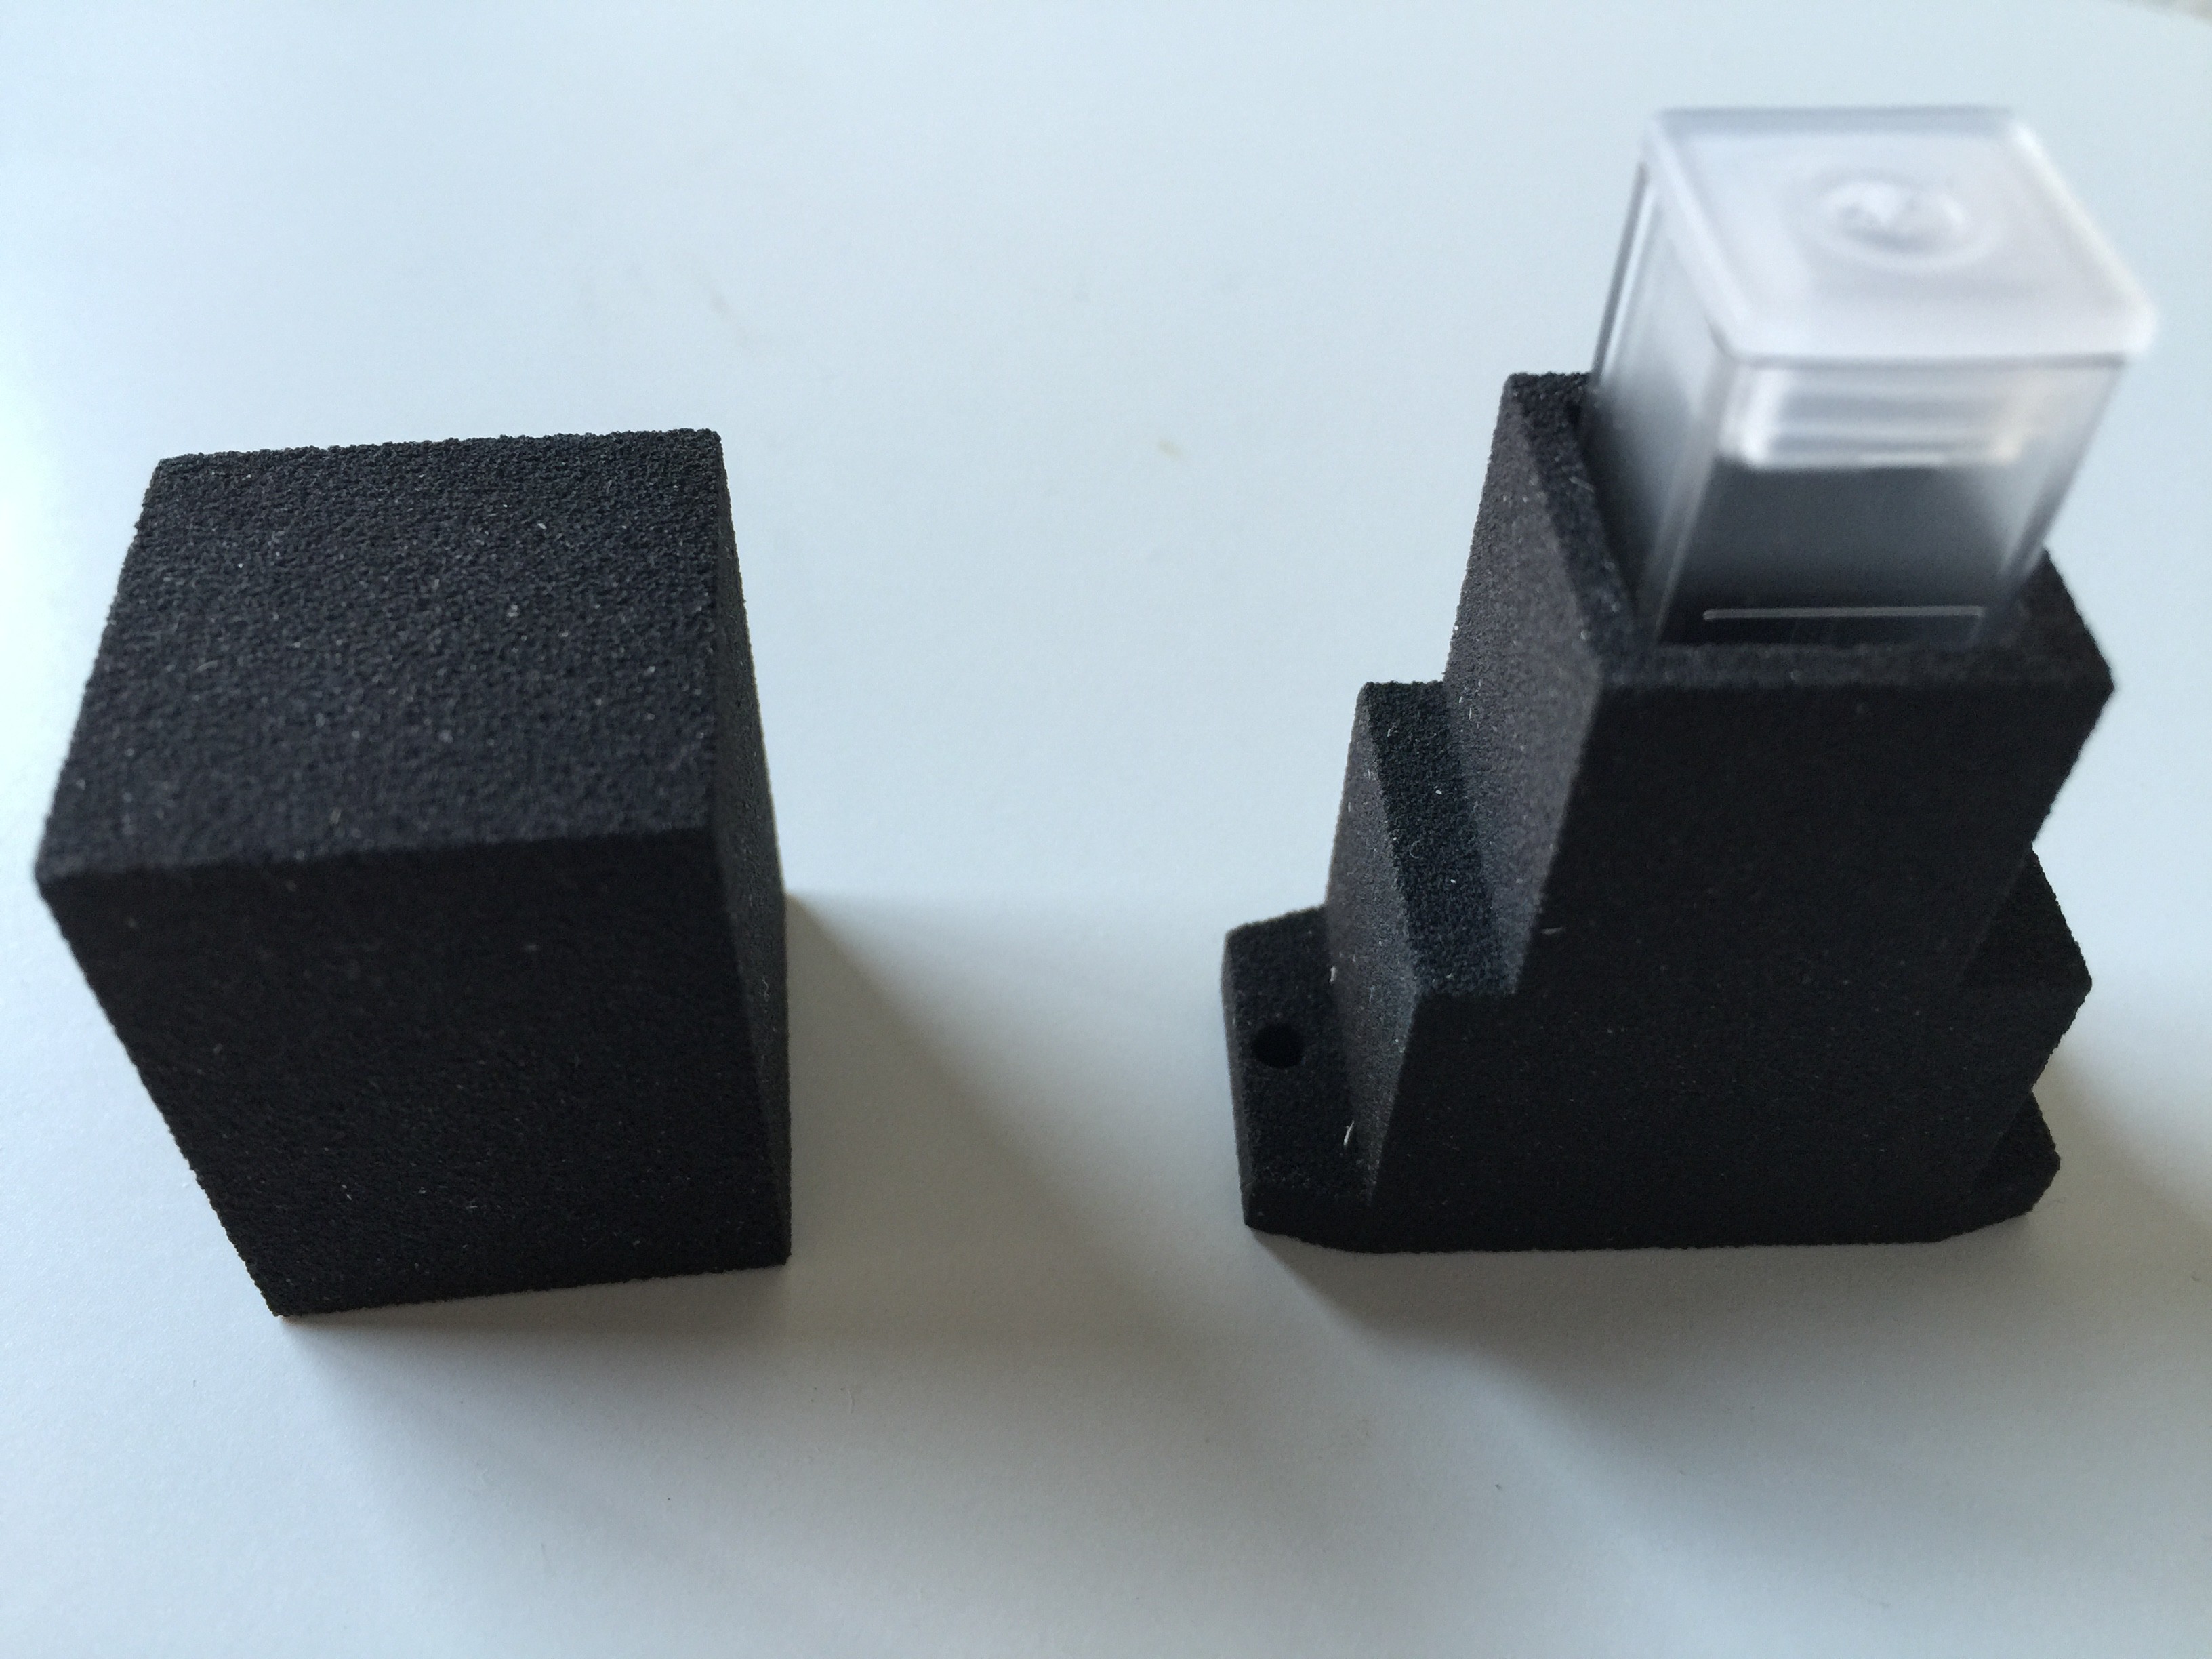
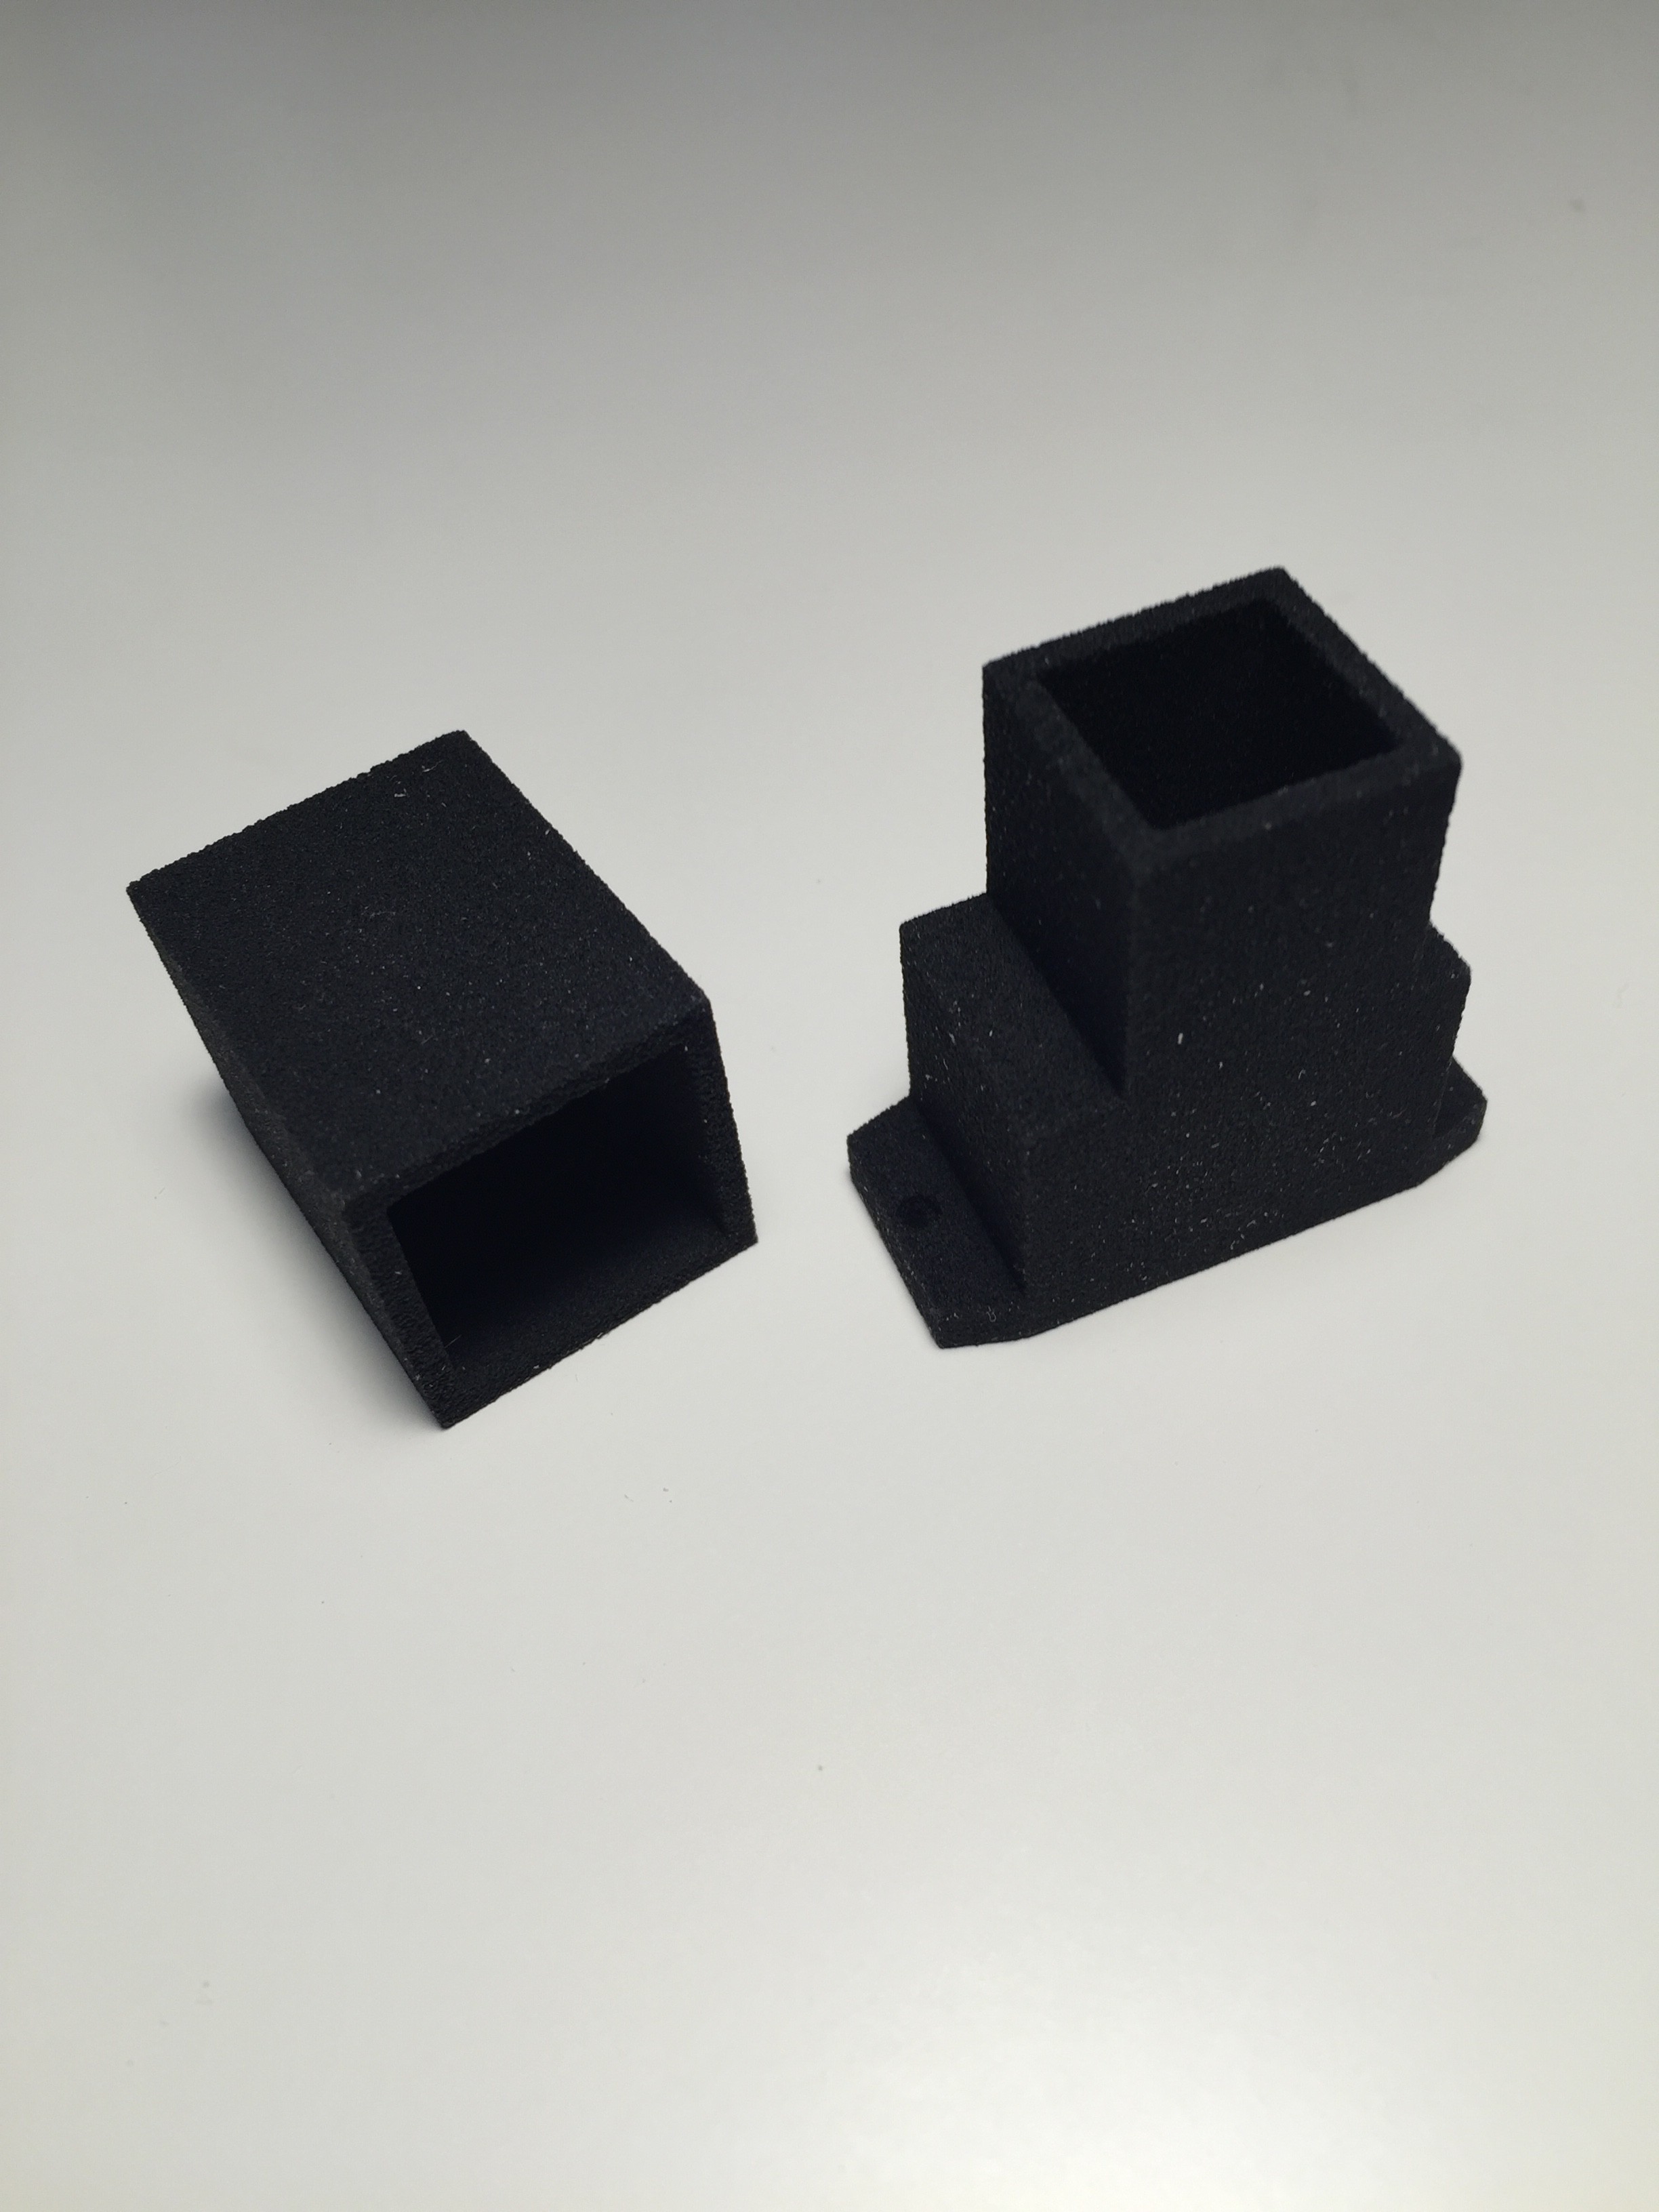
The housing for the spectrophotometer was produced by applying a particle material (PMMA Polymethylmethacrylate) in layers, which is bonded together with a binding agent.
Finally the cuvettes arrived:
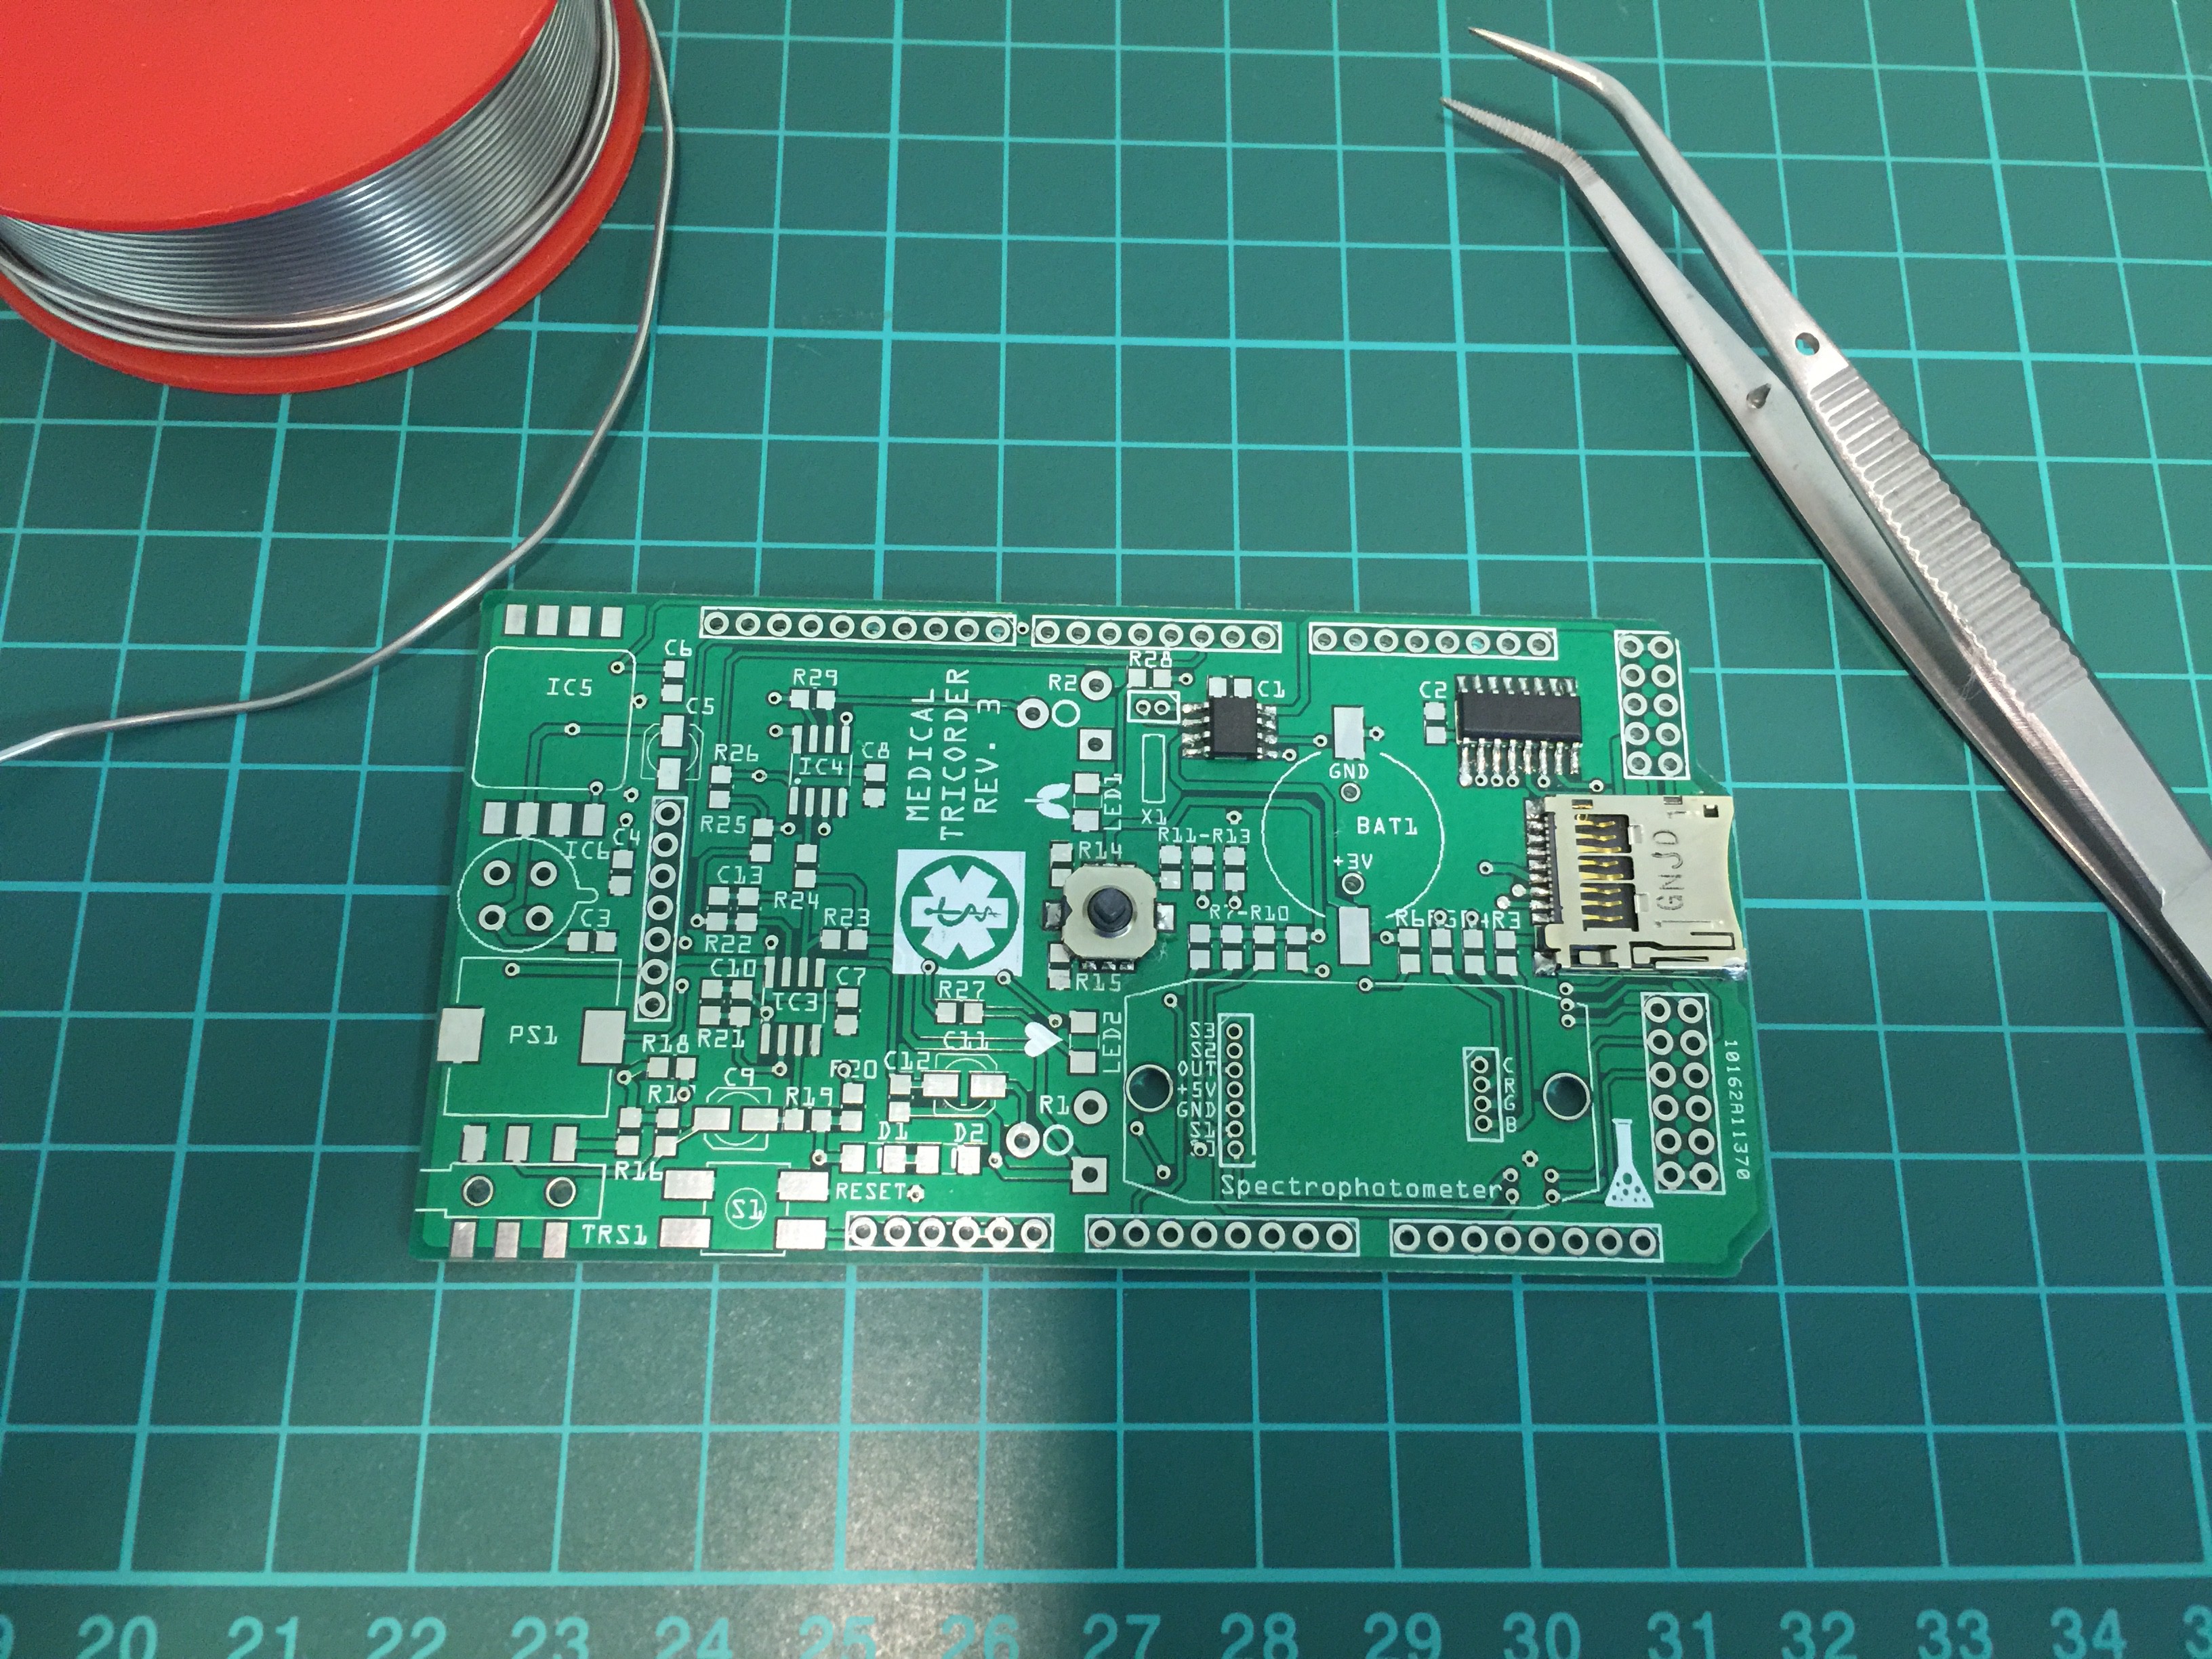
Partly populated:
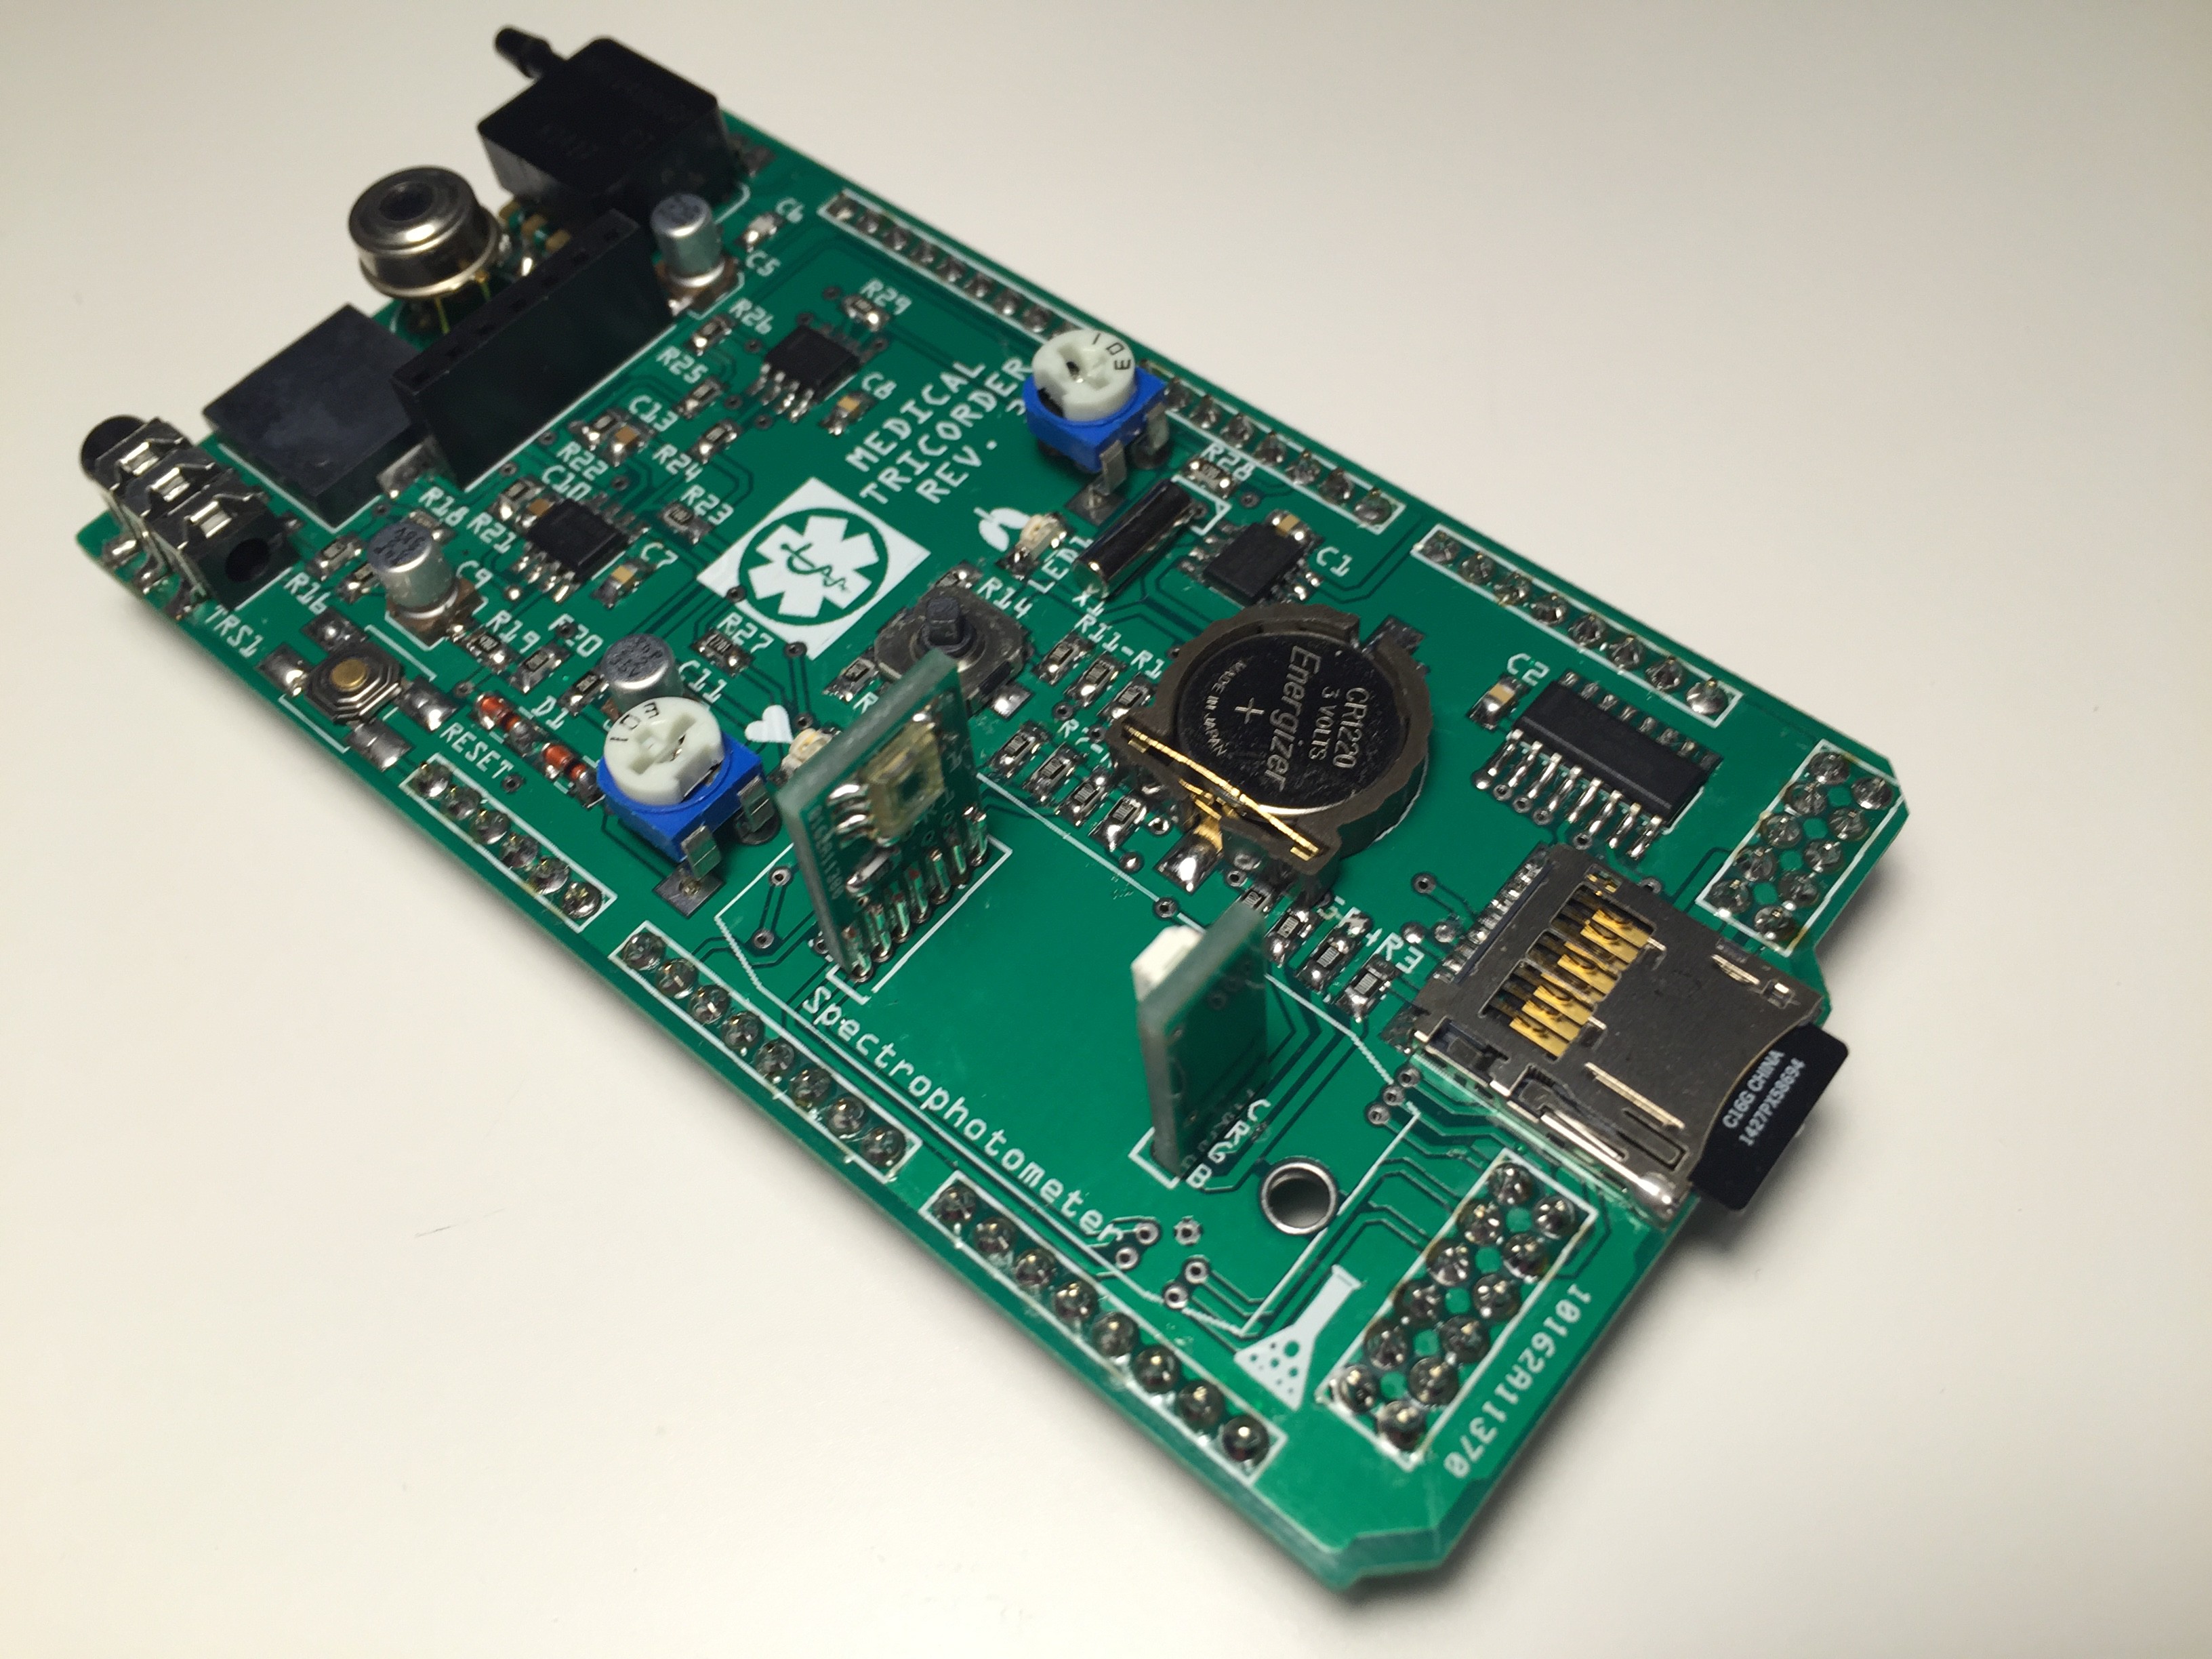
PCB ready for some first tests:
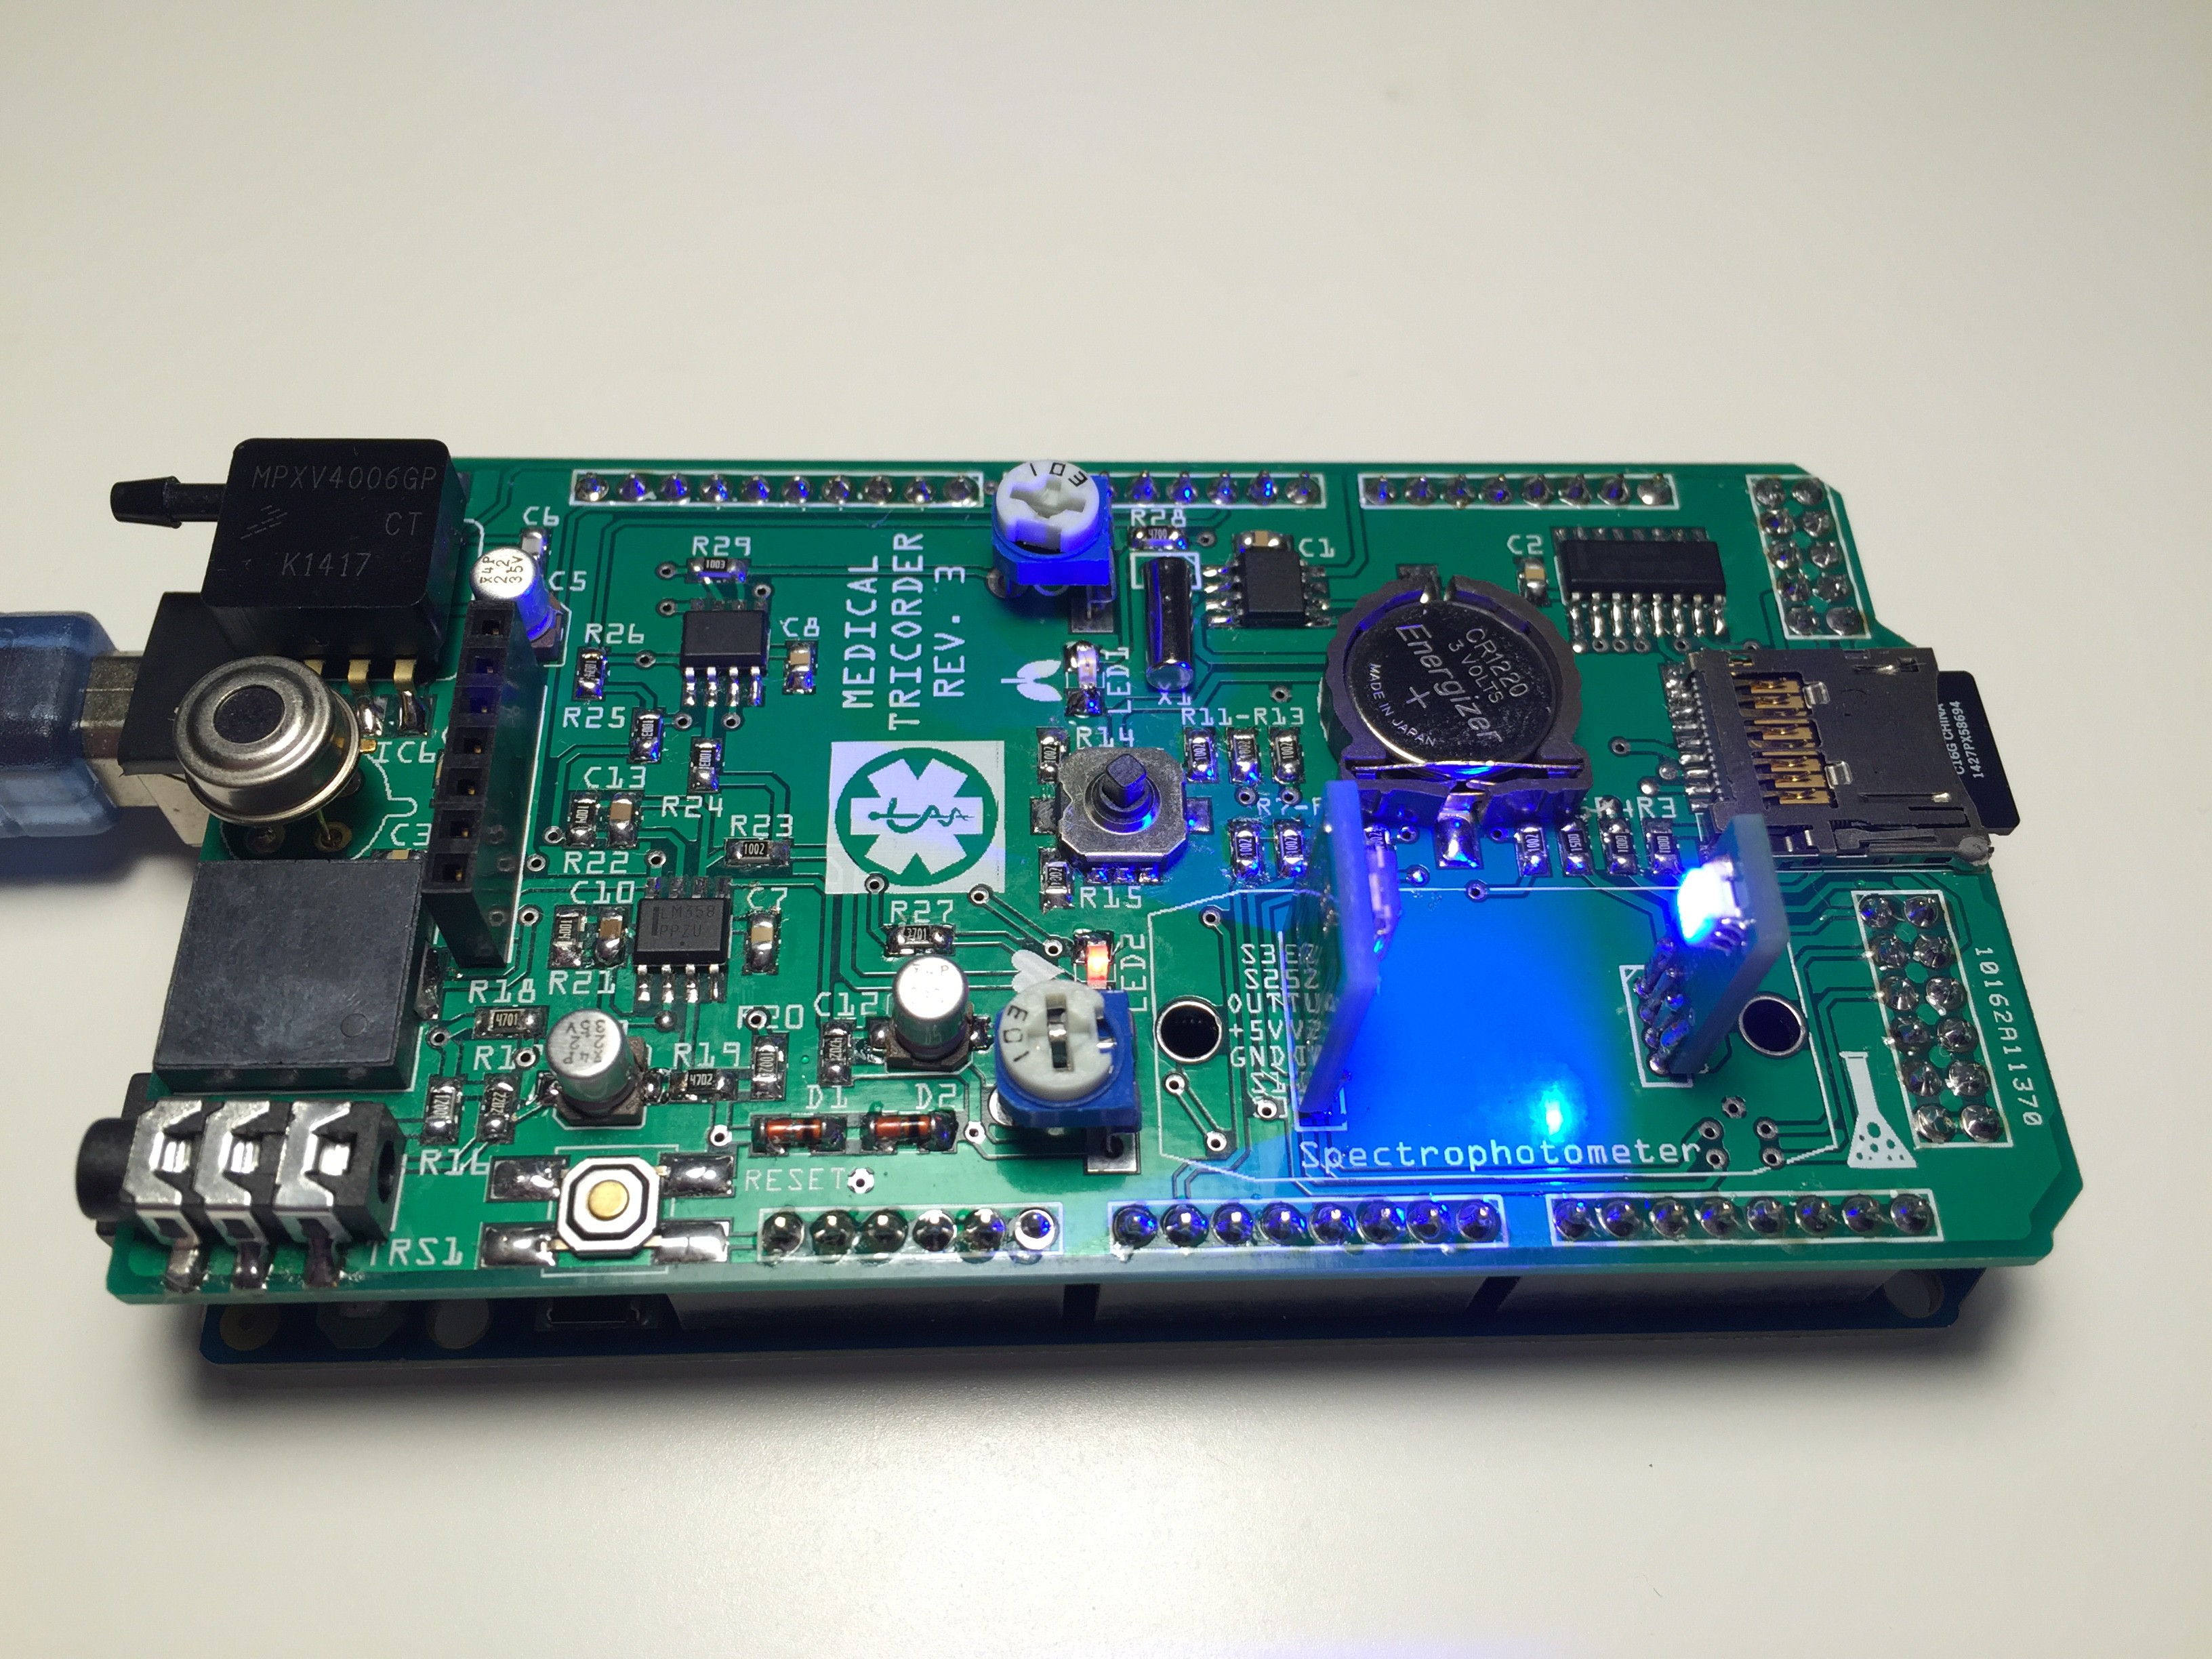
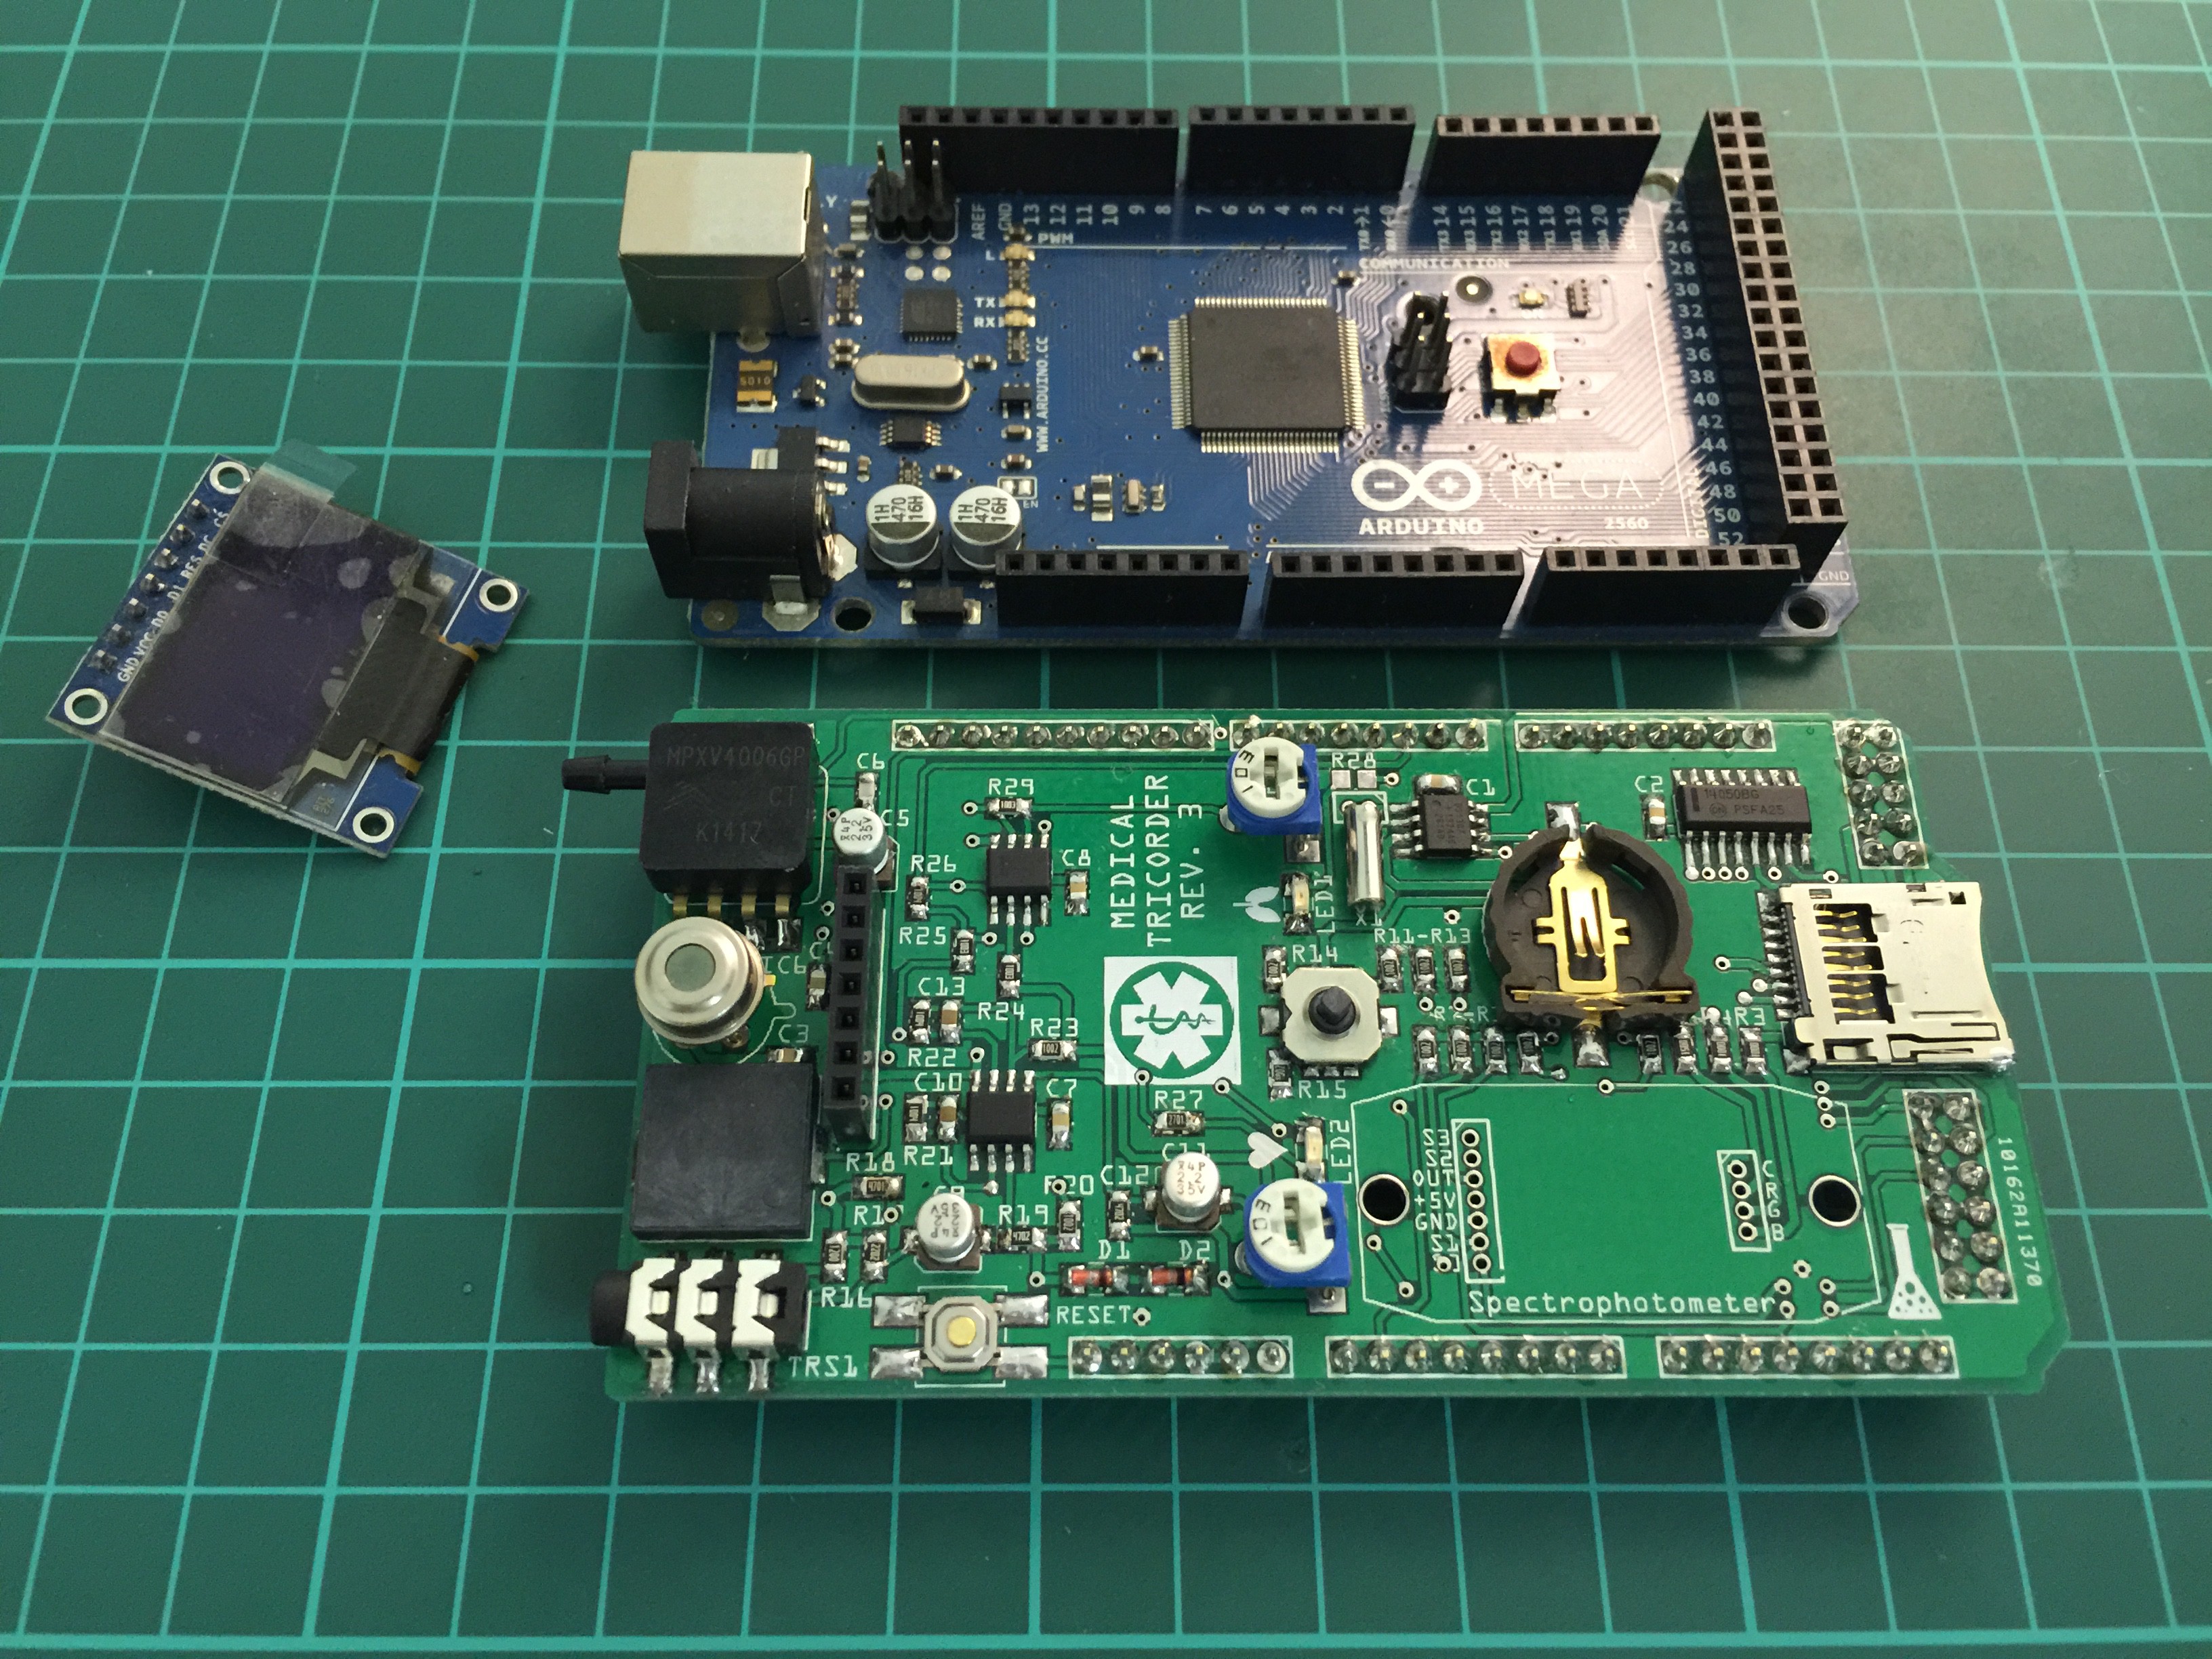
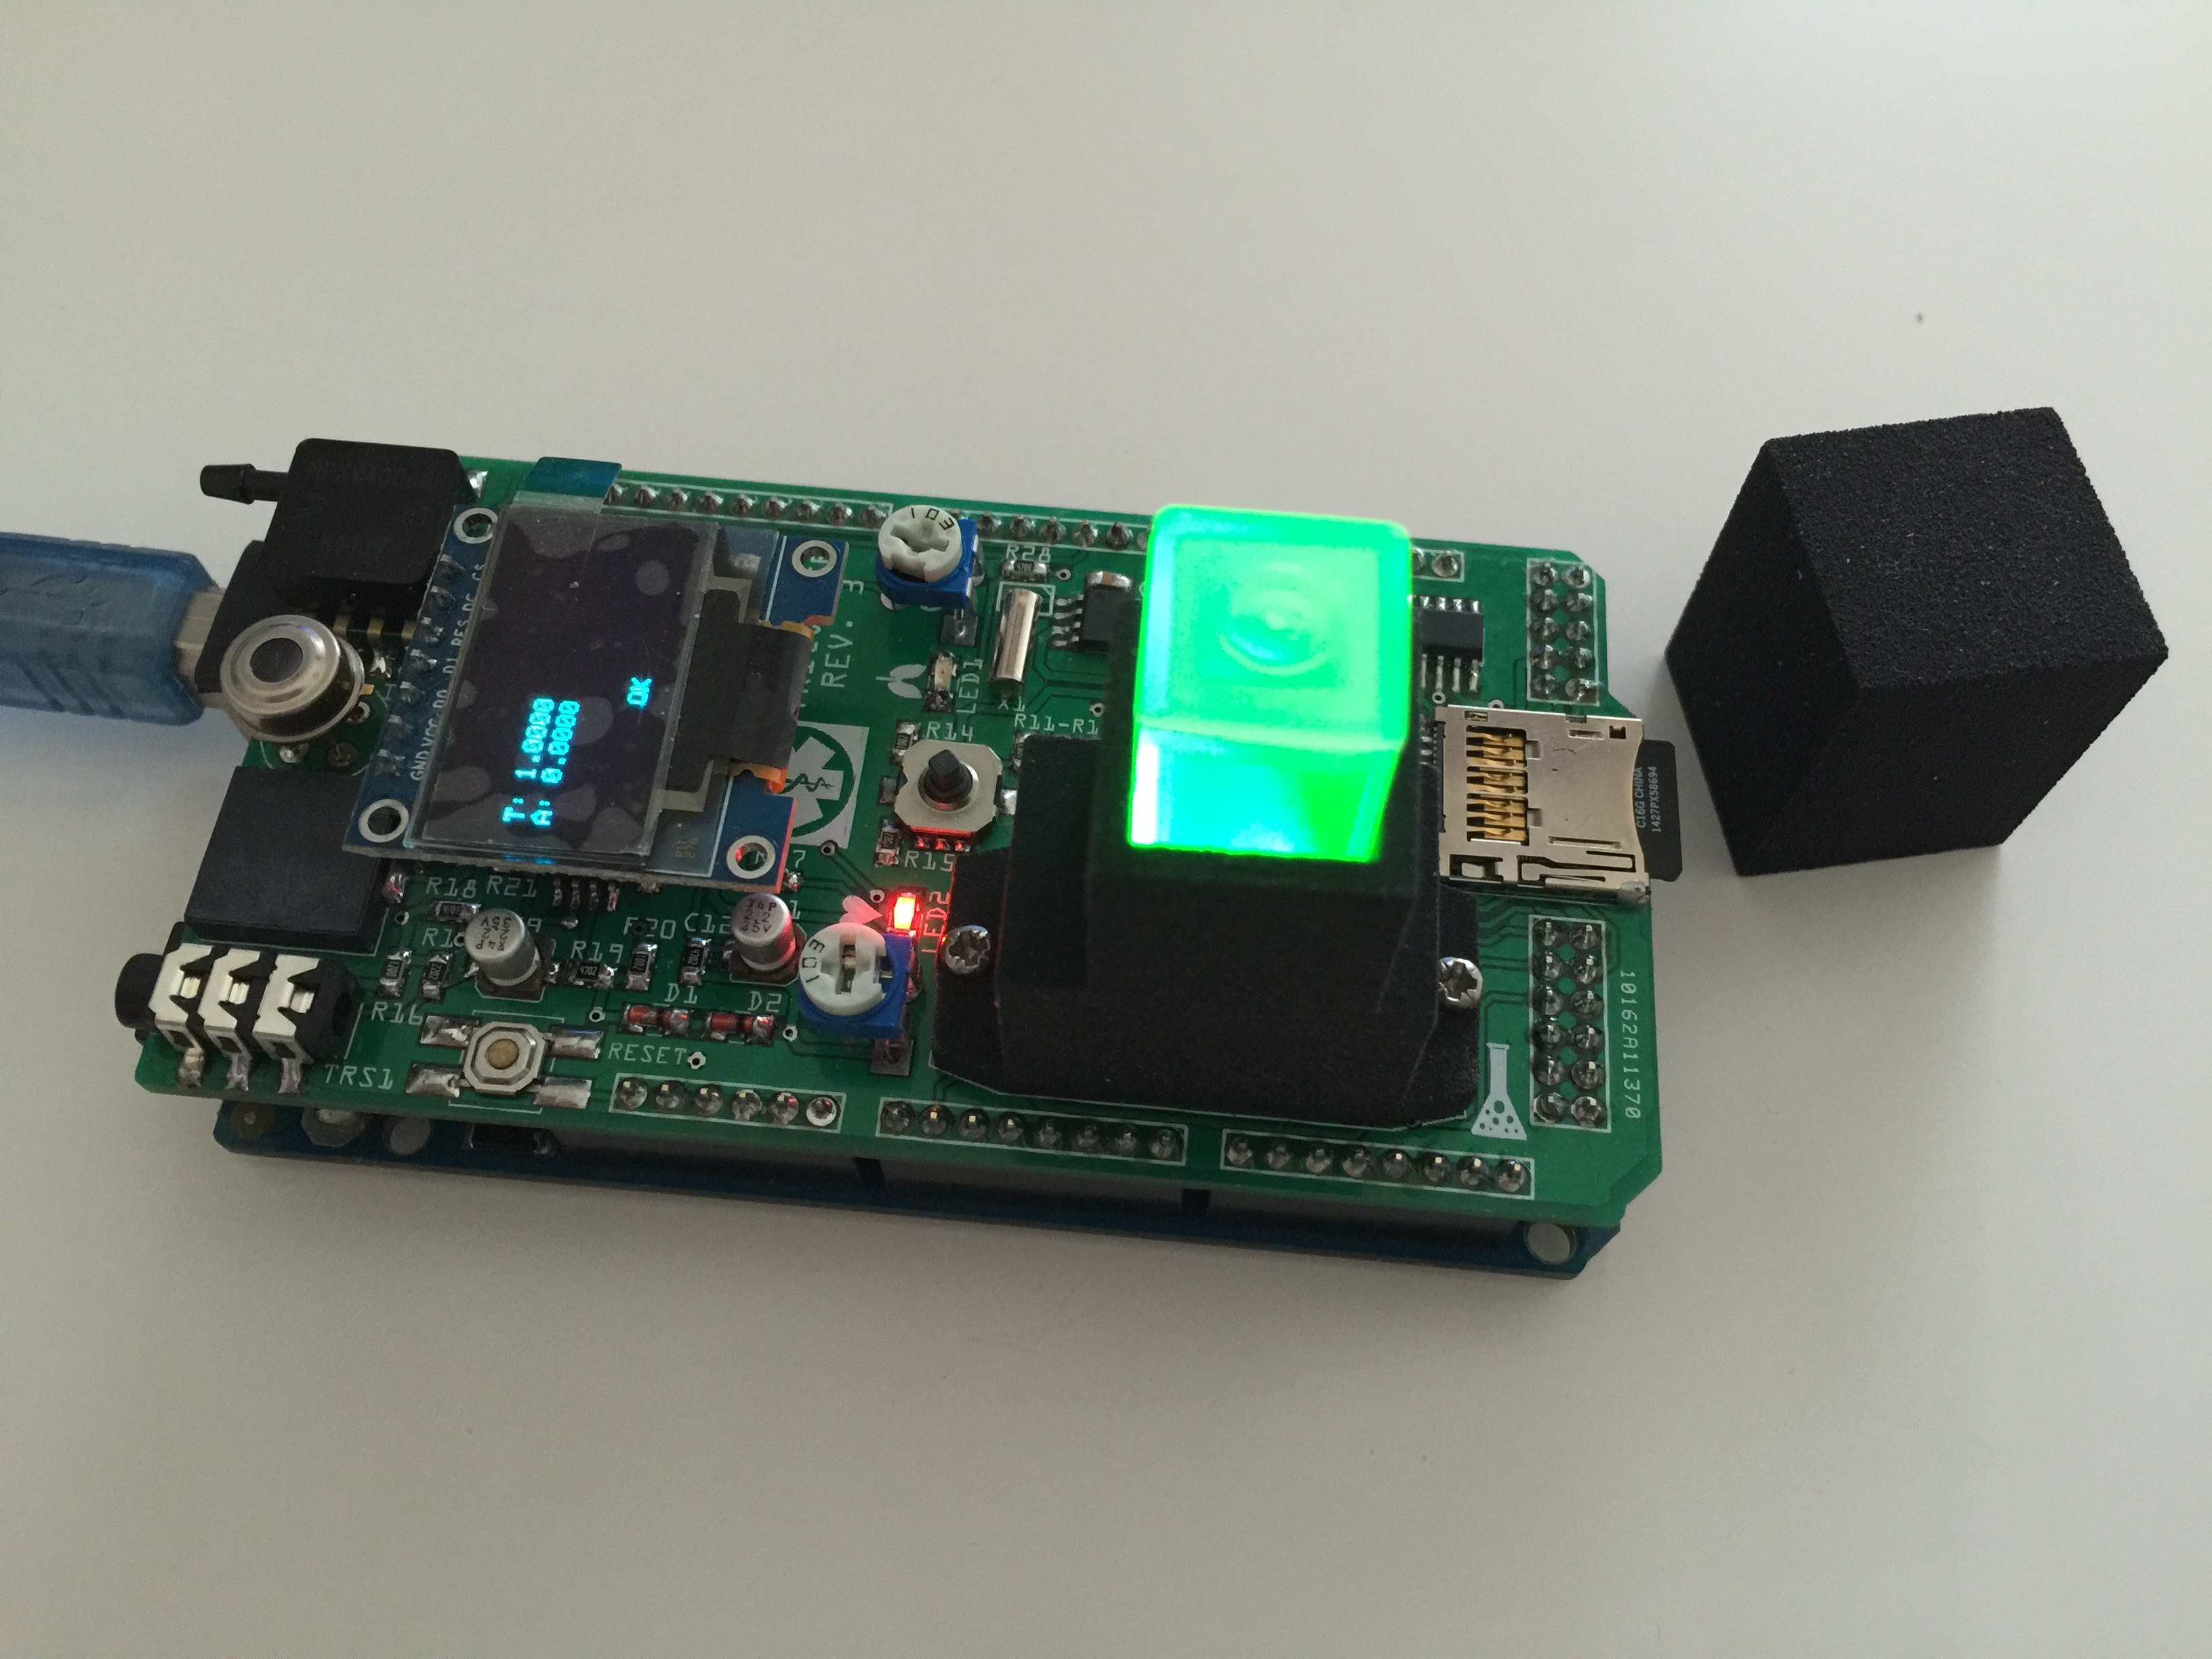
Completely populated shield:
Testing the RGB LED of the spectrophotometer:
In a first test I will use Benedict's solution to determinate glucose level in urine. Benedict's solution is prepared as following:
(1) Benedict A: Dissolve 1.7 g of Copper (II) sulfate pentahydrate in 20 ml of deionized H2O.
(2) Benedict B: Dissolve 17.3 g of Sodium citrate and 10 g of anhydrous Sodium carbonate in 70 ml warm deionized water.
(3) Benedict's Reagent: Pour Benedict's solution A slowly into solution B and make up the volume to 100 ml . Mix well.
Use this procedure to determinate glucose level by spectrophotometer.
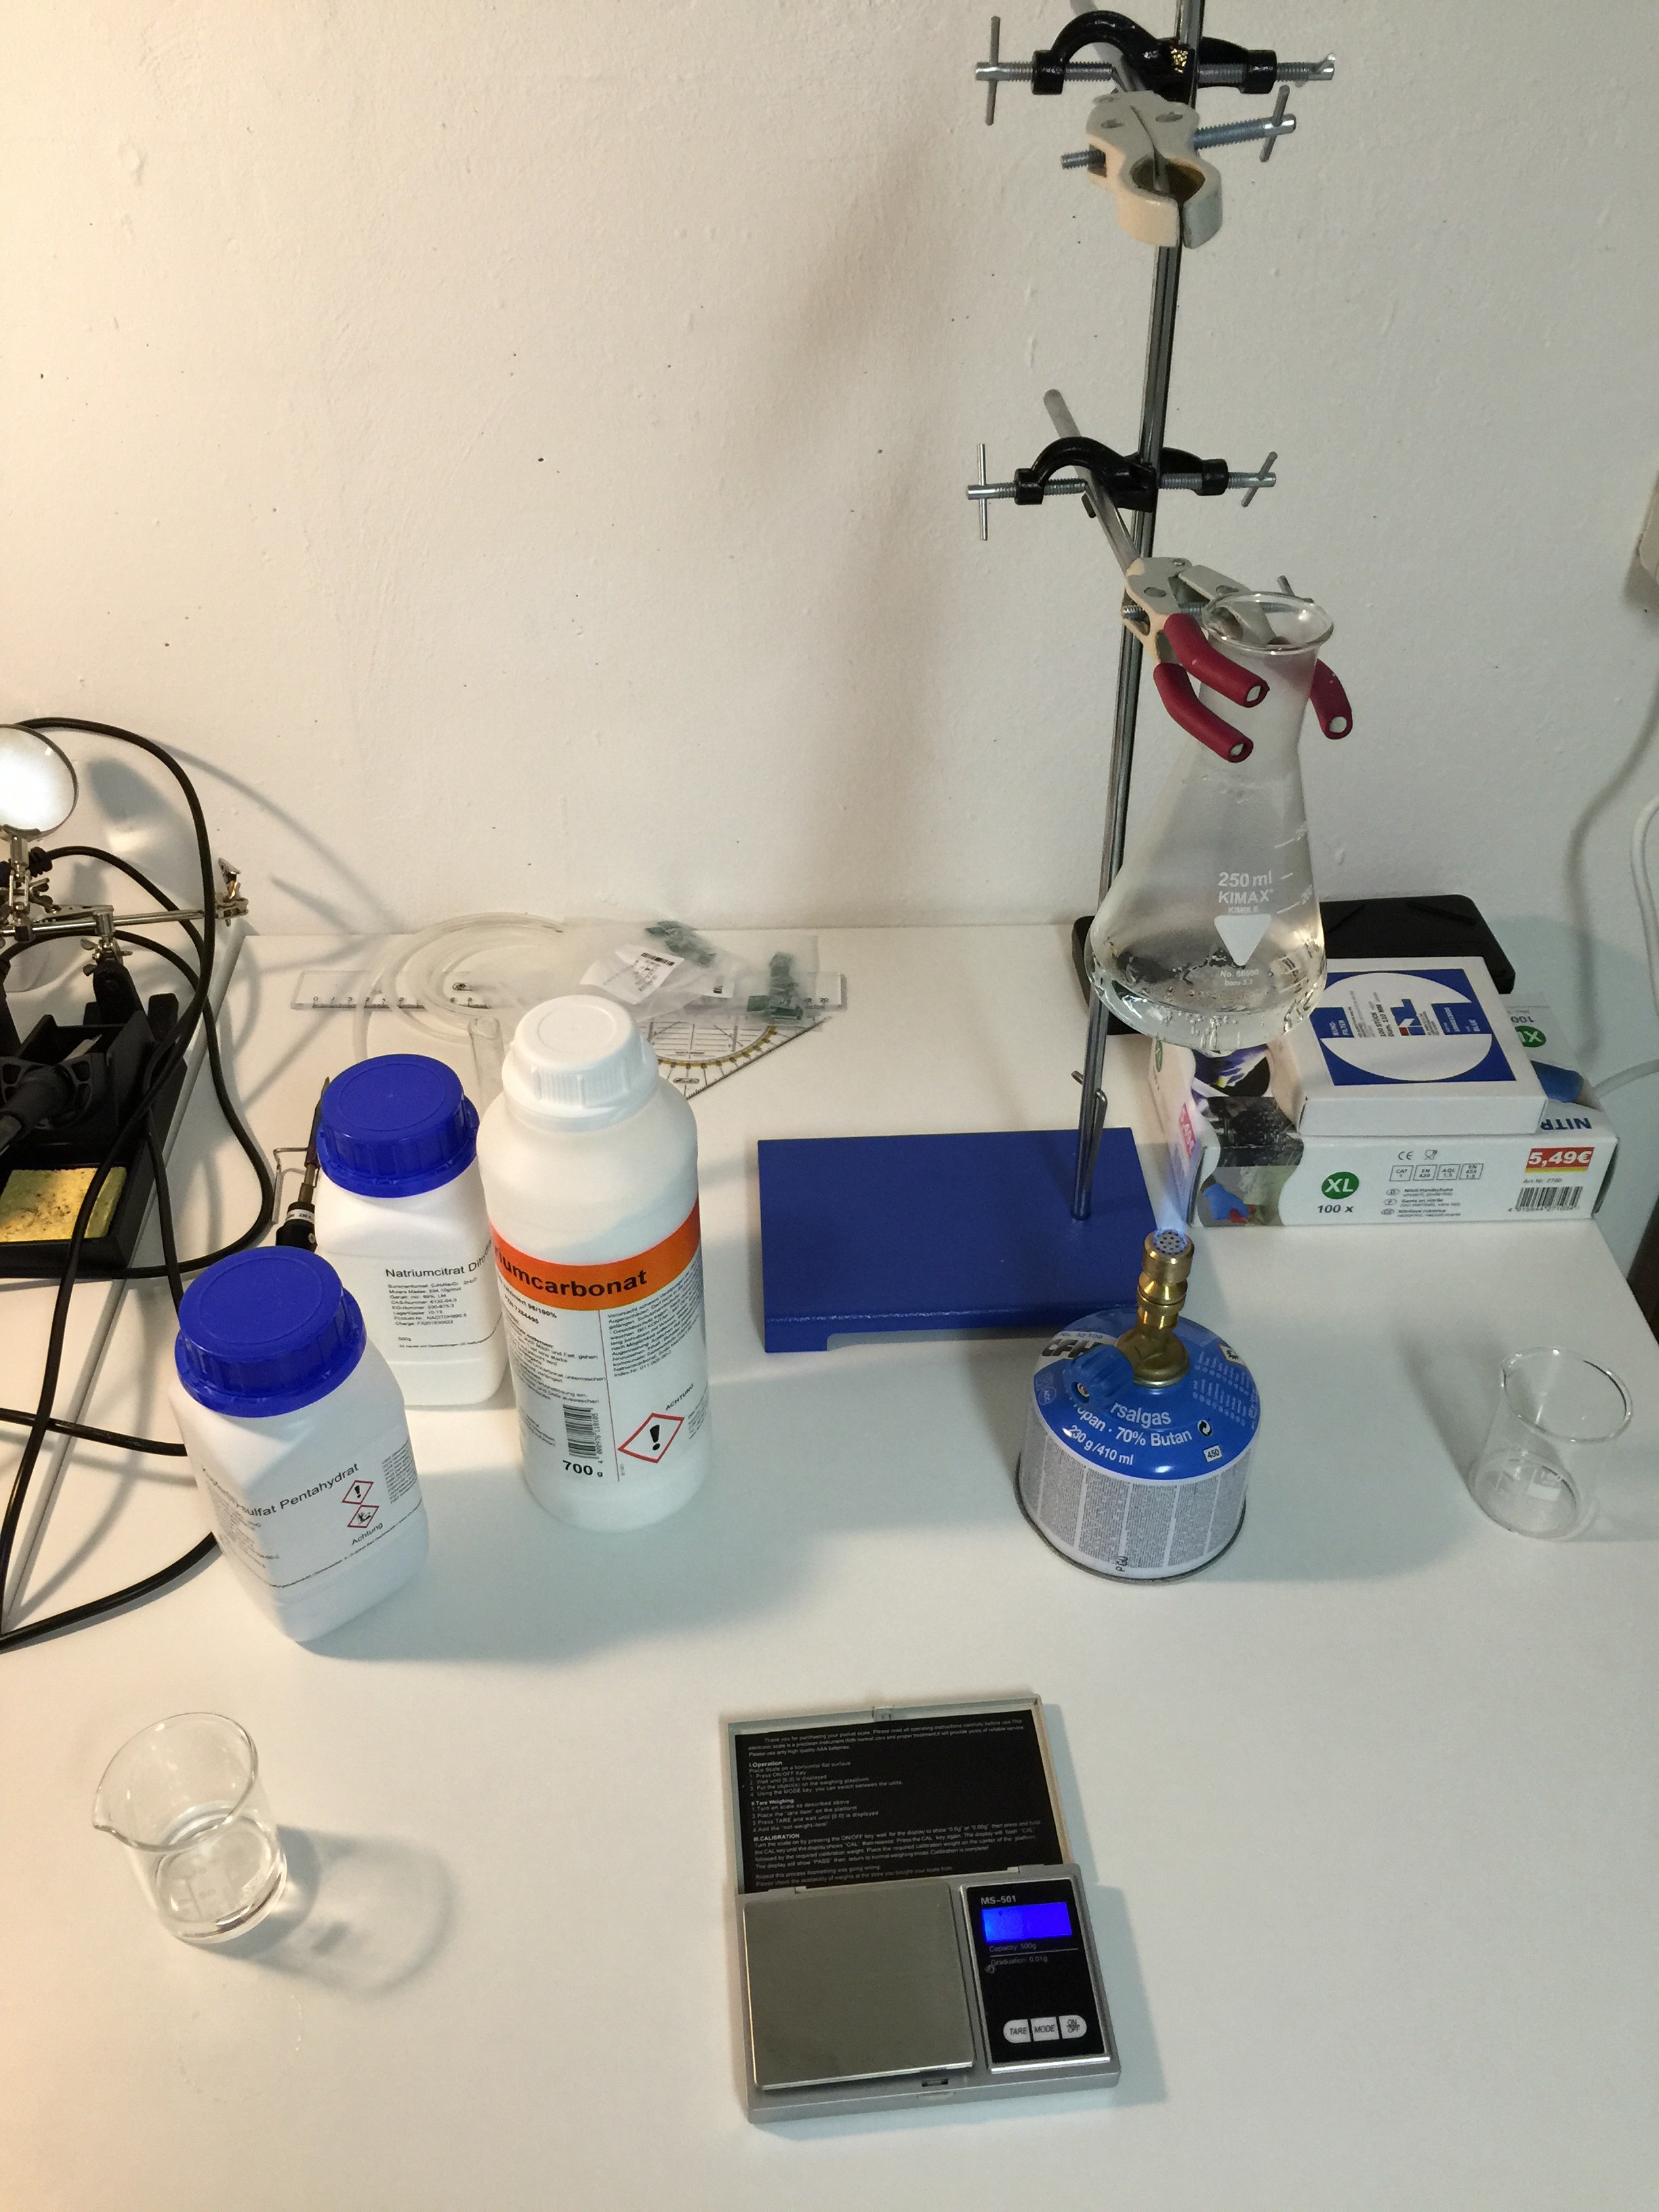
Preparing Benedict's reagent:
Next step is to work out a concentration standard curve and derive a function by curve fitting.
To do this, the main housing of the spectrophotometer needed some small modifications to fit well. I have updated the 3-D drawing and STL file. New sample will arrive in a couple of days from the fab house. Once arrived, I'll be able to finish spectrophotometer code and prepare standard glucose/Benedict's reagent samples to obtain a look-up table. In the mean time I will work on other code snippets like core temperature reading and heart beat.
The new housing of the spectrophotometer will arrive tomorrow, so I started to prepare different solutions (100 mg/dl, 250 mg/dl, 500 mg/dl, 1000 mg/dl, 2000 mg/dl) of D-(+)-Glucose monohydrate ≥ 99.0% for microbiology and deinoized water: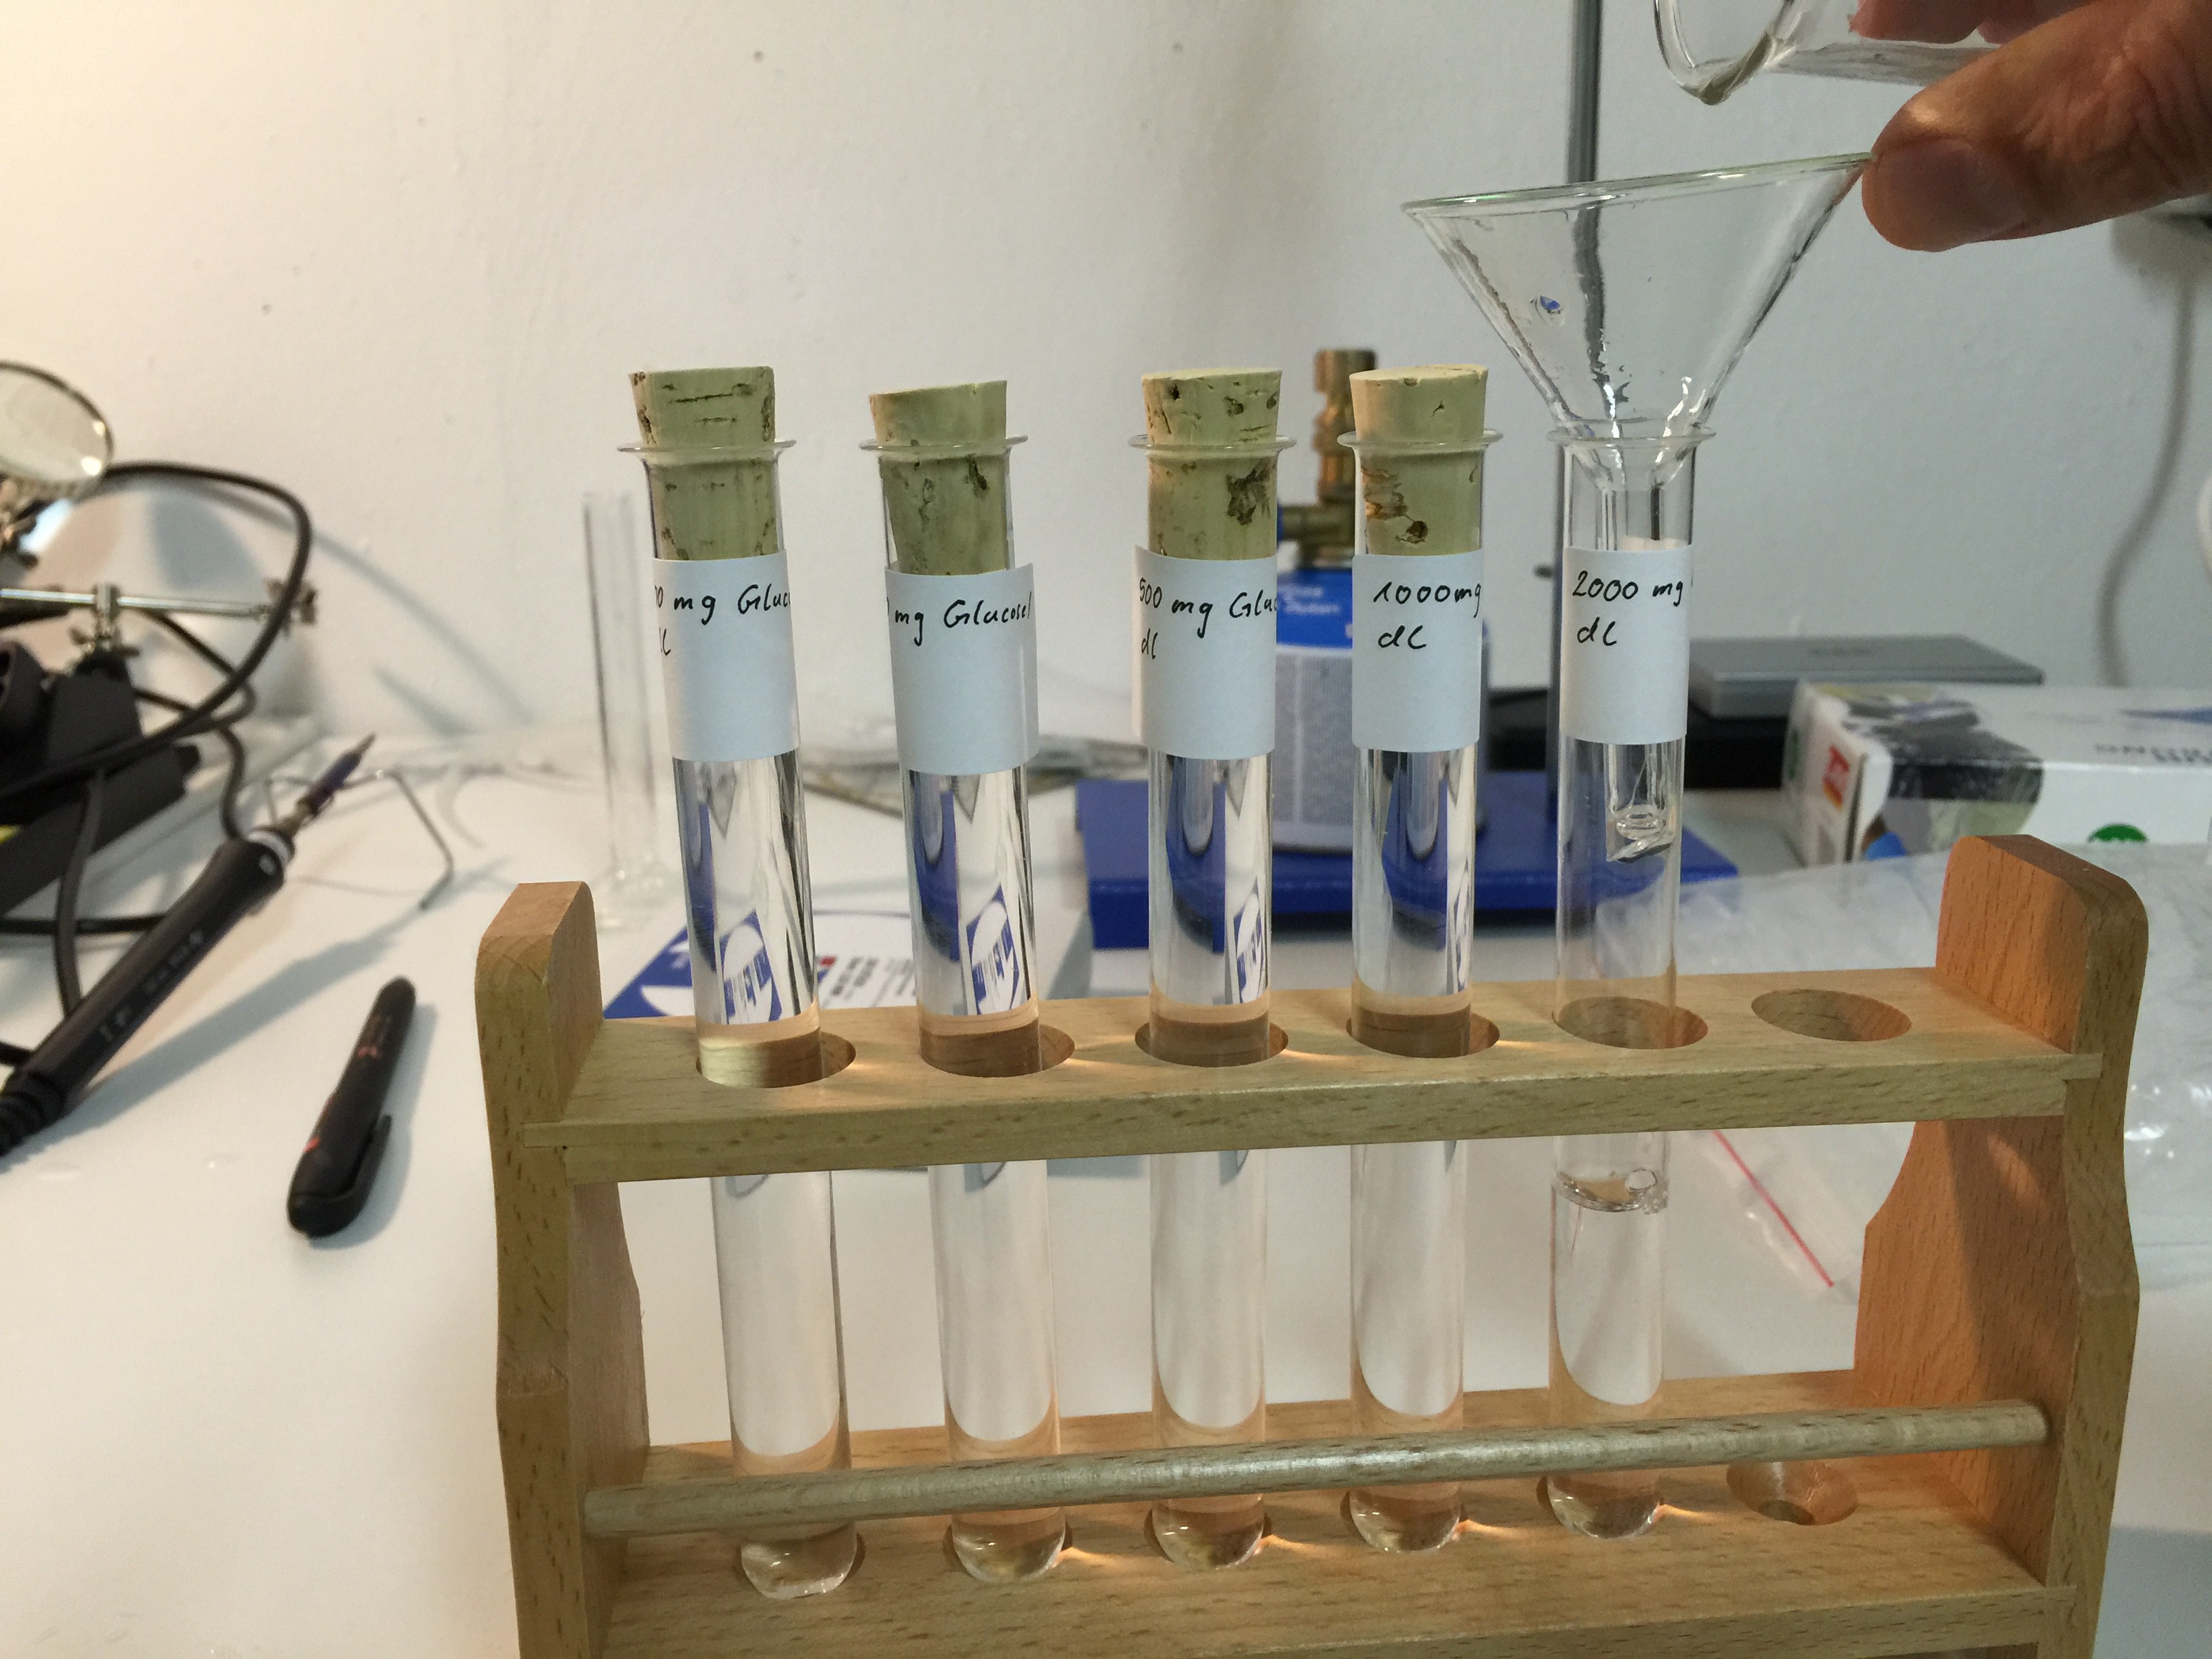
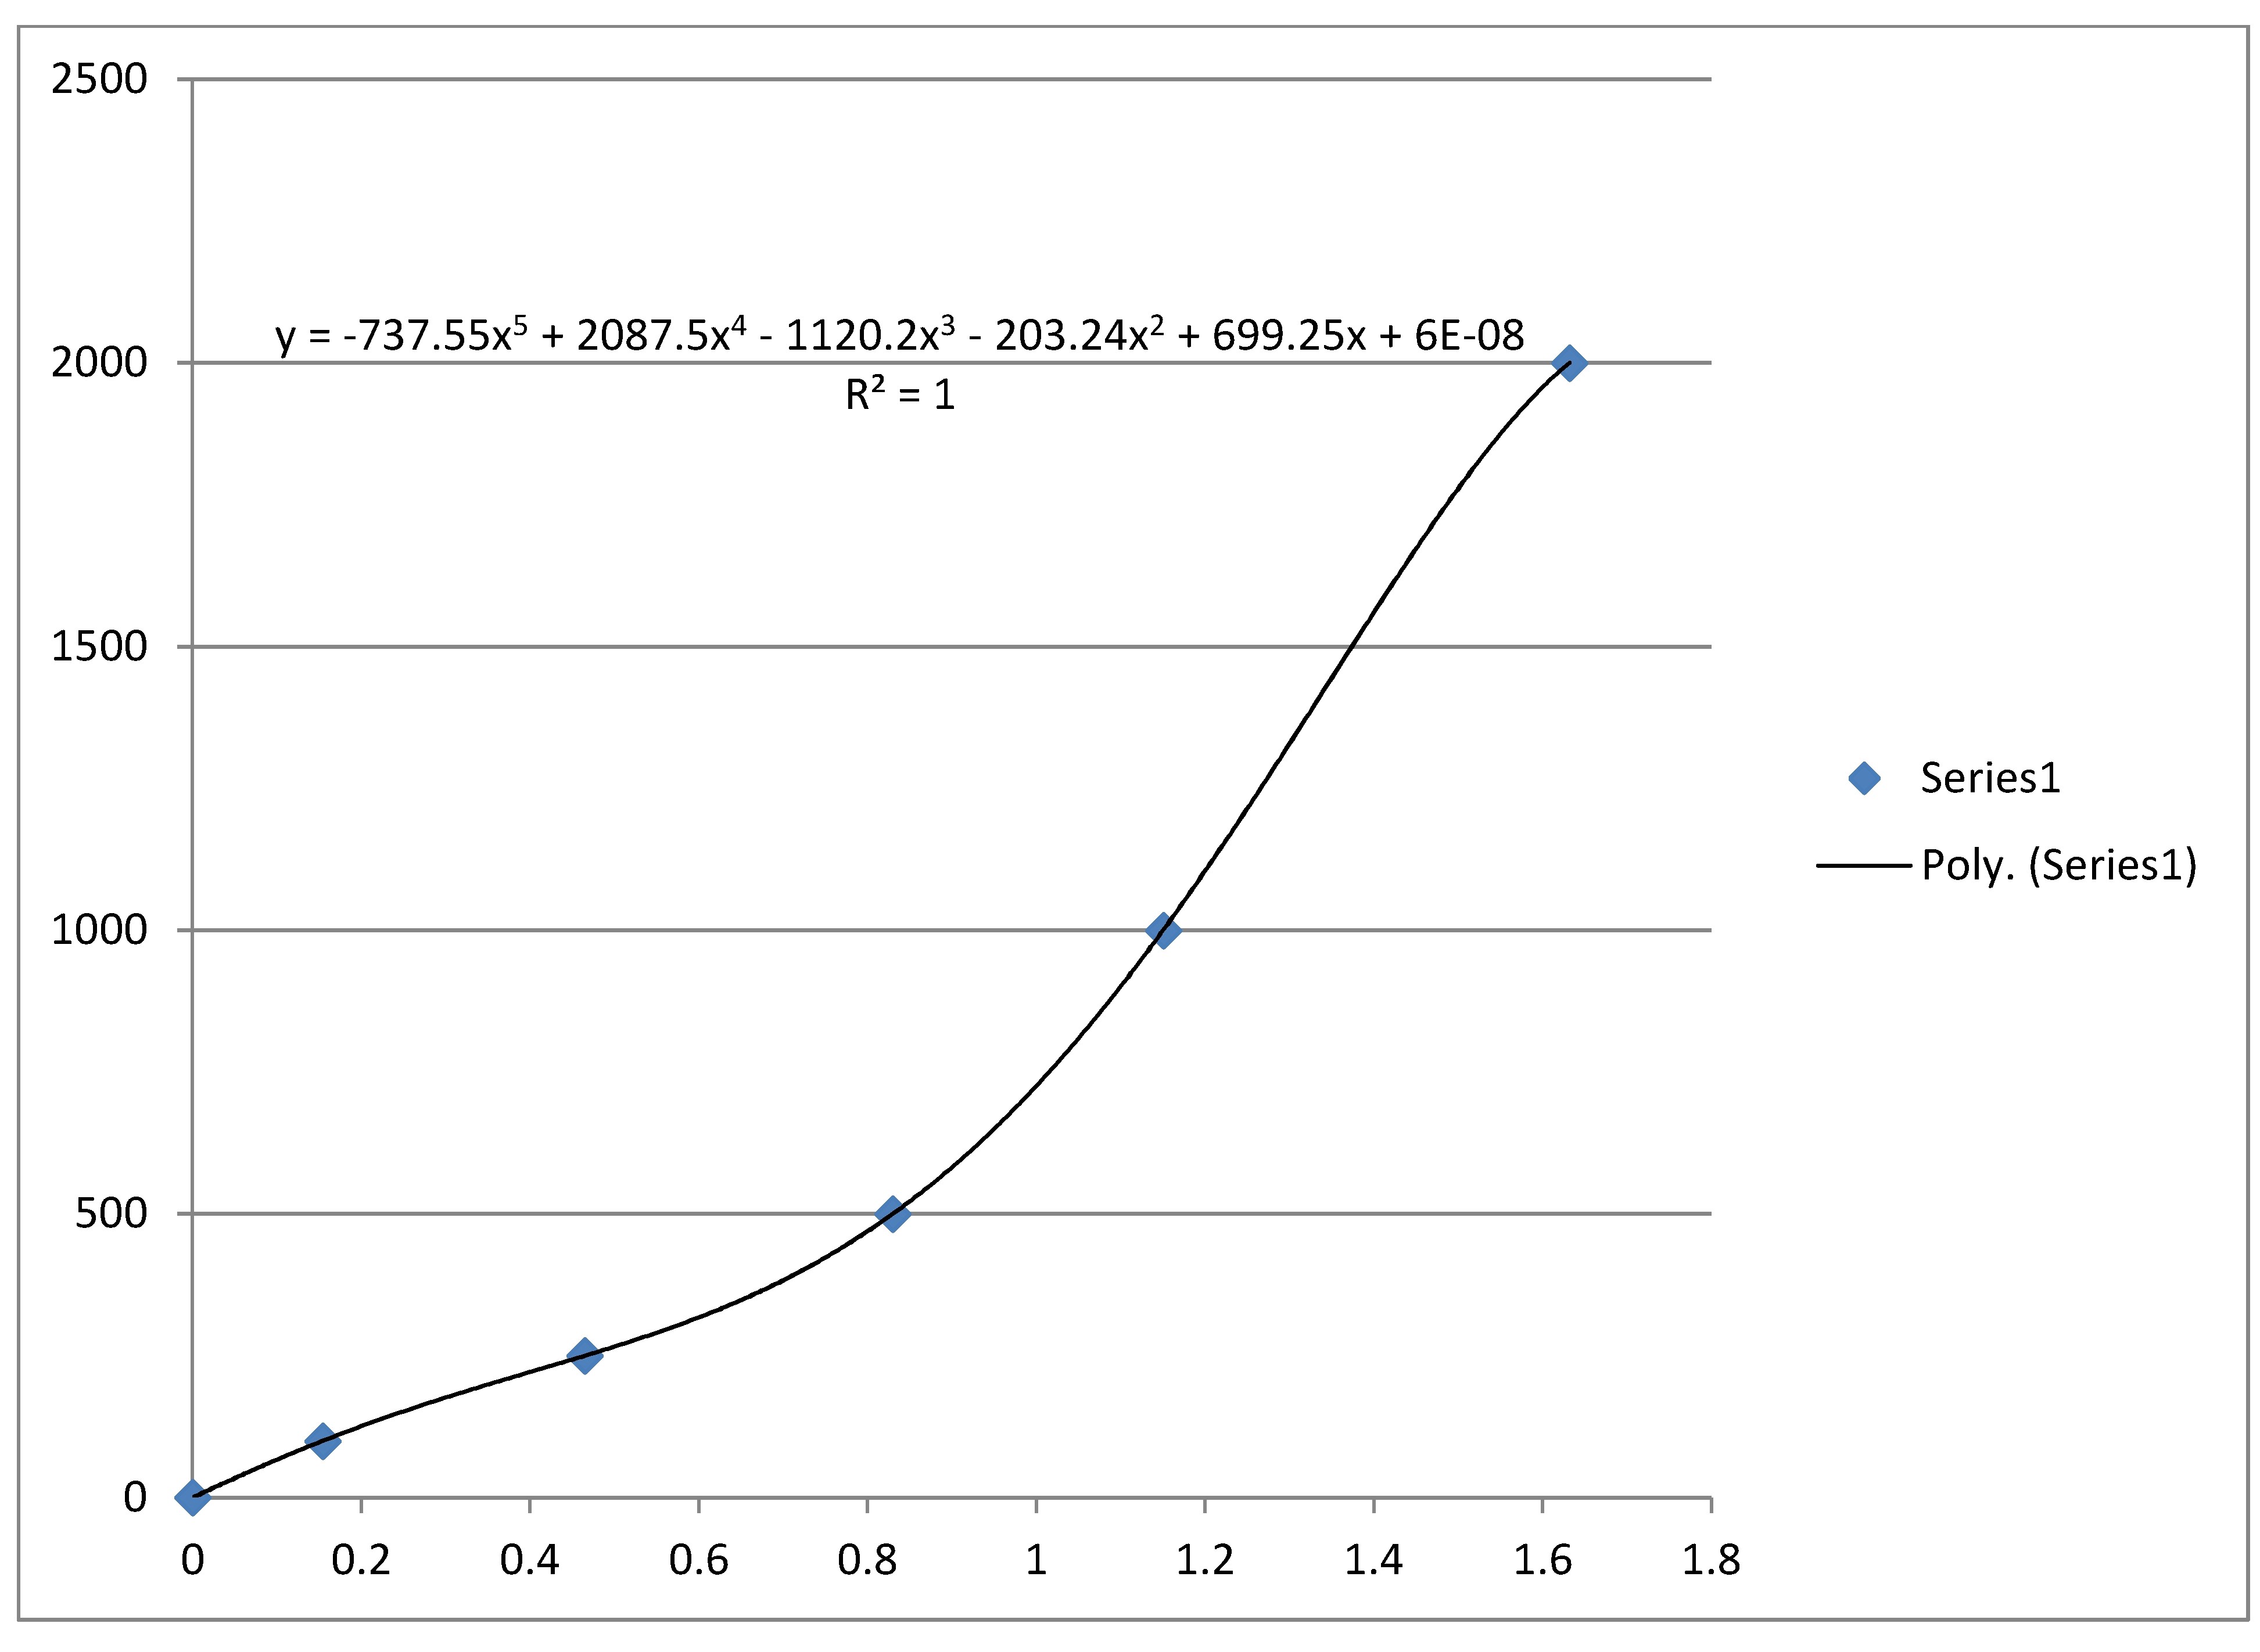
For λ = 528 nm, read with no filter, 3 ml Glucose solution and 1 ml Benedict's reagent, heating mixture for 1 minute in a boiling water bath in each case I obtained following trendline made by Excel. x-axis: absorbance, y-axis: concentration mg Glucose/dl.
The mass concentration is defined as the mass of a constituent divided by the volume of the mixture:
Therefore the mass concentration under above mentioned circumstances is given by (neglecting the last term of the Quintic function):
where A is the absorbance at a wavelength λ = 528 nm.
We might overfitting the model but we can run an additional K-nearest neighbor classification to find the usual concentrations mentioned on a Urine test strip:
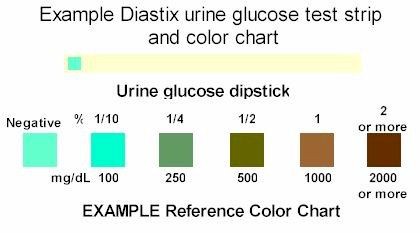 Source: http://www.caninediabetes.org/pdorg/urine.html
Presence of > 40 mg Glucose/dl Urine could already be an indication of diabetes or a kidney disease.
Spectrophotometer demonstration video:
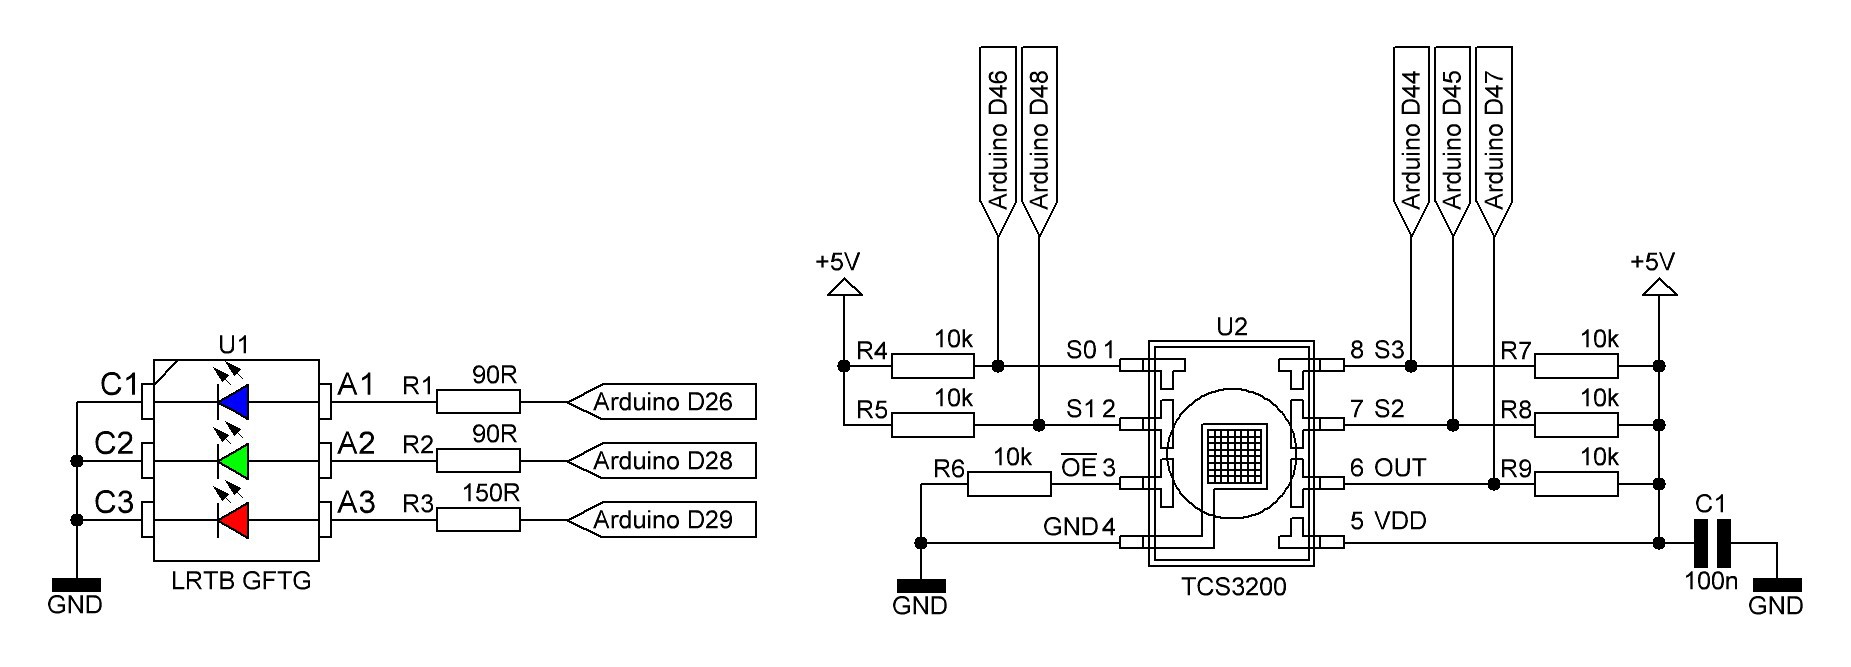
Spectrophotometer schematic (temporary):
R1 - R3 are series resistors for the RGB LED LRTB GFTG and R4 - R9 pull up/pull down resistors for the color sensor TCS3200. C1 is the usual decoupling capacitor for U2.
 M. Bindhammer
Discussions
Become a Hackaday.io Member
Create an account to leave a comment. Already have an account? Log In.