Paul Kocyla
-
True mechanical oscillation
02/15/2016 at 19:08 • 0 comments![]()
Happy to say that the peaks of the last EMDrive V3 measurement (triggering the acoustic natural frequency of the setup by OOK modulated RF to the cavity) are most probably natural mechanical oscillations and NOT parasitic effects due to EMI.
(Cavity operated at resonance frequency - OOK modulated to generate vibrations. Read previous post for more details)
- I put the electret capsule into different places inside the setup.
Only if the capsule is mechanically attached to the cavity you can see the oscillations, there is no peak and so no measurable EMI in all other cases.
- Even if the capsule is loosely located on the cavity in the same position that gives a peak, but not sticked, there is no peak, so I can exclude EMI and capacitive coupling in this case.
- An electrical coupling is not probable. Even by electrically connecting the capsule´s casing to the cavity there is no peak. In normal case the capsule is isolated from the cavity.
Thanx to Aurelio Czargb Ramos for suggesting that the peak might be at the natural mechanical ringing frequency of the cavity. I checked this by performing another measurement with a 3 gramm mass added onto the cavity.The results are here:
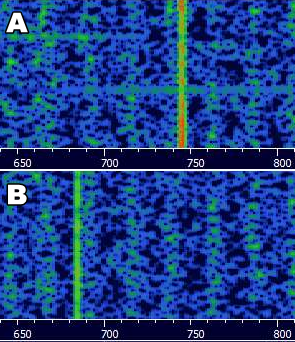
Waterfall A: No mass added
Waterfall B: 3 gramms mass added
In case B the ringing frequency is lower which is to expect for a greater oscillating mass.
The peak occurs at about 2680 Hz. I am using HDSDR software to display the spectrum. The picture shows a zoom into the graph in the CW mode. This is usually made for hearing morse signals in a constant wave transmission, so it has an offset of 700Hz from the center frequency. The center was set to about 2680Hz, so 720Hz in the graph represent 2700Hz in the signal - hope that´s not confusing.
After I was told that some trolls were laughing about me for just messing around and not naming the axes of my diagrams (which I did for offset reasons), so I better say it clear: These motherf*ckers don´t even read the description, they just start barking when someone shows some results.
I am really excited about following tests which will hopefully confirm a directional net force and not a lorentz force or similar. -
Results
02/13/2016 at 21:33 • 10 commentsJust finished an acoustic test of the EMDrive V3 and got interesting results:
Neither my milligram scale nor the interferometer with its relatively heavy table was able to detect any force due to noise.
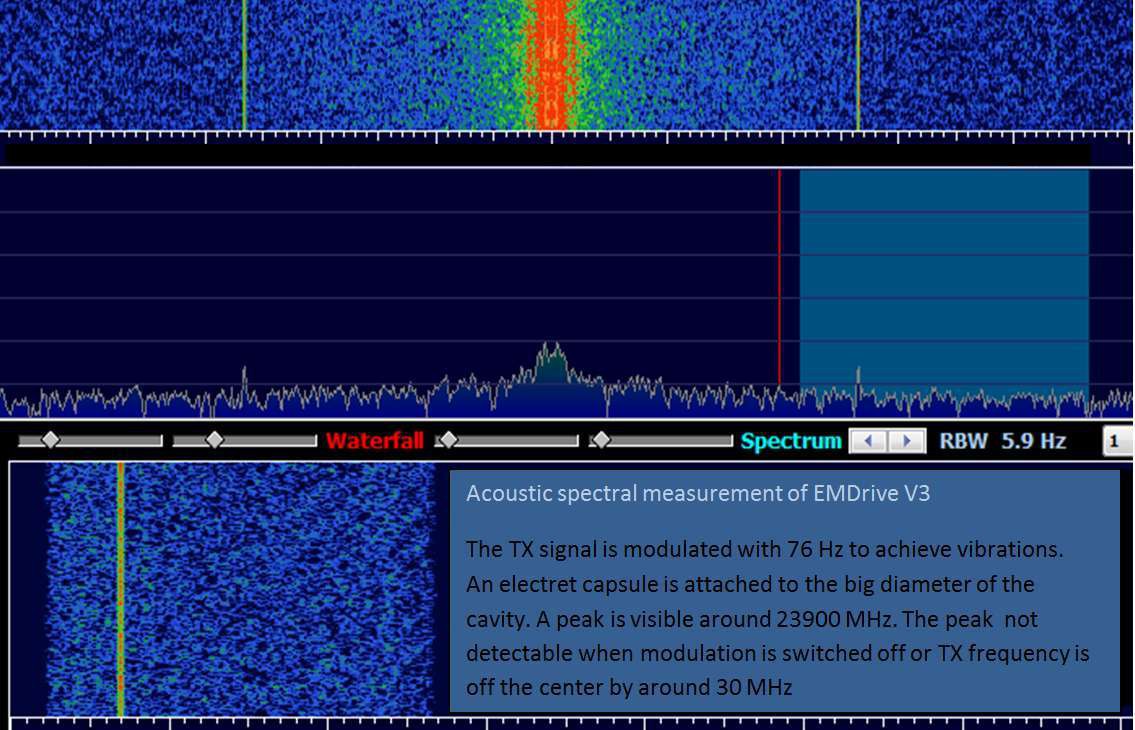
I tried to pick up some force by attaching an electret capsule to the cavity, modulating the output power with a low frequency and looking into the acoustic spectrum (with HDSDR) - and voilà, there are some results.
Of course, this quick test doesn´t prove that the force is directional and not just a vibration.
But it shows that the peak only occurs around the resonant frequency of 24100 MHz for which the cavity was designed - and stops when no modulation is applied or the frequency is too much off the center frequency.
What I didn´t check yet is if the picked up signal is just the EMI of the transceiver. I´ll check it later of course - anyway to avoid trolls to call my science "bad" - more tests will follow![]()
Additional information: The peak is not at the modulation frequency (76 Hz) but in the kHz range - it changes when I change the modulation frequency. Is it an alias effect or maybe a harmonic on the mechanical resonance frequency - I´ll have to take a closer look. The HDSDR software is usually used with an radio receiver so the frequency display under the waterfall was wrong (so I blacked it out). I´ll need to make the correct settings to see the correct audio frequency of a peak - I´ll do it in the next post.
Anyway this result is just preliminary, I posted quickly what I just did - I´ll check if it´s also happening when the electret capsule is not attached to the cavity but just nearby. -
EMDrive Cavity V3 test measurements
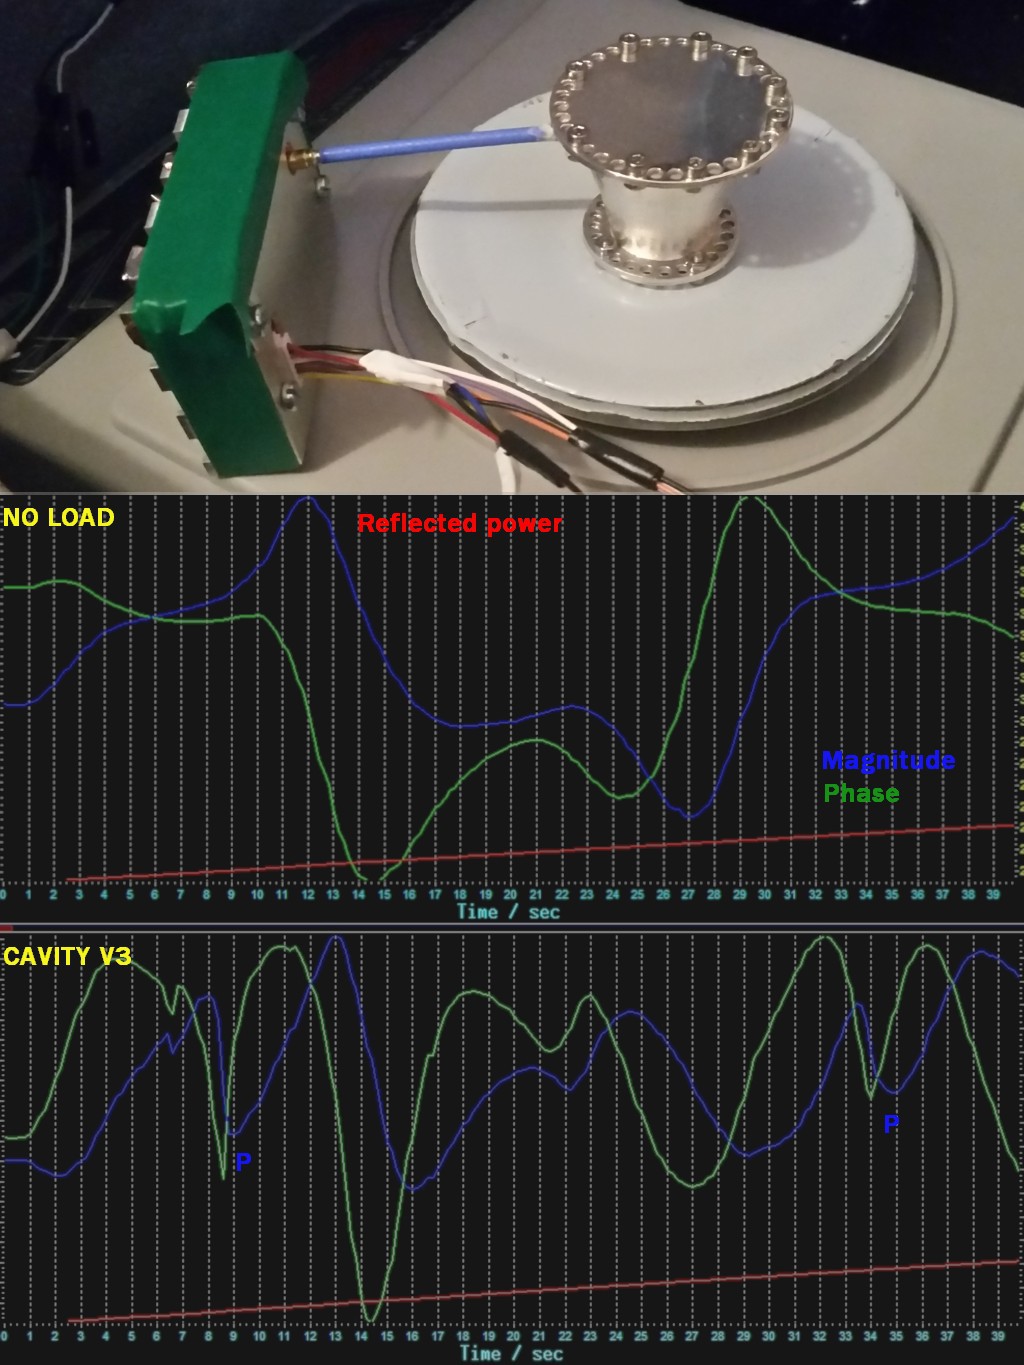
02/01/2016 at 08:53 • 6 commentsTest measurement with the new silver cavity V3.
First graph shows the response with no load,
second graph shows the response with cavity attached.
I marked two places where I assume an excitation, the left peak is close to the desired TE013 mode.
However, the graph is not so clean like in theory papers, so I´ll need some help regarding the interpretation of the graph.
(First scale tests don´t give results due to noise - i am working on that)Graphs show reflected power (at least mostly, if the directional coupler is working as desired :)
![]()
-
Board finished
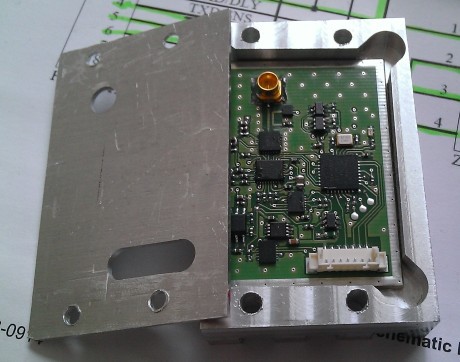
01/29/2016 at 11:13 • 0 commentsThe EMDriveV3 board is soldered and ready for testing on weekend.
It will be embedded in the casing, thermally coupled by a thermal pad.
![]()
-
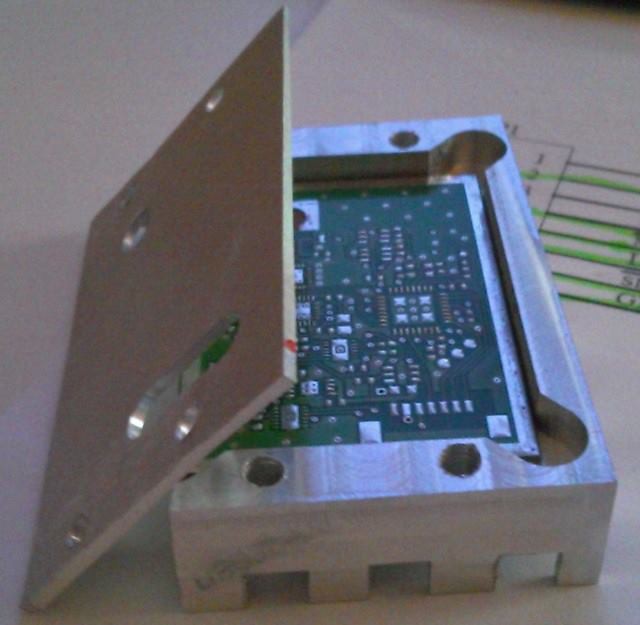
Casing V3 finished
01/26/2016 at 17:22 • 0 commentsCasing for EMDrive V3 board finished.
It´s kind of messy, but should do the job.
There´s a serious heatsink to radiate out the 2.5 Watts of power dissipation.![]()
-
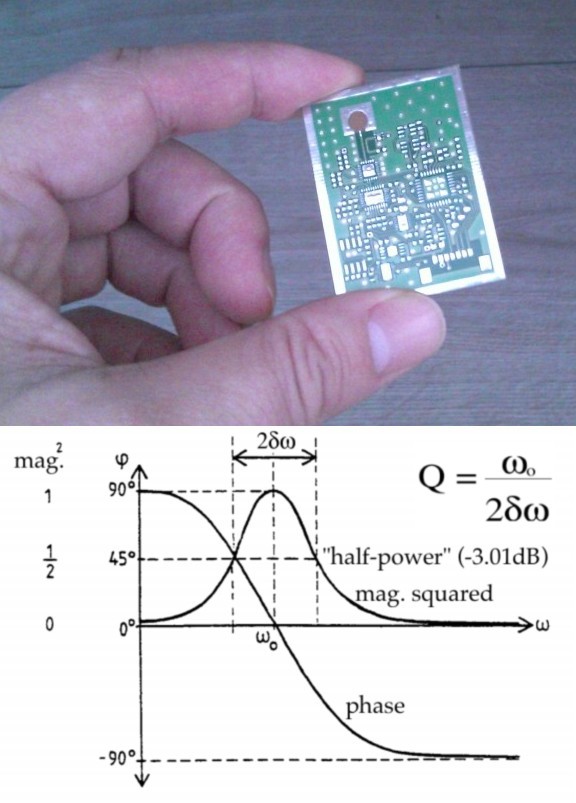
New driver/analyzer PCB
01/22/2016 at 09:54 • 12 comments![]()
Finally the new driver board arrived. Like mentioned before, it is intended to work as a vector network analyzer (VNA) beside its function as 24 GHz RF power source.
It should be able to measure the power reflected from the cavity in phase and magnitude to tune into resonance frequency and even calculate the Q factor.
Look at the chart to see how phase and magnitude behave below/in/above resonance frequency.
However, it is my first try in directional coupling and microwave power measurement techniques, so I don´t know how good it will work.
Further improvements to the last system:
- PA current sensing done via a shunt instead of a hall sensor (which was not very accurate)
- PA biasing improved
- New silver cavity designed for TE013 mode @ 24.1 GHz -
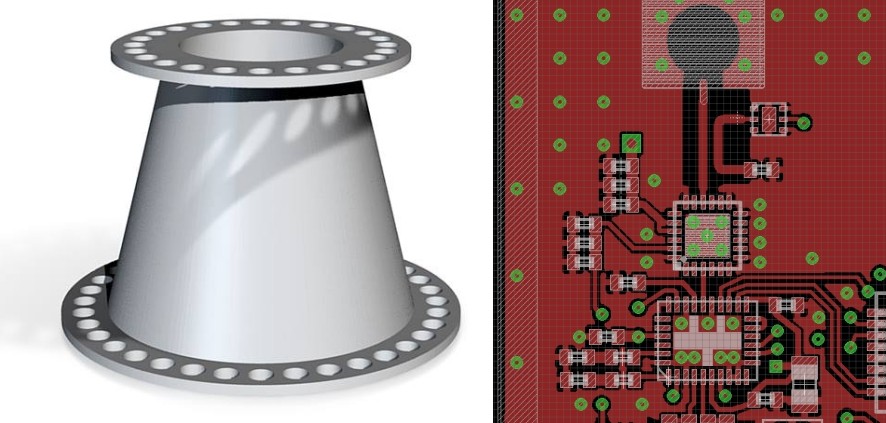
Plans for 2016
01/03/2016 at 17:34 • 2 commentsWelcome to 2016 - Long time has passed since the last posts, but the development was not stalled. Here are the plans for this year:
![]()
- A new silver cavity designed for 24.1 GHz in TE013 mode is on the way
- An improved RF source will have a vector network analyzer (VNA) on board which will allow to easily tune into resonance and calculate the Q factor of the cavity
- Designing a pressform for ceramic cavities and building up an YBCO baking lab
-
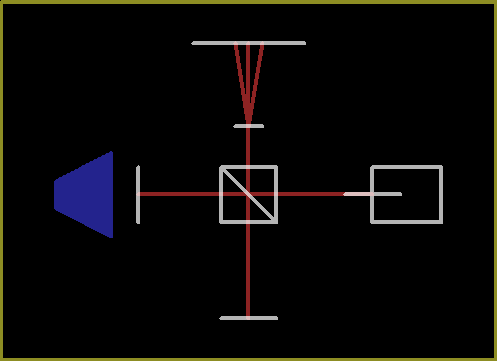
Juday-White Experiment
10/20/2015 at 21:06 • 27 commentsI performed a modified Juday-White experiment with the BabyEMdrive:
![]()
In the previous experiments, the EMdrive was sitting on a moving platform, which was connected to one of the mirrors of the interferometer.
This time, the interferometer setup is solid, both mirrors are fixed.Assuming that a drive in line with one of the laser paths will contract/expand the space, the interference pattern would change. In the original Juday/White experiment, the EMdrive was placed into the laser path (I assume with drills in the endwalls to let the laser pass through).
I positioned the EMdrive just behind one of the mirrors, hoping an eventual space contraction would be strong enough to alter the length of the laser´s path.
And indeed I measured something. I don´t know if these effects are really related to space contraction or are for example caused by heat. A first sight shows a difference related to the EMdrive orientation, but I´d like to give the interpretation to you, because I don´t want to be affected by possible personal illusions.
You will find the data in the repository under charts\JW -
Another promising test
10/08/2015 at 06:34 • 3 commentsI could make the interferometer more stable by tilting the EMdrive platform down a bit on one side. The pattern is not jumpy any more and behaves smoother.
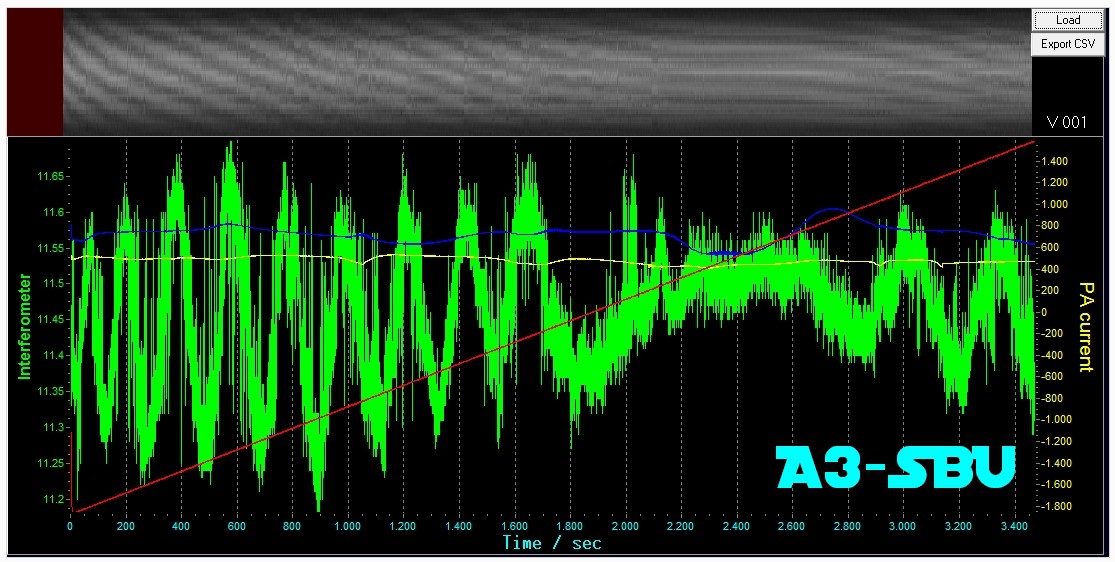
I could reproduce the A2 test from previous log and it shows force at similar frequency and the same direction as the previous test.
The BS (reversed) test showed nothing, but the RF source was already very hot and didn´t show good RF transfer, so I´ll repeat it today.
If it will be successful, I will modify the RF source so it can find the best conditions automatically.
If these tests can be reproduced several times, I will redesign the RF source.I put the data into the repository (03-ProjectLog50 -> A3-SBU)
![]()
-
Tests, results and issues
10/04/2015 at 08:42 • 25 commentsHere come some interesting new measurements, issues and some clues for the future.
![]()
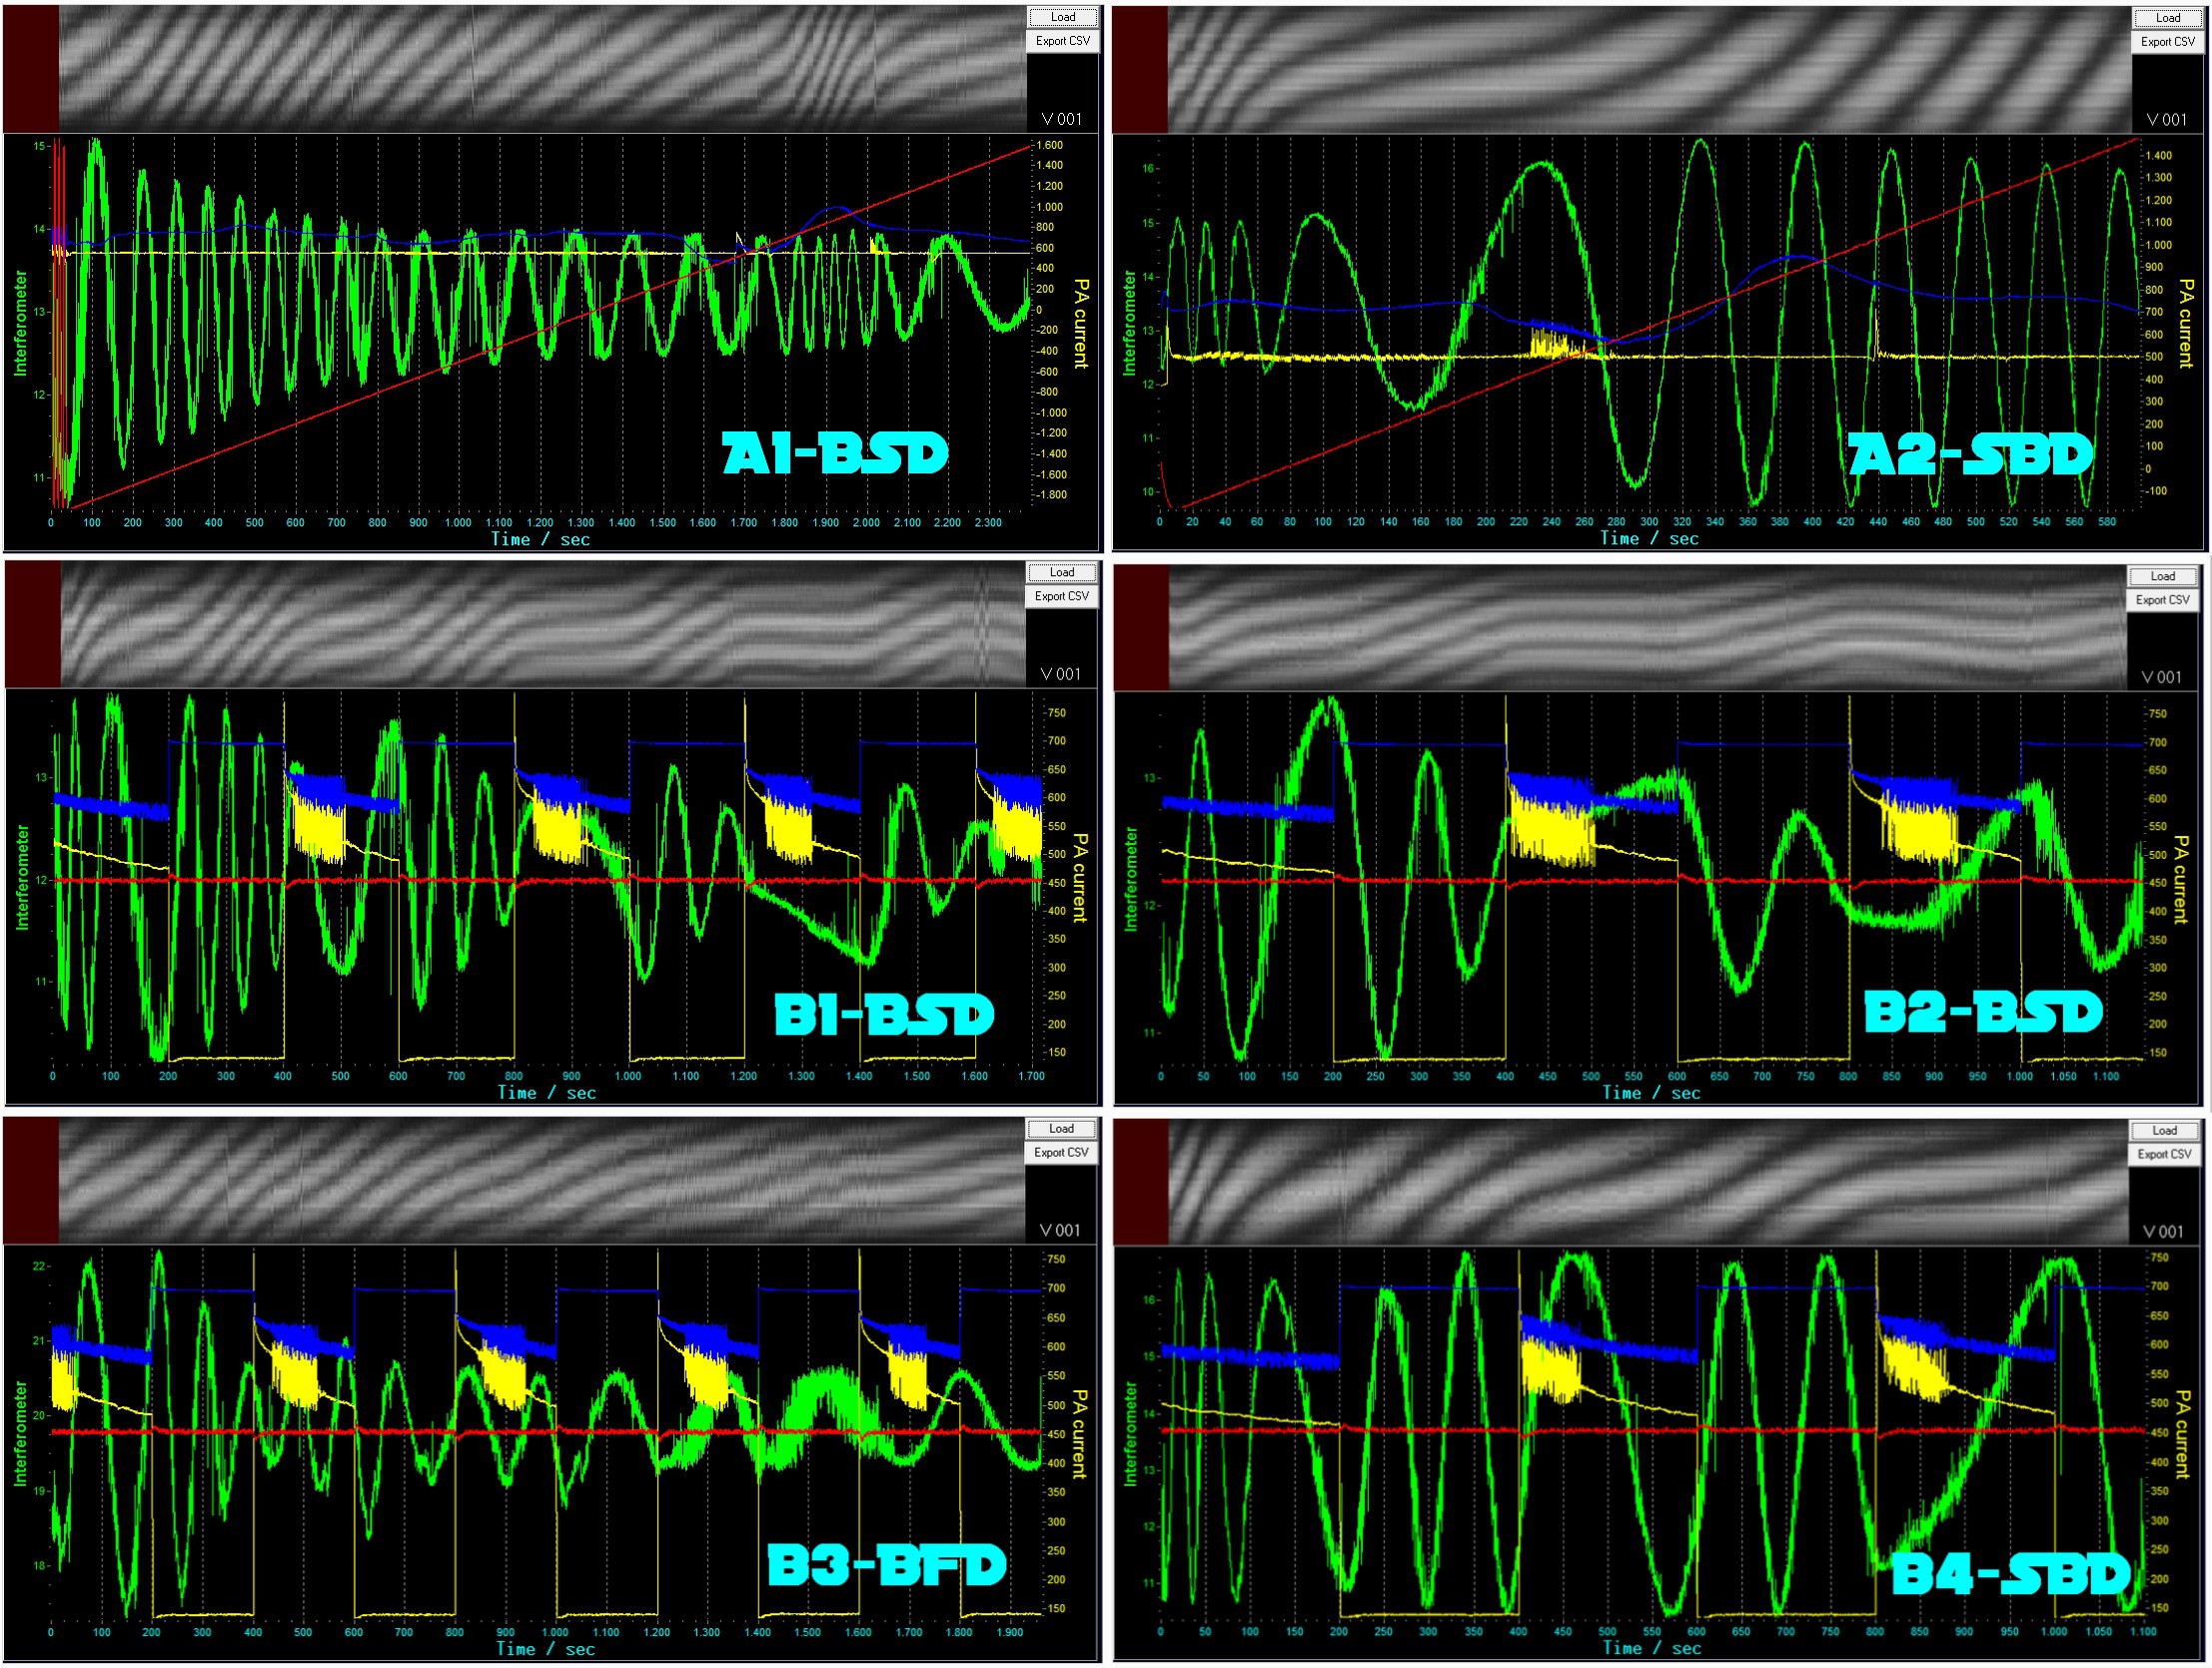
Let´s start with the charts B1-B4:
I set the frequency to 24.445 GHz. At this frequency, there was an interesting ripple in the PA current draw, so I focused on it.
I toggled the PA current ON and OFF and noticed quite strong forces.
The experiment was replicable many times, but the forces always push in the same direction, regardless of the orientation of the cavity.
I assume this is a thermal issue. When the RF source heats up, it produces a push.
Nevertheless this is interesting, because the forces seem much stronger in B1 and B2 than in B3 and B4.B1 and B2 have the cavity orientation BS (see Explanation log), B3 is the cavity pointing to the ground, and B4 is SB orientation.
Maybe there is a superposition of temperature force and real force, but maybe the physical change of the cavity orientation causes the forces to appear smaller in the graphics. I think this is worth further investigation.Now to the charts A1-A2:
This time, I kept the PA current constant (to avoid the thermal issue) and made a frequency sweep over long time.
In A1 you can see that there is a short band where a significant force occurs.
I took this band and applied another sweep with the cavity inverted - as seen in A2.
There occurs a force - and it is pointing into the opposite direction which implies that the EMdrive is working. However, I was not able to replicate the A1-A2 results even with 20 or more tests due to several reasons:
- There is a drift in the interference pattern over time. During long time eperiments, the pattern drifts into an unmeasurable state. It takes many tries (5-10) until the setup keeps the pattern stable for more than 20 minutes. It´s always drifting a bit, but usually after adjusting the mirrors, it will twist or blur our after a short while.
- The performance of the RF source depends on the temperature. So for a given current, it might degrade over time. Adjusting the current manually for long sweeps takes many tries. In most tries I could not see significant RX power changes due to wrong current ajustments.
Conclusions:
Both approaches are interesting for further tests.
Please let me know what you think about it.The data is in the repository under "Charts\ProjectLog50"