 Johnny
For this project I'm using an Arduino Uno with a ESP8266. I'm reading an ADC pin/pin's voltage on the Uno and wirelessly sending the data to plotly's server for real-time visualization. Plotly is a free online browser based tool for visualizing data, which also has a streaming feature for displaying your data in real-time. Plotly is great because any device that has a browser and is connected to the internet (smartphone, PC, tablet, etc) can see the real-time data. This is not a full professional solution I'm offering here, just a quick demonstration on how this can be done with these common cheap parts.
*I highly recommend you check out my other project, where I run similar code natively (no Arduino needed) on the ESP. It is much less work then this project.
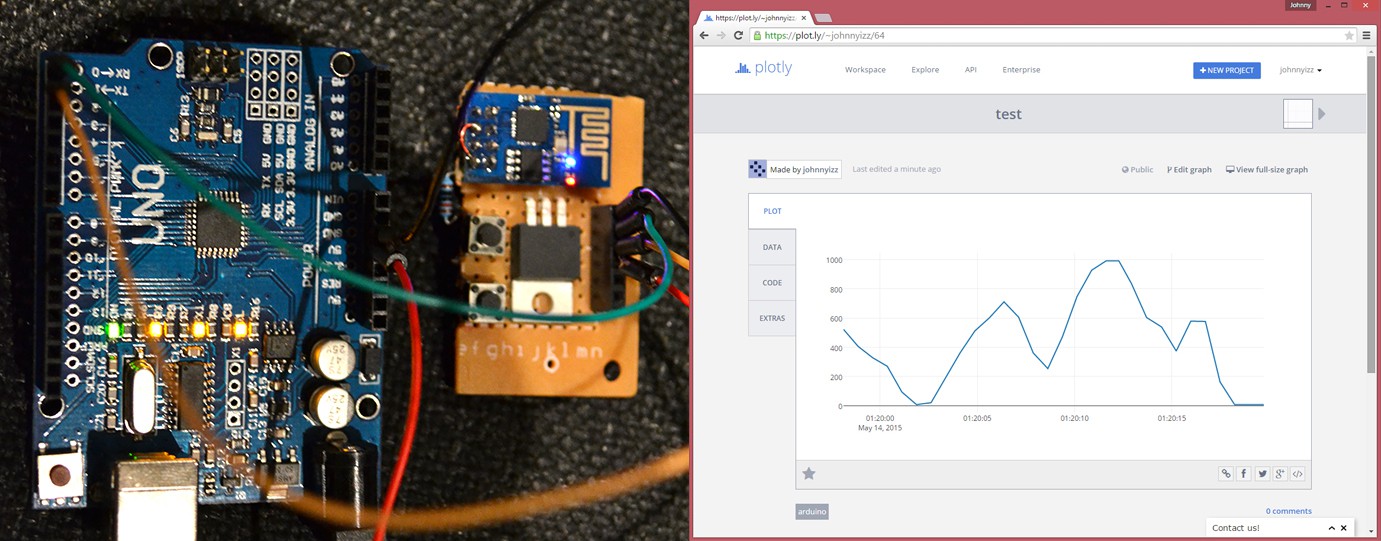
I was helping out someone who wanted to send real-time data wirelessly to a smartphone/PC on a tight budget. I found this method of displaying real-time data to be useful. Even though we did not end up using this solution, I can see someone using this for a home weather station or something similar.
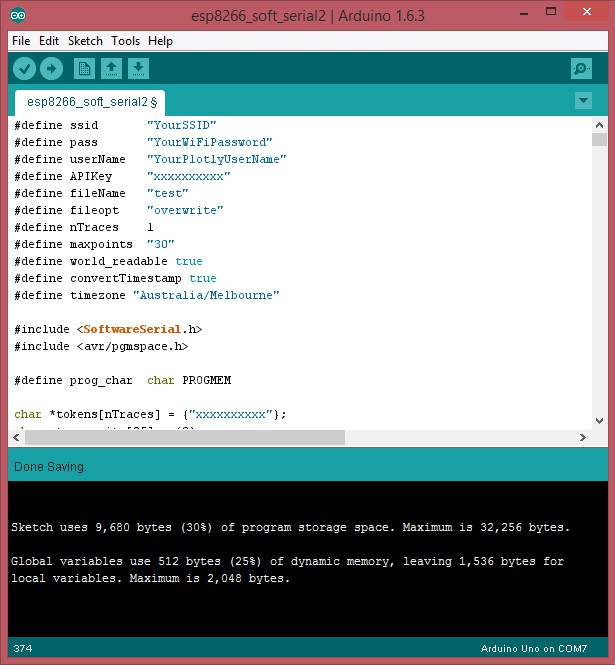
The Arduino Sketch
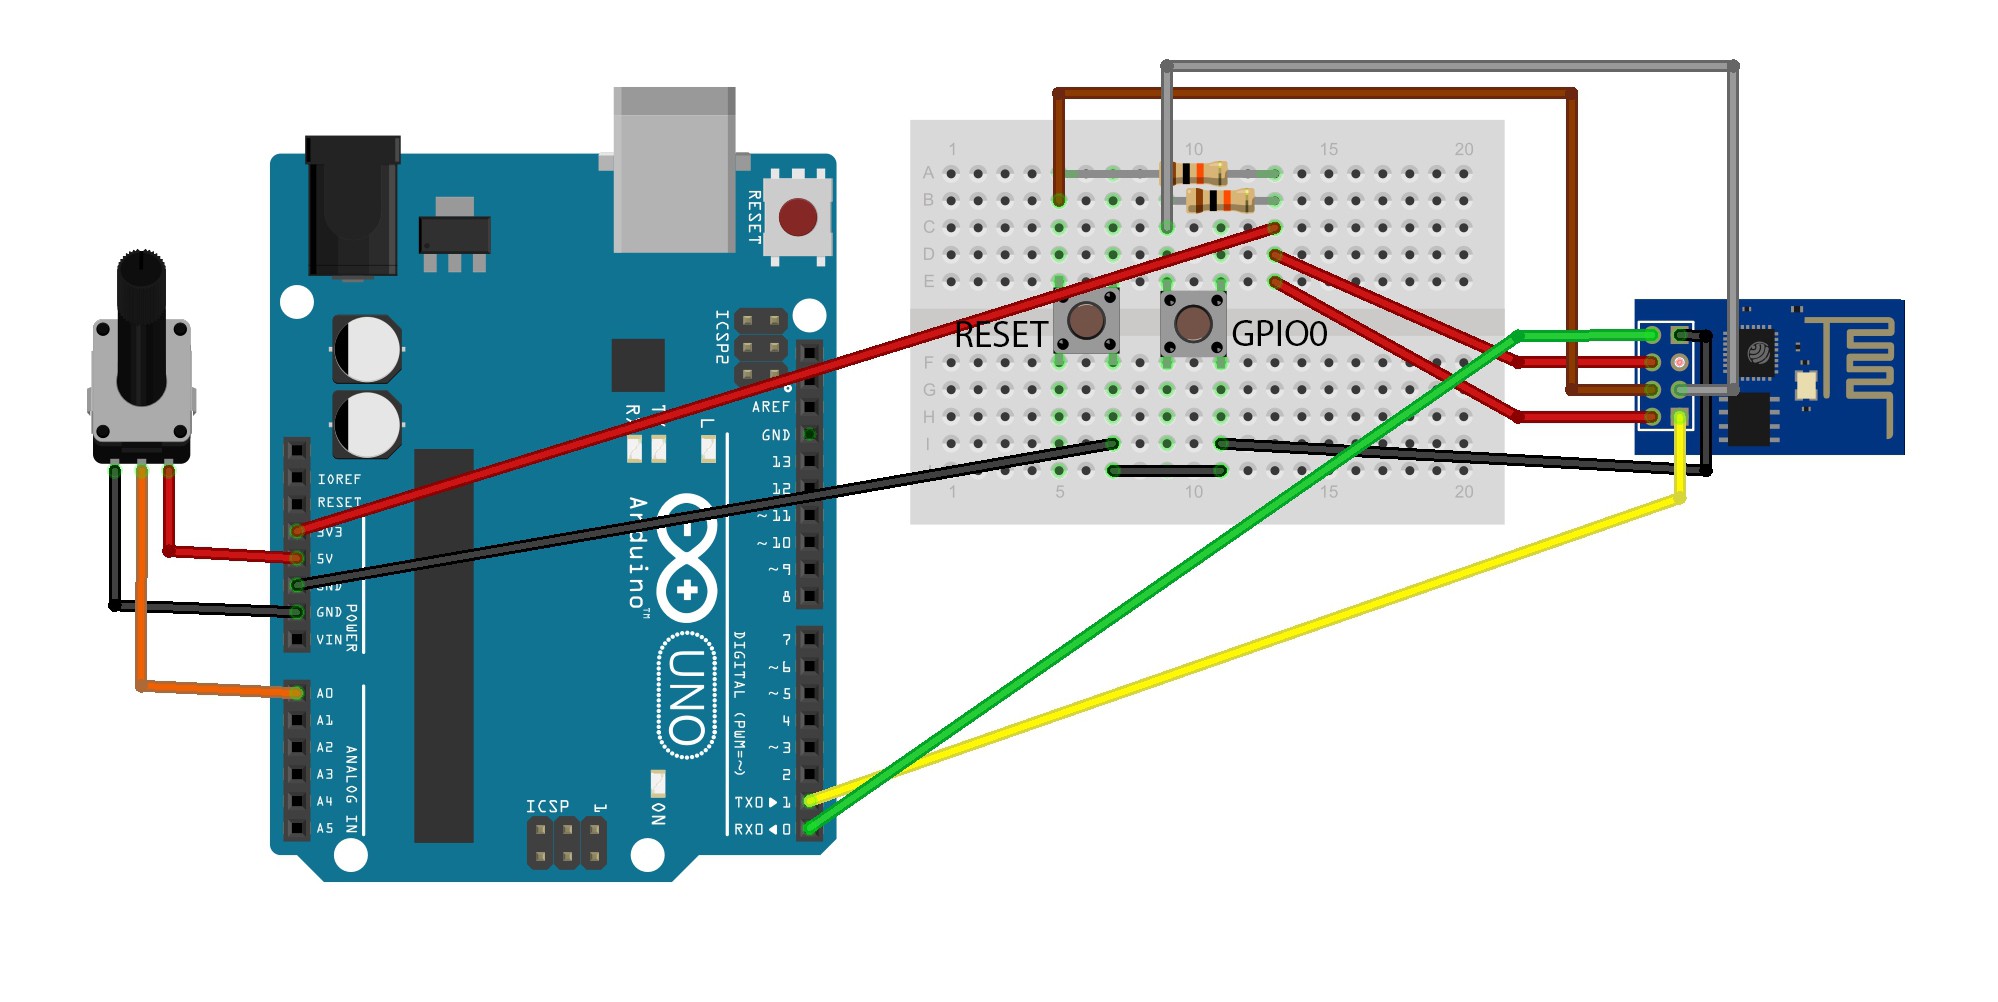
Here is my Arduino sketch. It is made for Arduino Uno/Pro Mini paired with a ESP8266 running the 0018000902-AI03 firmware (I have inlcuded the firmware bin file in the instructions section). Originally my code was development on an Arduino Due which has 96 KB of SRAM. This is plenty of SRAM to store the strings used in the original sketch, but because the Uno has only 2 KB of SRAM it's much wiser to store this in flash. This sketch compiles with 30% flash and 25% SRAM used!! Leaves plenty of room for more development. The code makes use of hardware UART (digital pins 0 & 1) to communicate to the ESP8266 and soft UART (digital pin 11) for debugging purposes.
#define ssid       "YourSSID"
#define pass       "YourWiFiPassword"
#define userName   "YourPlotlyUserName"
#define APIKey     "xxxxxxxxxx"
#define fileName   "test"
#define fileopt    "overwrite"
#define nTraces    2
#define maxpoints  "30"
#define world_readable true
#define convertTimestamp true
#define timezone "Australia/Melbourne"
#include <SoftwareSerial.h>
#include <avr/pgmspace.h>
#define prog_char  char PROGMEM
char *tokens[nTraces] = {"AAAAAAAAAA","BBBBBBBBBB"};
char stream_site[25] = {0};
SoftwareSerial mySerial(10, 11); // RX, TX
const PROGMEM  char  cmd_0[] = {"AT\r\n"};
const PROGMEM  char  cmd_1[] = {"ATE1\r\n"};
const PROGMEM  char  cmd_2[] = {"AT+CWMODE=1\r\n"};
const PROGMEM  char  cmd_3[] = {"AT+CIPMODE=0\r\n"};
const PROGMEM  char  cmd_4[] = {"AT+RST\r\n"};
const PROGMEM  char  cmd_5[] = {"AT+CIPMUX=1\r\n"};
const PROGMEM  char  cmd_6[] = {"AT+CWJAP=\""};
const PROGMEM  char  cmd_7[] = {"AT+CIPCLOSE=\""};
const PROGMEM  char  cmd_8[] = {"AT+CIPSTART=0,\"TCP\",\""};
const PROGMEM  char  cmd_9[] = {"AT+CIPSEND=0,"};
const PROGMEM  char  resp_0[] = {"OK"};
const PROGMEM  char  resp_1[] = {"ready"};
const PROGMEM  char  resp_2[] = {"no change"};
const PROGMEM  char  resp_3[] = {"CONNECT"};
const PROGMEM  char  resp_4[] = {"Unlink"};
const PROGMEM  char  resp_5[] = {"Linked"};
const PROGMEM  char  resp_6[] = {">"};
const PROGMEM  char  resp_7[] = {"~"};
const PROGMEM  char  error[] = {"*ERROR "};
const PROGMEM  char  error_0[] = {"0*"};
const PROGMEM  char  error_1[] = {"1*"};
const PROGMEM  char  error_2[] = {"2*"};
const PROGMEM  char  error_3[] = {"3*"};
const PROGMEM  char  error_4[] = {"4*"};
const PROGMEM  char  error_5[] = {"5*"};
const PROGMEM  char  error_6[] = {"6*"};
const PROGMEM  char  error_7[] = {"7*"};
const PROGMEM  char  error_8[] = {"8*"};
const PROGMEM  char  error_9[] = {"9*"};
const PROGMEM  char  error_10[] = {"10*"};
const PROGMEM  char  error_11[] = {"11*"};
const PROGMEM  char  error_12[] = {"12*"};
const PROGMEM  char  error_13[] = {"13*"};
const PROGMEM  char  error_14[] = {"14*"};
const PROGMEM  char  error_15[] = {"15*"};
const PROGMEM  char  error_16[] = {"16*"};
const PROGMEM  char  string_0[] = {"Initializing plot with Plot.ly server...\r\n"};
const PROGMEM  char  string_1[] = {"\",\""};
const PROGMEM  char  string_2[] = {"\""};
const PROGMEM  char string_3[] =...
Read more »


I'm getting the "All Streams Go" and the url to the chart, but the streaming data isn't plotting. i.e.
34
{"x": 7645, "y": 5000, "streamtoken": "2m5iq5n4ve"}
I tried using wireshark to capture the traffic, but not very familiar with how to parse or see why it's not plotting
https://www.cloudshark.org/captures/ba50fba66815 (192.168.137.40)
Any idea how to format the capture to see what is causing the issue?
Thanks!