Sensor data are saved in JSON format. On the client side we have a simple HTML file that uses Ajax to update the graph by continuously unpacking the JSON data and updating the graph .
Once the server is running the user can access the dashboard by visiting
http://RPI-ADDRESS:port/Sensorian
where RPI-ADDRESS is the Ethernet or WFI address depending on which network interface is used and (port) is the specific port the user selects from Flask.

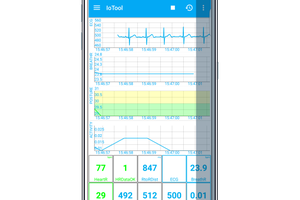
The screenshot above shows the dashboard data updating in real time.
@app.route('/Sensorian')
def readMPL():
    sensor.I2C_Initialize(altibar.MPL3115A2_ADDRESS)    #initialize I2C and BCM library
    AltiBar = altibar.MPL3115A2()                #initialize sensor
    time.sleep(0.5)
    AltiBar.ActiveMode()                        #puts sensor in active mode
    time.sleep(0.5)
    temperature = AltiBar.ReadTemperature()
    time.sleep(0.5)
    AltiBar.AltimeterMode()
    time.sleep(0.5)
    altitude =  AltiBar.ReadAltitude()        #Take a pressure reading
    time.sleep(0.5)
    AltiBar.BarometerMode()    #puts sensor in active mode
    time.sleep(0.5)
    baroPressure =  AltiBar.ReadBarometricPressure()        #Take a pressure reading
This basic example can be further expanded by using SQL to save the data locally or in the cloud.


 IoTool
 vaibhav sharma
 Katarina Zvarova