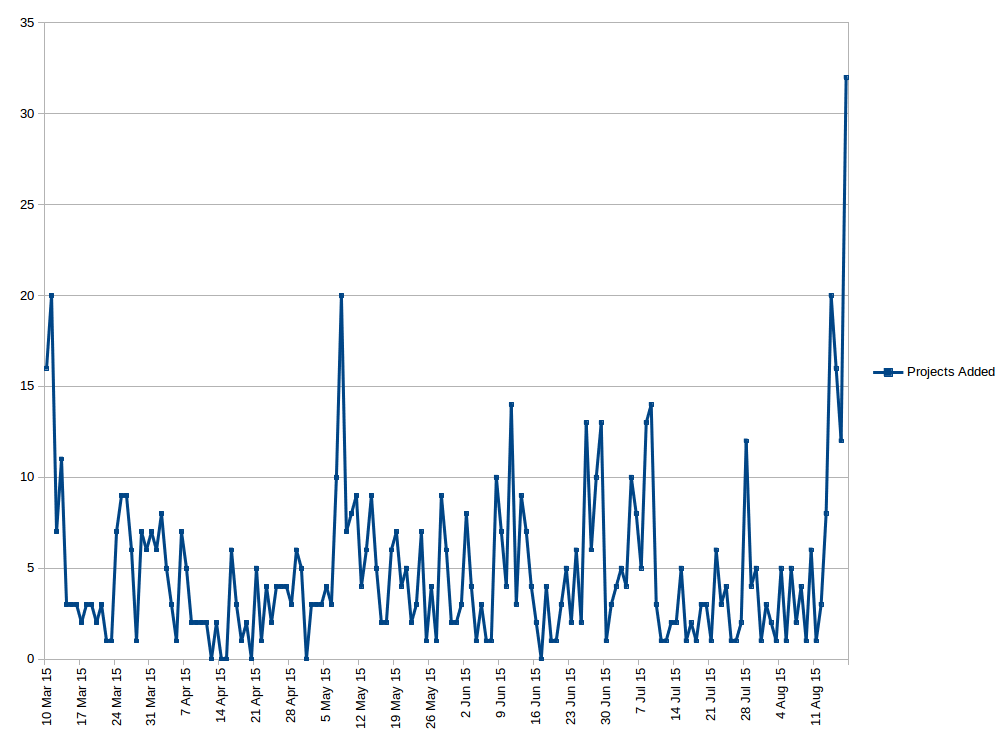
Projects Added Per Day:

Data - https://gist.github.com/anonymous/747e8acd2fae96421a93
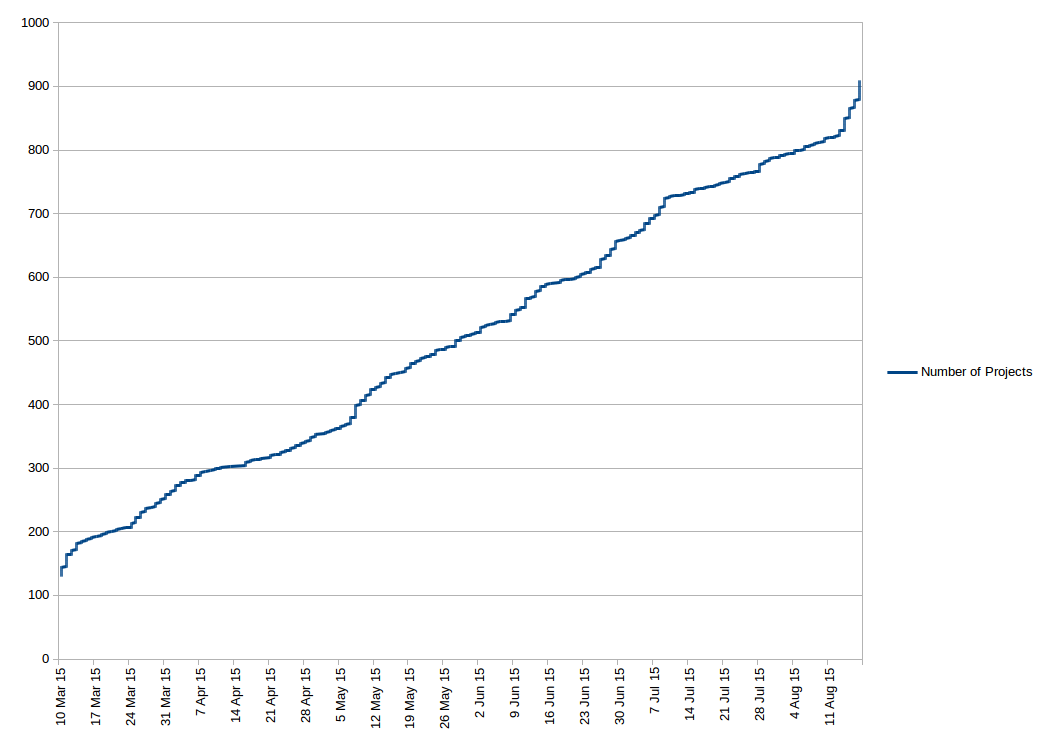
Total Number of Projects:

Data - https://gist.github.com/anonymous/00ff97cfc206f78afe47
The data was obtained from the "Created on" project date and the graphs were scaled to the duration of the prize (so projects added before this aren't shown in the first graph).
While there is a small inflection at the end, the growth rate was pretty steady this year. Can anyone name the spike events?
 Blecky
Discussions
Become a Hackaday.io Member
Create an account to leave a comment. Already have an account? Log In.