Brett Walker
-
PCBs Have Arrived!
09/21/2015 at 20:50 • 0 commentsHi guys, just a quick update re: our detector's excitation and detection circuit boards. They arrived a few days ago from New Zealand - fast, cheap and a very good job done. Not too bad for Reuben's first PCB design job!
Everything seems to be in working order, except our digital pot won't come online! More troubleshooting ahead. If anyone is experienced in I2C please feel free to contact us!
-
Productised Design: C4Derpillar
09/21/2015 at 20:34 • 0 commentsHi All,
Here's a quick render of what the C4Derpillar will look like. Essentially a box containing all of the circuitry and plumbing with two external ports for taking a sample and dumping waste liquid. There will also be 12 external pins for power, data capture etc.
It's looks minimalistic from the outside - that's because it is! We don't want wires hanging all over the place if she is operating in outback Queensland! As part of the build instructions in the next round a render of the inside of the device will be available, however we have to model most of the parts ourselves so it takes time (not to mention we have never done this before!)
-
Fabricating the Flow Block
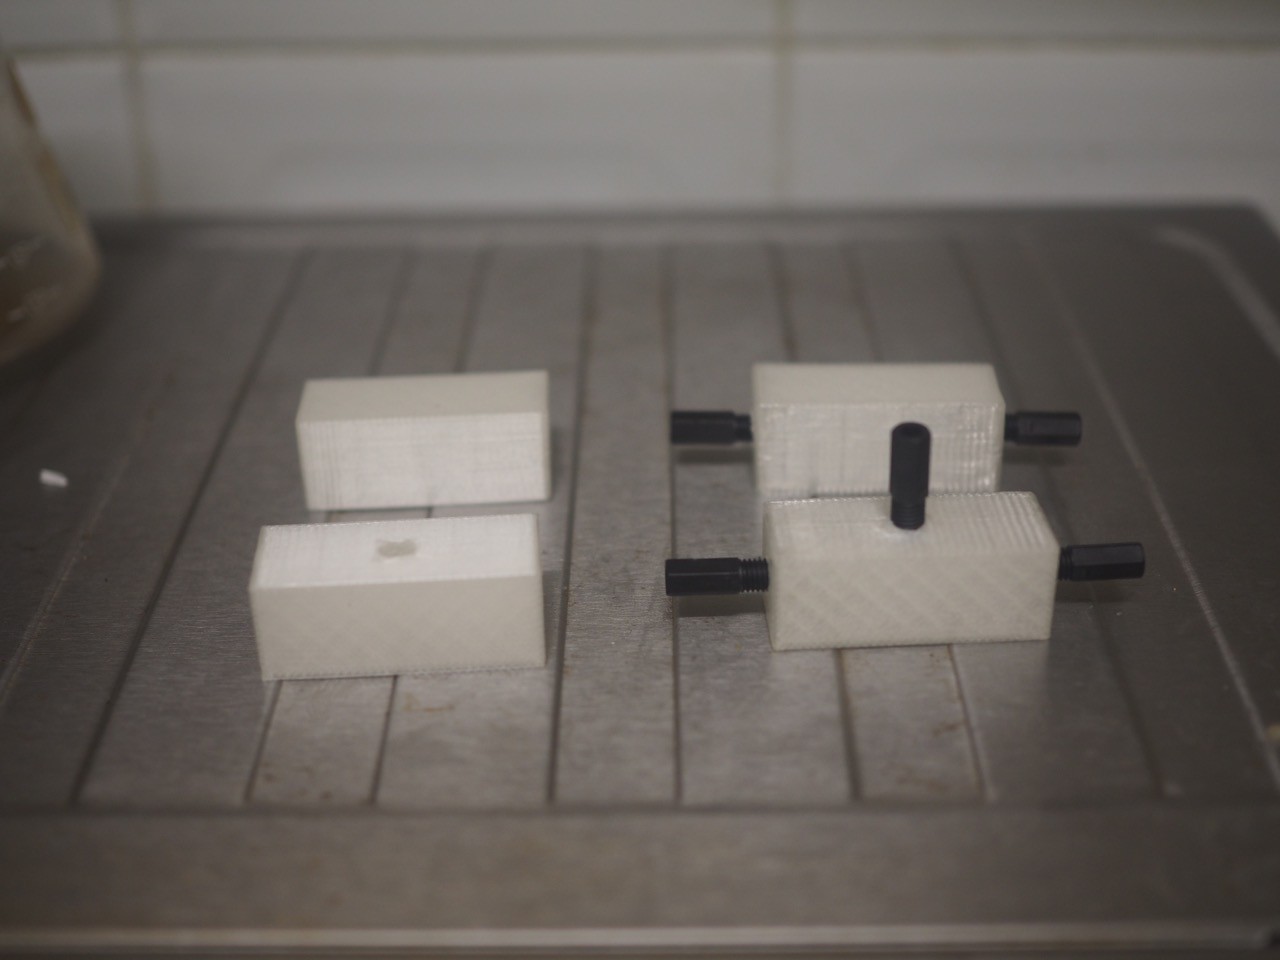
09/21/2015 at 20:11 • 0 commentsIn order to connect our 1/16" tubing to the 365um OD capillary tube used for the separation process, we decided to 3D print a flow block rather than buying the ~$100s commercial units available.
Each block serves as a connecting point to the capillary tubes through the use of a 1/4"-28 UNF nut. You can see the .STL files we used in our GitHub page LINK
The T-shaped block gives us a point where an electrode can serve as the ground for both capillaries, so we want it to screw in and sit in the flow path. The I-shaped block simply serves as a union between two 1/4"-28 UNF nuts.
Everything was printed on ABS as it is resistant to water and prevents biofilm formation. Acetone vapour treatment was used in an effort to better blend the printed layers and prevent leakage.
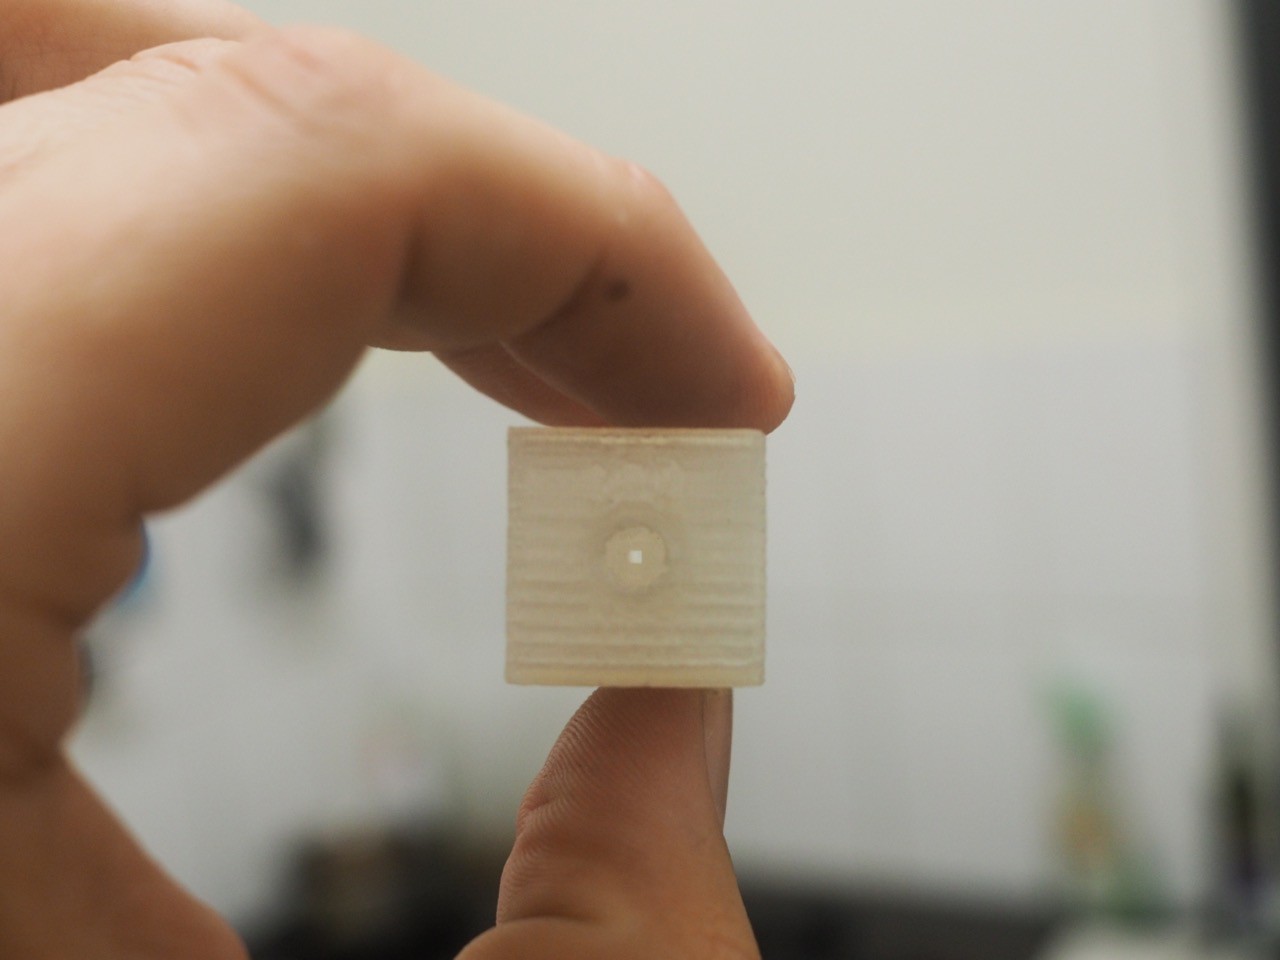
Each cylinder is 95% of the minor diameter of a 1/4"-28 UNF tap, which allowed us to easily tap the hole and test out the part by plugging in some tube.
![]()
![]()
Thanks to some kind souls on 3DHubs, we were able to get these produced overnight and delivered to our door for less than $20. Our fabricator was even able to remotely clear the bed and restart when we noticed an error in the diameter of the holes.
-
Meet the Team!
09/21/2015 at 18:54 • 0 commentsMeet the team
Brought together by a mutual love of beer and Rockhampton, QLD, Australia, our team all contribute their own unique talents to this project, today we’d like to take a chance to introduce ourselves.
This project was spawned from the collective vision of our team (Reuben Brown, Brett Walker and Taylor Wass) that saw the potential in this innovative technology to provide a cost-effective opportunity to empower in-need communities to monitor the health of their water sources. Originally, we just wanted to measure the nutrients in our fish tanks and hydroponic setups, but the project has grown far beyond this!
Reuben BrownReuben brings to the table a broad understanding of electronic design, built up from years of tinkering and pouring over the vast wealth of information available online as he was growing up. Despite studying Biology and Analytical Chemistry at QUT, he has continued to be drawn to experimenting with electronics, though he has found that these interests have converged in the C4Derpilar project.
When he’s not developing our flashy C4D detector & plumbing tiny tubes for the C4Derpillar, he’s busy tinkering on his automated marine tank, which he uses to provide the best environment for rare coral and tropical fish. Reuben originally was drawn to the use of C4D by his fish tank as a way to detect the ions in the water, as the disposable tests were expensive and wasteful.
Since the team has begun working on this project, Reuben has been invigorated by the various uses this technology could offer, both in assisting communities who suffer from unreliable and often contaminated water supplies but also in integration into smart home installations, to alert families and households of any contaminations in their water (such as the Animals river incident). Reflecting on his youth spent in the Australian bush, he realised that this could be invaluable for the thousands of Queenslanders who rely on bore water to survive the harsh Australian climate.![]()
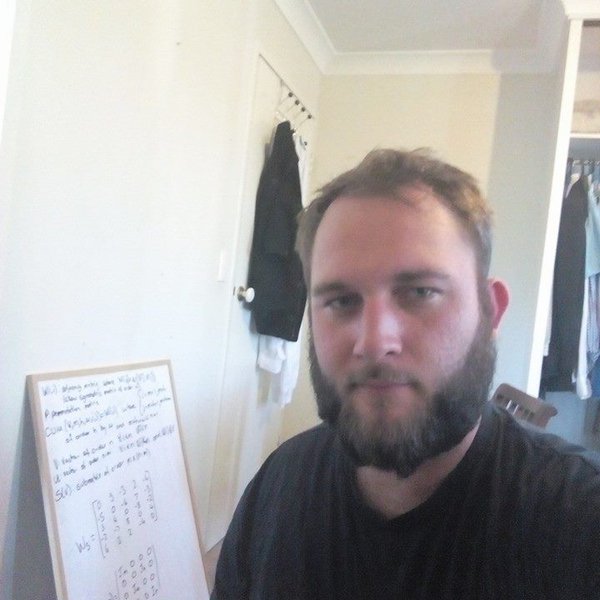
Brett Walker
Brett Walker is our big data (picture) thinker, with a passion for trains. After completing his Bachelor of Science in Mathematics at QUT, Brett went on to do his Honours in decision theory governing the scheduling of trains. This lead to Brett being a key player in a small team that was responsible for delivering an increased number of trains running more efficiently and punctually for a major city’s train network. At least we can always say that he made the trains run on time…
Brett has utilised his vast skills in the design of big-data systems and decision support tools, making him a key asset in undertaking the analytical side of our project, as well as providing the pivotal programming for our various microcontrollers.
Brett sees project as a distributed network of precise sensors relaying information to the public in ‘quasi-real-time’, which has enormous benefits as well as fulfilling Brett's keen interest in vast data analysis. Brett’s believes that through utilising big-data analysis, we are capable of generating new and insightful observations that may contributing to the solutions for the big challenges facing humanity, such as Climate Change.![]()
Taylor Wass
With his background in Biomedical Science, studying Biotechnology and Genetics at UQ, Taylor Wass has a particular desire to see the C4Derpillar provide affordable and accessible point-of-care diagnostic tools that may be deployed to remote parts of Australia and the world. Having traversed a number of fields in Biomed before settling on his current majors, Taylor has developed a comprehensive knowledge of Chemistry; particularly poignant for this project, he has a breadth of understanding of separation, that will allow us to adapt the system to detect a variety of sample types. Taylor has also worked with Brett to develop the data handling system to put the network in the cloud.
As we enter a new era of biotechnology, he believes we need to give the public tools to reliably gather this information, as around the world the growing challenges of biosecurity and food safety remain an every-day fact of life.
“I want users to be able to perform accurate genetic analyses at home. This doesn’t mean creating a three-eyed fish, it means doing things like checking if meat is spoiled with parasites before you eat it, or if the corn you bought from the organic supermarket contains any GMO genes.”
![]()
-
System Design Document - Sequential Injection Analysis System
09/21/2015 at 18:32 • 0 commentsTl;dr
- What is Sequential Injection Analysis (SIA)?
- Our implementation of SIA
- Design constraints of automated sampling
- Description of the plumbing of C4Derpillar
A key component of any analysis protocol is preparing the sample a user wants to analyse within the constraints of the instrument they are using. In the case of an autonomously-operating field-based analysis system (like the C4Derpillar), we have many unique considerations for the design of this system.
The C4Derpillar utilises a technique called Sequential Injection Analysis. Essentially it’s a fancy way of saying that we are running multiple samples through the machine without requiring a user to intervene or the machine to be reset. This is achieved by filling a sample reservoir from the user (in the case of fixed operation) or from the environment through a peristaltic pump and then pumping it through the separation system.
A typical analysis run would start by ‘cleansing’ the system with dilute sodium hydroxide. This serves a dual purpose of washing away residue left over from previous runs and ensuring that the capillary tube walls are fully ionised.
Once the sample is introduced into the system, we need to mix it with separation buffer so that it can be properly detected by the C4D detector. Another requirement of Sequential Injection Analysis is that we have a constantly flowing ‘stream’ that the sample is introduced into as a ‘plug’. This stream is then directed through the capillary tubes, where separation and detection is achieved. In our design the sample is enclosed by the same separation buffer used to dilute the sample, saving us a lot of hassle!
After a run, we want to refill the system with dilute sodium hydroxide. This is to ensure that any nasties are washed away and that the capillary tube does not dry out between uses (“if it dries, it dies”).
![]()
While SIA sounds simple in theory, we are analysing small total volumes (in the microlitre range) once the sample stream is introduced into the capillary tube separation system. This means that even minute fluctuations in the injection process will cause a high amount of relative error in readings. If we want to do quantitative work (where we measure the amount of a chemical, rather than just identifying it as you would with a spectrometer like the RamanPi), it is clear that a strategy to introduce a known amount of sample with high precision and repeatability is vital to the success of the endeavour.
Usually, commercial automated instruments would feature some form of flow selection manifold system that could be used to select between the various liquids we want to mix together (separation buffer, sample, optional chemical modifiers). Unfortunately, these systems are either VERY expensive ($100s) or rely on compressed air for precise actuation of the liquid - something you won’t find in a remote African village.
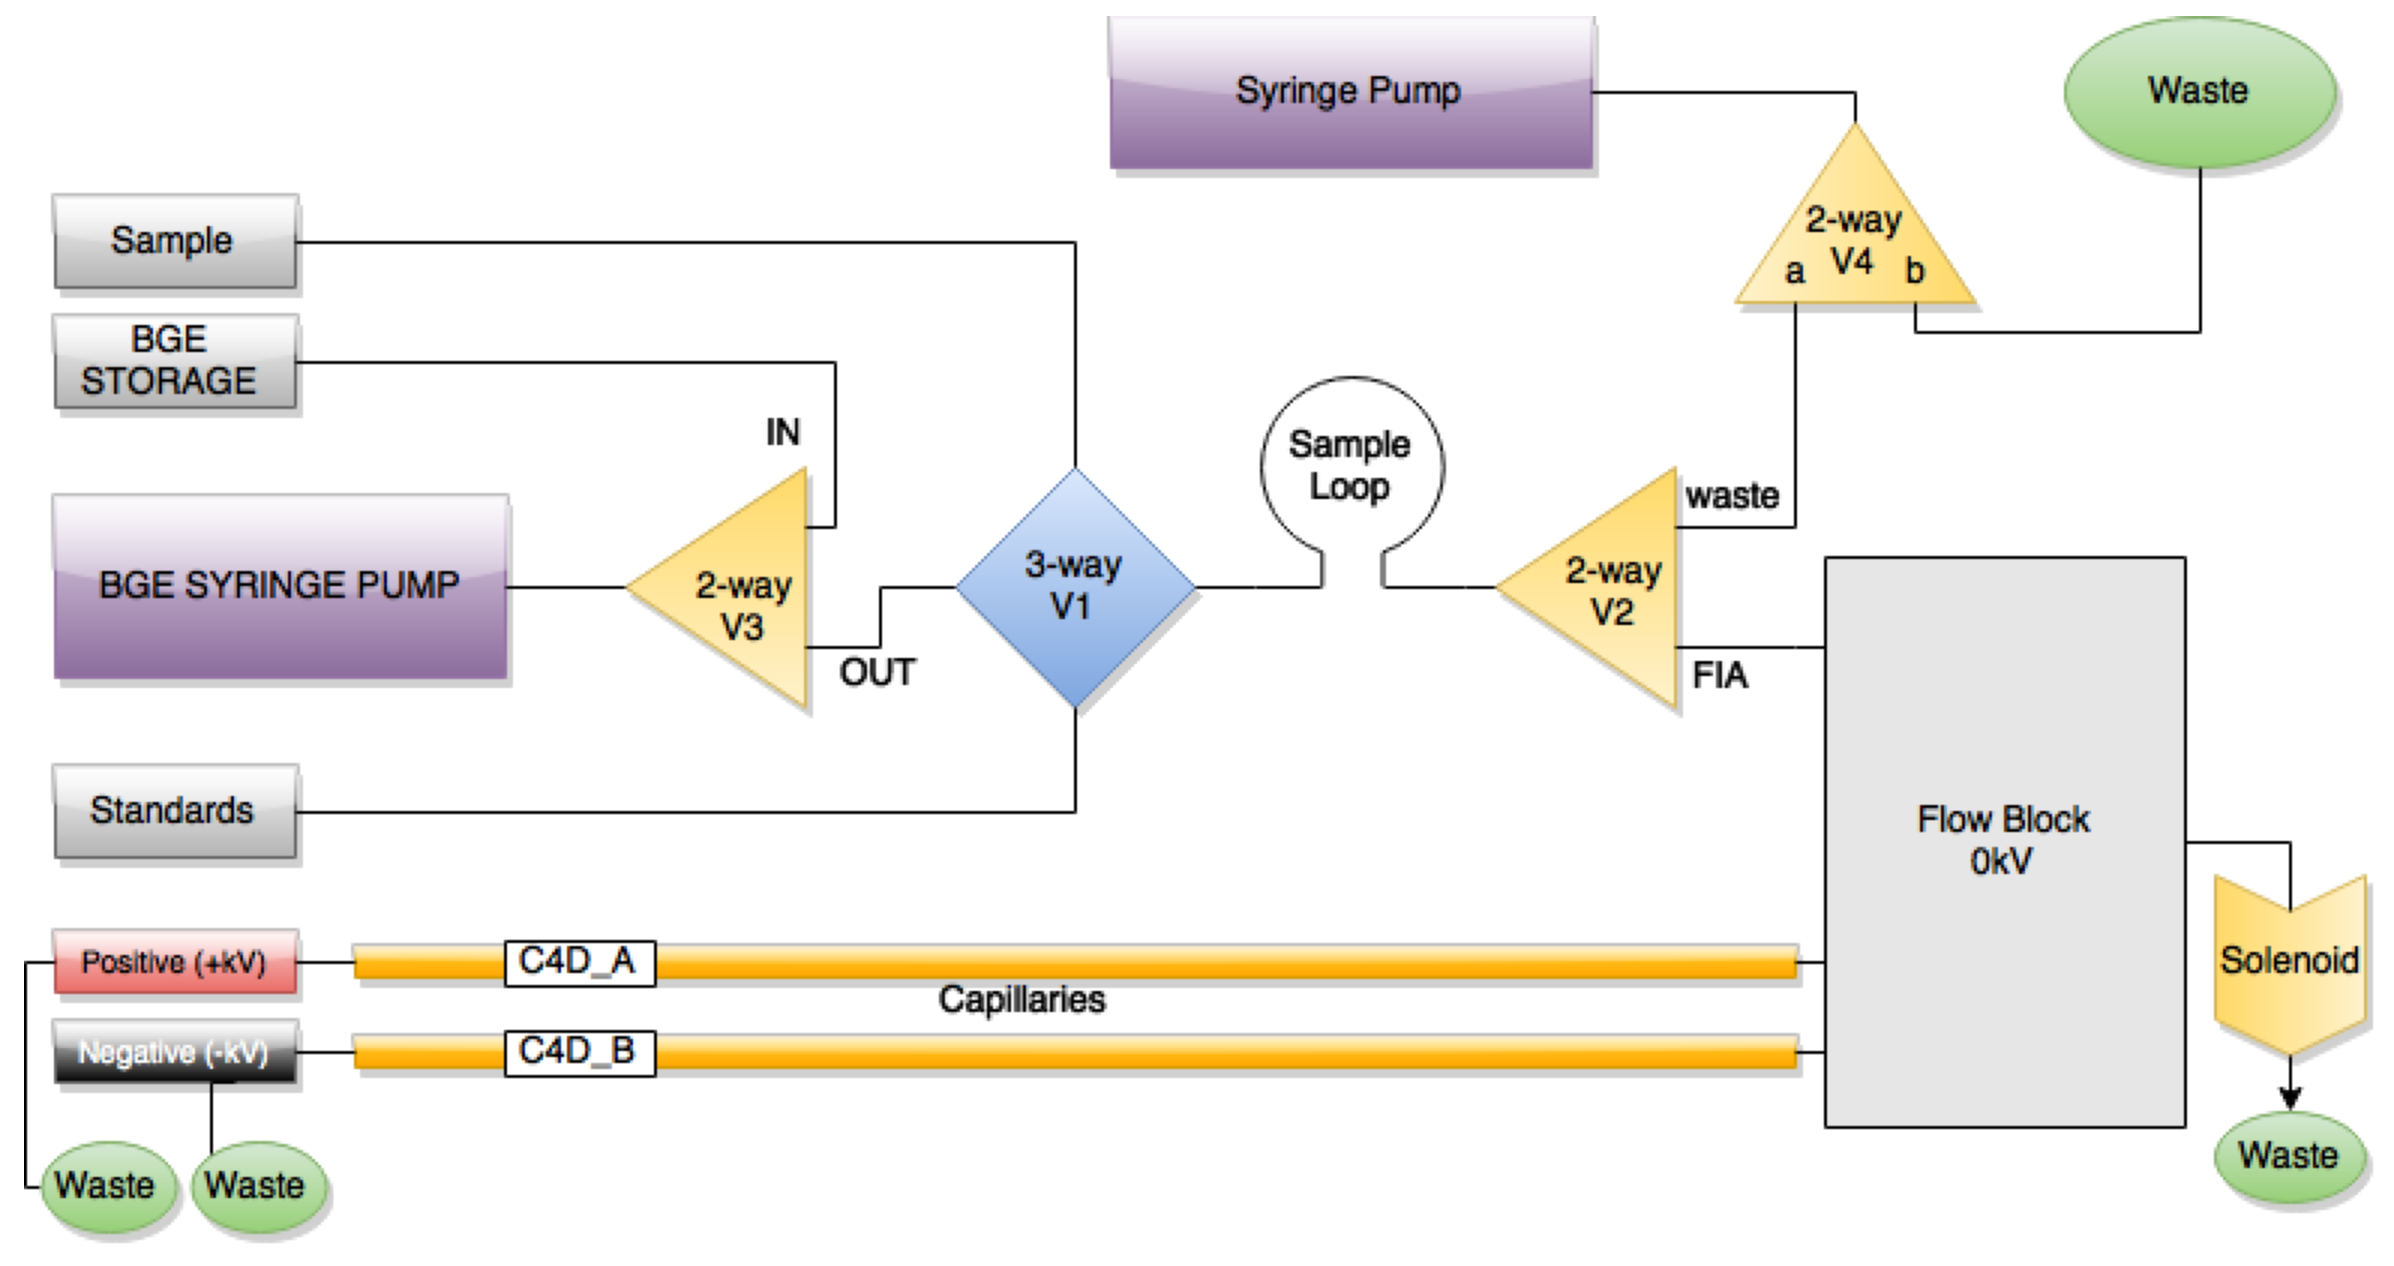
We have overcome this issue by using a plumbing system that features a combination of three-way and two-way valves, solenoids and syringe pumps. The valves and solenoids are in a configuration so that they are functionally equivalent to a flow selection manifold. doctek's Simple Syringe Pump provides a resolution of approximately 0.5uL per step of a NEMA 17 stepper motor. As stepper motors produce inherently repeatable actuation across a range of speeds, syringe pumps are ideal for fluid transfer in our device, requiring only a simple 5V signal and a controller.
By having this known amount of sample introduced in every analysis run, we can use standard solutions of known concentration and construct a linear calibration curve to use the C4D detector response to measure chemicals at unknown concentrations. The academic literature reports C4D detectors to have high linearity, usually over several orders of magnitude, meaning that the detector responds faithfully over a large range of ionic concentrations. This increases the versatility of the instrument in that it can accept a broader range of samples without requiring a pre-treatment step by the user.
The next challenge is plumbing all of these bits together. We decided on using 1/16” OD PTFE tubing as it was compatible with the ¼-28 UNF PPS nuts used to interface with components. The component interface is watertight by virtue of a collapsible ferrule - a piece of material that compresses around the tube as the nut is tightened.
More information regarding this connection system can be found at the manufacturer's website:
http://www.vici.com/support/tn/tn505a.pdf
![]()
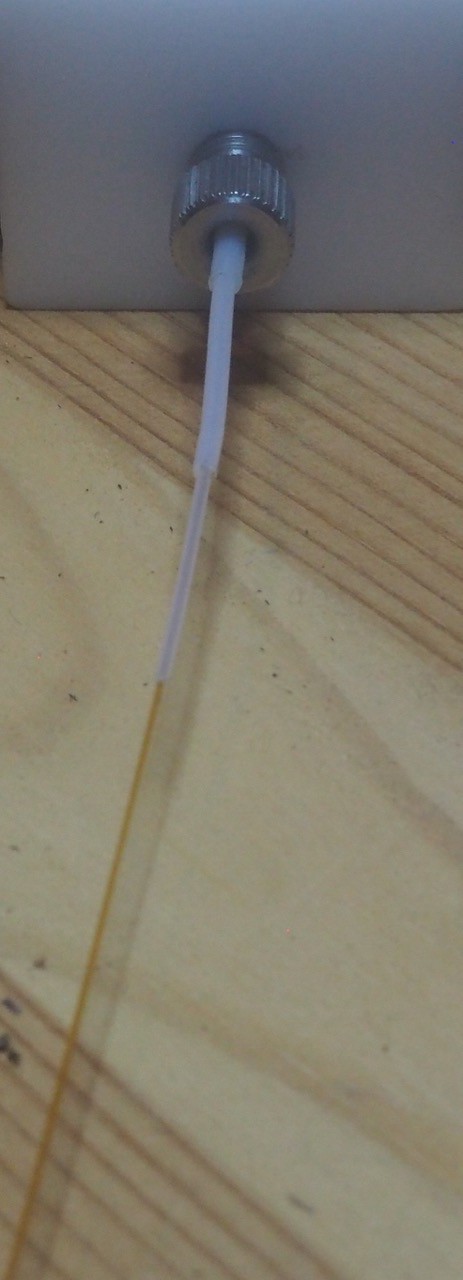
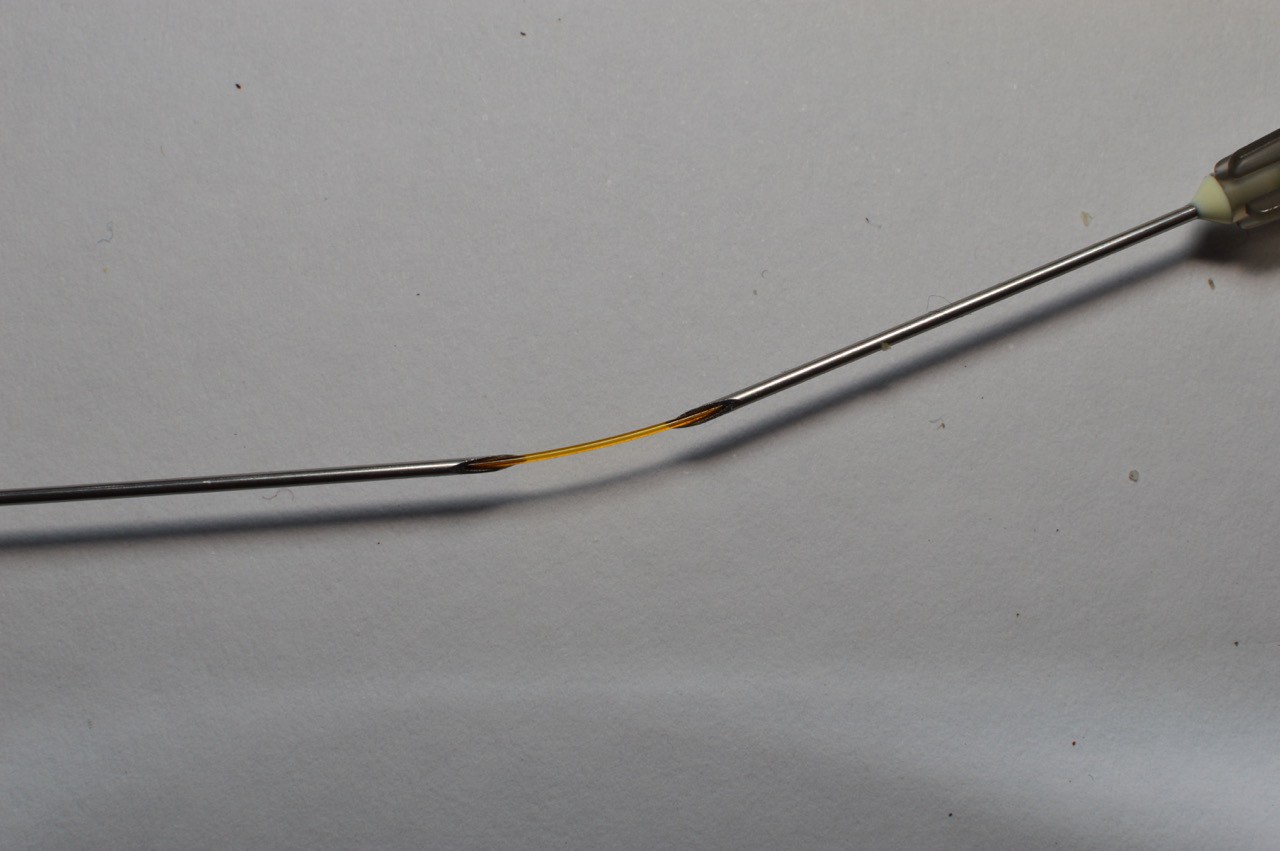
Another requirement of the separation system is that we have one HV DC electrode situated in the beginning of the sample ‘stream’ before it enters the capillary. As the majority of groups that use this type of plumbing gear are well-funded research institutions, our options were limited in this regard - with the nearest suitable product costing at least $100USD. In addition to this, interfacing 1/16” tubing to a 365um OD capillary tube is also an expensive exercise, usually requiring a ‘reducing ferrule’. We overcame this on the cheap by using a tiered sleeving system, where the 365um OD capillary is sleeved by 400um ID/900um OD and then 900um ID/1500um OD tubing, which works with the ¼-28 UNF nuts.
![]()
As these blocks are essentially I and T pieces with a ¼-28 UNF thread, 3D printing seemed like a viable option. We sat down for an afternoon in 123D Design and came up with the following designs; the STL files can be found on our GitHub page, but please note these are a very early design as we work out ways of ensuring the printed product is watertight such as acetone vapour bathing. Having no prior experience in tapping threads, we decided upon making the cylinder diameter 95% of the ¼-28 UNF tapping drill minor diameter. The hole connecting the interfaces in both models is 1mm x 1mm. The electrode is passed into the system by sleeving it , bringing it to the final 1/16” tubing size of the nut.
Electrode/1/4"-28 Nut adapter.![]()
Electrode adapter plugged into a 3-way valve.![]()
Stay tuned for a post on how we control all these systems with an Arduino! In the meantime, here are some preliminary logic states required to conduct a separation, which will help us when designing the code.
![]()
-
Detector System Design Document
09/13/2015 at 12:06 • 2 commentsTl;dr
- C4D detector system design document
- Review of state-of-the-art in C4D detection
- Our improvements upon current designs
As ions are brought into the capillary tube by the separation voltage, they move as distinct bands. The detector system lets the C4Derpillar ‘see’ and measure these bands, enabling us to identify and measure dissolved chemicals. This post aims to serve as a system design document for the C4E detector and show the engineering process taken to achieve our prototype design. For information regarding the physical phenomena behind C4D, please look at Project Log: Conductivity Detection C4D.
Functional units of the detector
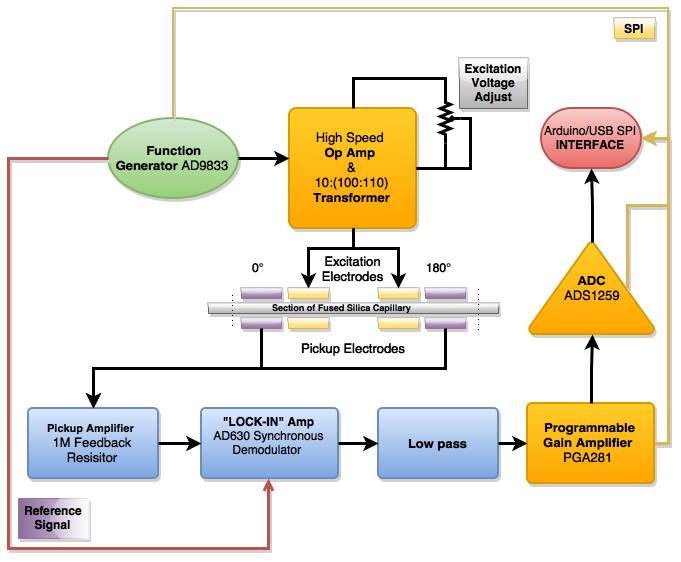
A sine wave excitation signal is generated by the function generator and amplified to several hundred volts. From here the signal travels through the detection cell and is combined with the signal from the reference cell, positioned such that it is only ever measuring the conductivity of the separation buffer. The phase cancelled signal is rectified and attenuated for detection by an ADC and subsequent data processing. A typical C4D detector can be divided into several functional units, which are explained in detail below:
Excitation signal generator
The transmission signal is a vital component of our detection circuitry as the working parameters allow for calibration of the platform for optimal detection sensitivity (Signal-Noise Ratio - SNR). C4D detection operates with an AC sine wave signal at a minimum of tens of kHz to ~10MHz. This is because the signal must be at a sufficient frequency to overcome the minimum working frequency of the system but also within a range to avoid the excitation and detection electrodes becoming coupled so that the sample no longer affects the conductivity reading. As the excitation frequency of the system is increased, heightened sensitivity is typically observed until a point where stray capacitance becomes an issue.
In the literature a wide variety of excitation signals are used, ranging from 1-200Vp-p at frequencies spanning 20kHz to 10MHz. The research group of Peter Hauser has pioneered using a high voltage source (up to 350V) at a relatively high frequency (200kHz), which was found to offer unique advantages for enhancing the signal-noise ratio (Kuban, et. al, 2006). This is presumably due to the large amplitude of the signal masking any small fluctuations introduced by the environment. Based on his group’s research, we have selected componentry that will be capable of generating a 1kHz-10MHz sine wave at ~16-240Vp-p.
As the SNR depends heavily upon the excitation frequency and voltage, being able to dynamically optimise these parameters is desirable. Second generation devices, featured the ability to adjust the operating frequency and voltage of the system, however the user is still required to reflow passive SMD components on the circuit board and perform electrical calculations; a hurdle that would prevent novices from achieving this end.
In our design, signal is generated by an Analogue Devices AD9833 SPI function generator, which produces a sine, square or triangle 0.6Vp-p signal from 0.1Hz–12.5MHz with 0.1Hz resolution. A two-stage op-amp system is used to amplify the excitation signal from 0.5–15Vp-p. This is achieved by using a fixed 20x multiplier op-amp in tandem with a selectable (0.1 – 1.5x) attenuating op-amp, controlled by an Analogue Devices AD5280 I2C digital potentiometer with 256 wiper steps. This staged gain system was required in order to keep us within the gain-bandwidth product specifications of the Analogue AD829 and AD818 op-amps. In this design the pre-transformer signal is limited to 15Vp-p, which is the digital pot terminal voltage maximum working parameter. There are chips on the market with higher terminal voltages but for the moment 15V is right where we want to be, giving us a final working voltage range of ~16–240Vp-p when used in conjunction with our Coilcraft 1:16 wideband RF transformer.
Being able to adjust the excitation parameters on-the-fly is a significant advance from current designs because it lets the system do things like auto-calibrate for maximum sensitivity. This is a vital feature if we want to ensure reproducibility of results across devices, as the optimal excitation voltage and frequency will be unique to each system due to variation in the construction process and detector geometry. This improvement is in line with our design principles in that we want to make the device accessible to as many non-technical users as possible while at the same time providing a highly informative analysis.
Apart from making the device easier to use, we want to push the capabilities of our system to the limit and explore interesting things like sweeping the excitation frequency, which we think could provide a novel and simple way of separating superimposed detector peaks.
A further limiting factor in existing detector designs was the use of the N87 transformer core, with core permeability from 25kHz to 500kHz [datasheet]. This means that designs using the N87 core are incapable of exceeding this limit as the excitation signal cannot be transmitted. The transformer we are using has a bandwidth from 0.1-90MHz. This is perfect for our system as the minimum working frequency is CE-C4D systems is usually ~20kHz and the range limit of the excitation signal frequency is from 10kHz-5MHz before capacitive coupling is an issue. If you want to read more about optimising the excitation signal, a wealth of information can be found in the PhD thesis of Pavel Kuban [open access link].
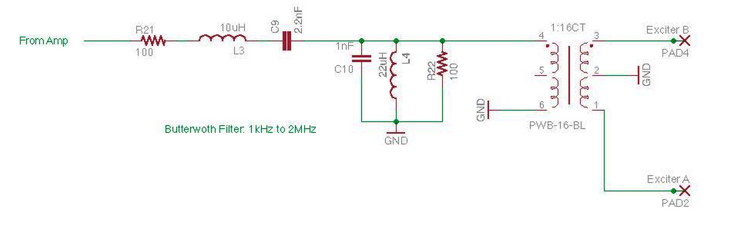
The schematic for the exciter module can be found below:
Excitation signal generation/amplification:
Wideband RF transformer, producing two out-of-phase signals for the detection and reference cells:
Electrode configuration
Traditional C4D detection cells consist of a fabricated single electrode pair, featuring a working electrode and a detector separated by a Faraday shield to prevent direct coupling between the electrodes. This design presented many advantages over traditional contact-based conductivity detection methods. Development of this concept was continued by Zemann, et. al (1998), who used low-cost stainless steel syringes sleeving the capillary (shown below). This design gave a cheap and simple detector that has the unique capability of being mobile along the capillary; letting users alter the effective separation length and adjust the time it takes for a run to complete. Sometimes users will only want to detect one or two ions, requiring only a small run length in the capillary to achieve effective separation. Reducing the run length significantly speeds up the analysis time by trading it for resolution, giving users the freedom to customise the device to suit their application.
Example of the electrode configuration of Zemann, et. al. (1998). The 375μm OD capillary is sleeved with a 400μm ID stainless steel syringe.
![]()
One disadvantage of using a single detection cell is that any signal processing requires the introduction of an offset to account for the conductivity of the separation buffer. As the temperature and buffer composition can change through the course of an experiment, dynamically accounting for this value becomes difficult, introducing random error over the run.
This issue was solved with the introduction of the Hauser group’s referenced C4D detector (Stojkovic, Schlensky and Hauser, 2013). The design features a second electrode pair which is situated so that it is exclusively measuring the conductivity of the separation buffer. The signal from this detector is combined with the one from the working electrode pair such that the separation buffer signal is removed by phase cancellation. Our Coilcraft transformer allows easy production of a 180 degree out-of-phase signal through a third tap. By providing this ‘reference’, it is possible to negate using a signal offset while at the same time dynamically account for intra-experimental environmental variation.
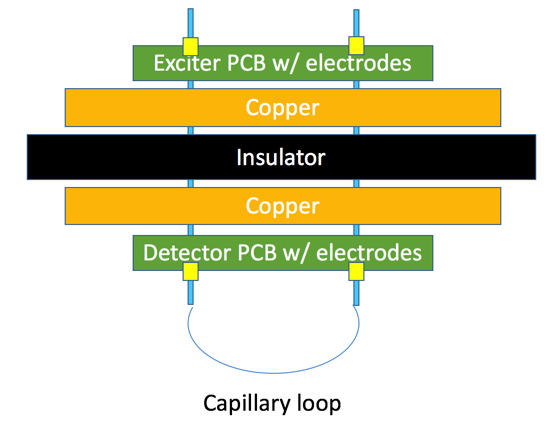
In order to have one cell constantly monitoring BGE, a design is used where the capillary loops through a ‘PCB sandwich’, which features the detector circuitry and layers of insulated copper clad that serve as the Faraday shield between PCB-mounted electrodes. Each layer of copper will be grounded to the detector box, serving to funnel stray capacitance away from the detection electrodes.
Signal processing
The phase-cancelled signal is then amplified by a pickup amplifier in the I to V configuration (transimpedance) and passed to an AD630 synchronous demodulator, also known as a lock-in amplifier. Early designs would instead feature a rectification step; however, this is not considered optimal as the lack of bandwidth restriction in the amplified signal increases electronic shot noise, decreasing the sensitivity of our reading.
One bandwidth reduction strategy explored in the literature was that of Kang, et. al (2008), which featured a piezoelectric resonator selectively allowing reception of the excitation signal. This was found to reduce noise in the system. While the researchers did get improved resolution, it was difficult to implement this system in line with our design principles, as users would find it difficult to adjust the excitation frequency. Fortunately, we can use another approach called synchronous demodulation by using the Analogue AD630.
Synchronous demodulation functions somewhat similarly to rectifying a bandpassed signal, where the amplitude of only a narrow spectrum of the signal is measured. This approach overcomes the difficulty of high precision filters by using the unamplified signal from the function generator as a reference and only demodulating the component of the attenuated signal in-phase with the transmission signal. After this, the demodulated signal (now DC) is stripped of any lingering AC signal using an active low pass filter and brought within range of the ADC by a TI PGA280 programmable gain amplifier. The Hauser Group was the first to establish using the AD630 in laboratory C4D instruments, finding that it substantially simplified the detector circuitry while at the same time increasing the quality of the output signal.
Sounds good! A comparison of the signal processing stages of traditional instruments vs. ours is below:
C4Derpillar:
Traditional instruments:
A schematic of our signal processing module can be found below:
Pickup amplifier and synchronous demodulator passing a demodulated signal to the ADC:
Programmable gain amplifier circuit which brings the signal within specification of the ADC:
Signal digitisation
For signal digitisation, most groups take advantage of commercial DAQ units, which are routinely accessible in university laboratories (such as the EDAQ or many Native Instrument products). Unfortunately, for normal users, the units are prohibitively expensive, costing several thousand dollars. This didn’t make sense to us as the majority of commercial units do not have remarkable specifications and are quite bulky, requiring mains power to operate. Obviously, this issue would be a huge roadblock to the average user trying to record things in the field. We have overcome this constraint in our design by taking advantage of the Linear LTC2440 24-bit 3.5kSPS SPI ADC. The LTC2440 costs ~$4 and has terrific documentation for Arduino with example code written by the company (see Linduino). Sampling at 24-bit/3.5kSPS will give us superior resolution to the 21-bit/20SPS maximum reported in the academic literature and the 18-bits/1kSPS offered by commercial units such as the EDAQ (Francisco, do Lago and Lucio, 2009). In our testing phase we aim to determine the optimal sample rate, and if there is any reason to sample at resolutions greater than 1kSPS.
We have also made a significant improvement by housing the signal generation and processing/ADC in a combined module that is designed to fit over the capillary tube, rather than using a large standalone unit. This autonomy reduces the complexity end users have to deal with, while at the same time substantially enhancing the portability of the detector. Our plan is to connect each detector (one each for anions and cations) to a Teensy 3.1, which has more than enough power to read two 24-bit ADCs and write to a SD card/serial simultaneously, while maintaining the device’s backend. The detector design is also modular in that tubing other than capillaries could be used simply by modifying the hole diameter in the design file.
By combining the described technical advances from the semiconductor industry with the referenced detector of the Hauser Group, our detector represents a culmination of the cutting-edge in C4D detection. The placement of a C4D detector directly into the hands of the public for such a low cost is something our team is VERY passionate about, because it empowers people with the ability to analyse virtually any aspect of their life with better precision than laboratory grade instruments. This will lead to society as a whole being more informed about the chemical forces that govern our life, from toxic heavy metals to beneficial flavonoids in food. In order to do this, we are developing a robust, social data analysis platform, which will be described in detail in future posts.References
Stojkovic, M., Schlensky, B. and Hauser, P. (2013). Referenced Capacitively Coupled Conductivity Detector for Capillary Electrophoresis. Electroanalysis, 25(12), pp.2645-2650. [open access]
-
Separation chemistry
08/17/2015 at 17:37 • 0 commentstl;dr
- Samples must be dissolved in a separation buffer, which contains 3 primary components dissolved in water.
- Background electrolyte provides stable reference signal for the conductivity detector and does not migrate in an electric field.
- pH buffer resists changes in pH driven by the electrolysis of water at the anode and cathode.
- Chemical modifiers bind to specific analytes, allowing superimposed bands to be resolved.
- Electroosmotic flow is of concern when analysing anions, and can be modulated with cationic surfactants
When a sample is introduced into the analysis system, it is usually mixed with a separation (or run) buffer. An ideal buffer needs to perform the following functions:
- Maintain solution pH at a level that ionises (gives charge to) analytes of interest.
- Be weakly conductive to facilitate current flow between the electrodes but limit Joule heating within the capillary.
- Provide a stable baseline signal to the detector over the course of a run.
- Facilitate effective separation of analytes of interest.
These ends can be achieved through the addition of a background electrolyte (BGE), pH buffering agents and optional chemical modifiers.
Background electrolyte (BGE)
As explained in Project log: What is Capillary Electrophoresis, capillary electrophoresis separates ions by differences in their migration speed through an electric field. Bands of ions are detected as they cross a wireless conductivity detector at different times.
In order to minimise interference due to stray capacitance and impurities, a background electrolyte (BGE) is usually included in the separation buffer. BGEs are usually weakly conductive and serve to provide a stable reference signal for the detector. An ideal BGE is an ampholyte [wiki] – a molecule that can contain negative and positive charges, depending on the pH. Histidine is commonly used as a BGE in capillary electrophoresis as it exists as a zwitterion (a form having equal positive and negative charges) at the pHs used in most electrophoresis protocols. This prevents it from being affected by the applied electric field, maintaining a uniform distribution of BGE throughout the capillaries over the run.
Histidine is a relatively safe chemical that can be purchased at low cost, making ideal as a BGE in our system. 250g can be purchased for USD $40, enough for thousands of runs.
Histidine can be purchased from here:
pH buffer
As electricity is being applied to the water, reactions at the anode and cathodes will generate hydroxyl (OH⁻) and hydronium (H₃O⁺) ions. The local build-up of these species creates zones of varying pH within the electrolyte. This phenomena significantly affects the reproducibility of readings in capillary electrophoresis and as such, a pH buffering agent [wiki] is usually included in the sample buffer. Buffers are able to resist the addition of acid or base and maintain the solution at a constant pH. MES finds use in the majority of electrophoresis publications as a pH buffer for a few reasons. It is also readily available and inexpensive – perfect for us! Using MES as the pH buffer will allow us to adjust the pH from around 5.15 to 7.15.
MES can be purchased from here:
Chemical Modifiers (optional)
Sometimes two ions may have similar electrophoretic mobilities, which means that they will migrate down the capillary at very similar speeds. If the length of the capillary is not sufficient, these bands will not separate (resolve), giving a superimposed peak on the detector. It is impossible to identify and quantify analytes of interest if they are part of a superimposed peak, therefore chemical modifiers are sometimes introduced into a separation buffer. Modifiers bind to their targets, usually a particular class of chemical (monovalent cations, or divalent heavy metals, for example) and alter their electrophoretic mobility by affecting the molecule’s mass/charge ratio and surface area.
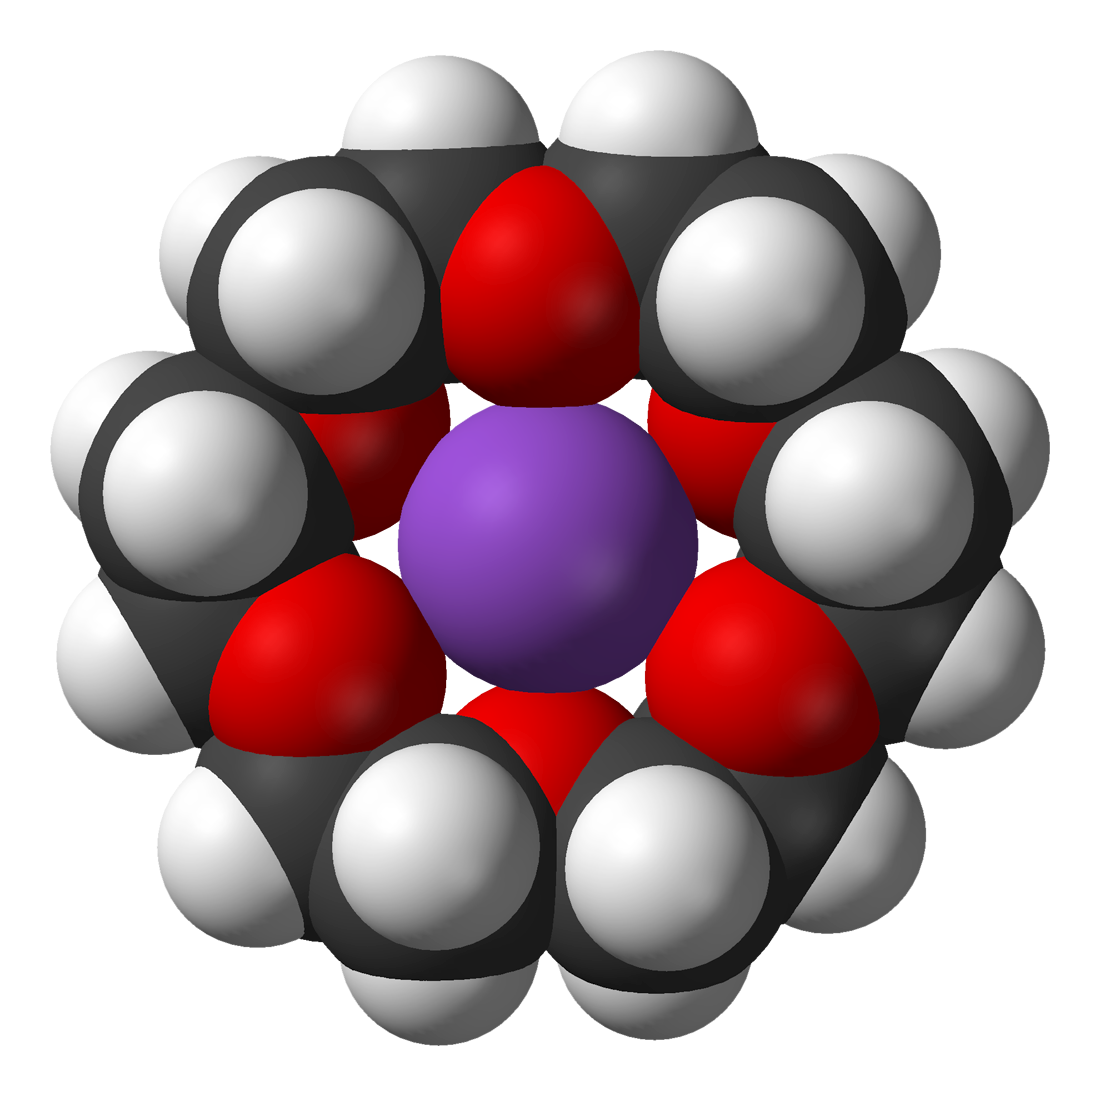
A common example of using chemical modifiers in the literature is the separation of potassium (K⁺) and ammonium (NH4⁺) ions. These ions are both important water quality parameters but in the MES/His buffer system commonly employed, the peaks for these two ions co-migrate. By add. 18-crown-6 ether is added, which attaches to the ions, altering their electrophoretic mobilities and enabling resolution of the independent peaks.
More information about this process can be found at the following link:
http://sydney.edu.au/science/biology/warren/docs/ce_cations.pdf
18-crown-6 ether binding to a potassium atom, substantially altering its size, which affects its migration speed in an electric field.
The choice of chemical modifier depends on the class of analytes being investigated. Thankfully, most agents employed as modifiers, such as crown ethers (18-crown-6) and EDTA are readily available online:
Examples of other buffer systems
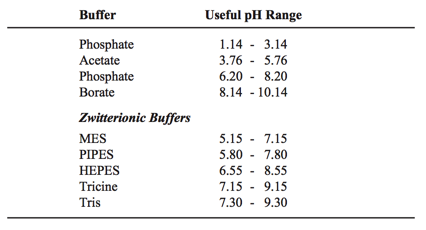
The following table is an except from Beckman Coulter’s Introduction to Capillary Electrophoresis, which lists a variety of alternative pH buffering agents, which can be used if a pH outside the useful pH range of MES is desired.
If the experiment pH is outside the pH range that histidine (the BGE) exists as a zwitterion, it is necessary to change it to a chemical that is able to exhibit this feature. A comprehensive study of BGEs can be found at the following link for those interested in further reading:
Optimization of background electrolytes for capillary electrophoresis: II. Computer simulation and comparison with experiments
As the MES/His system is in widespread use, we do not see any immediate circumstances that would require the use of alternative buffers, but when our platform is released to the community we will make these reagents available and easy to use should the need arise. Ideally, this would take the form of an online expert system, where users could order pre-measured sachets of various separation buffers.
-
What is capillary electrophoresis (CE)?
08/16/2015 at 06:32 • 0 commentstl;dr
- Conventional water monitoring systems do not provide meaningful information for environmental monitoring and citizen science applications.
- This is because samples usually contain many ions and the sensor cannot ‘see’ ions individually to measure them.
- A separation procedure can be used with our wireless conductivity detector to measure ions individually.
- Capillary electrophoresis (CE) separates ions based on differences in their electrophoretic mobilities.
- CE is a simple technique that has been in use for decades and simple protocols are available in the literature for most analytes of interest.
The C⁴D detector used in our design detects the conductivity of almost all dissolved substances, which is used to infer the total dissolved ion concentration. This technique is commonly implemented in applications that only require knowledge of the total dissolved solids [wiki] (referred to as TDS or ‘ppm’) in a solution, such as in hydroponics, where a user is primarily concerned with aggregate nutrient thresholds for plant growth. When testing the quality of a water supply, we are interested in the levels of particular pollutants that are harmful at small levels, like arsenic. The maximum safe level of arsenic in a water supply is considered to be ~10 μg/L. The traditional TDS-based approach can barely detect a noticeable change in total ion concentration at these levels, let alone single-out arsenic from the jumble of dissolved ions – making TDS measurements functionally useless for most environmental monitoring applications.
Effective detection of specific analytes (arsenic, mercury, pesticides, etc) is best achieved through separation of the sample into its chemical constituents, allowing them to be identified and quantified individually by a single system (the C⁴D detector).
Separation techniques
Separation techniques are not new and usually rely upon variations in a physical property among the ions of a solution. The separation procedure employed in this build is capillary electrophoresis (CE) [wiki]. CE sorts chemicals by differences in electrophoretic mobility, a property unique to each molecule. This is accomplished by drawing the sample into a very thin (10-100μm) ID capillary tube and subjecting it to high voltage (2-30kV) DC. The capillary serves to create an environment with a high surface area/volume ratio, allowing more interactions that facilitate the separation to take place. Separation occurs to a point where ions migrate in independent ‘bands’ sequentially past a stationary detector, enabling them to be identified and measured.
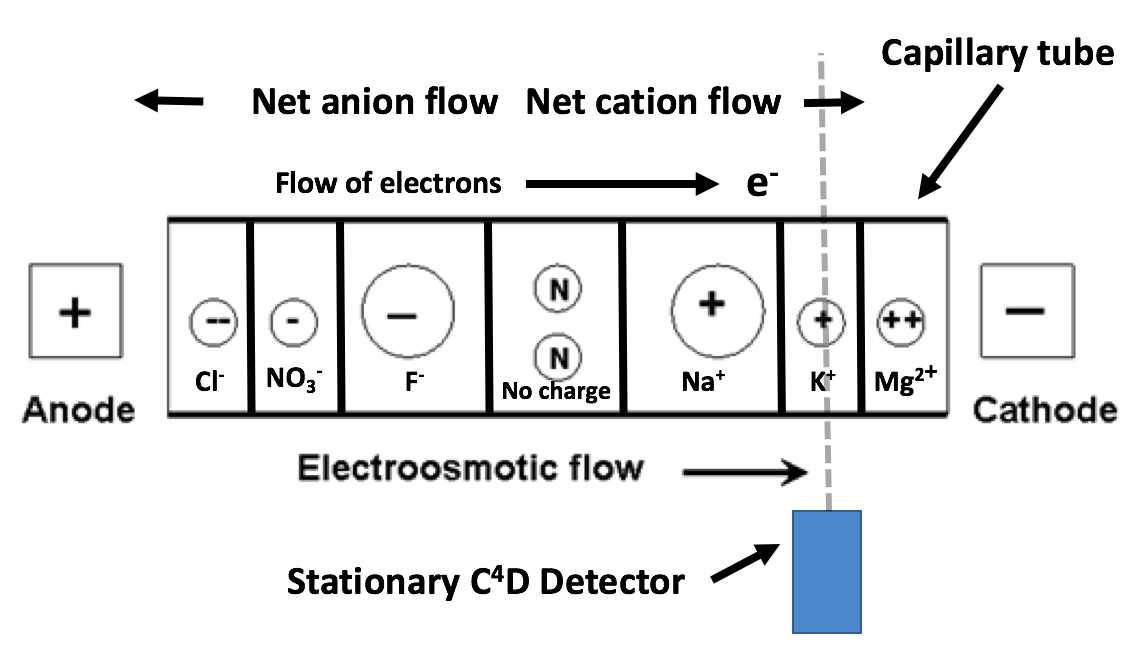
![]()
Adopted from: http://theses.ulaval.ca/archimede/fichiers/24330/apa.html
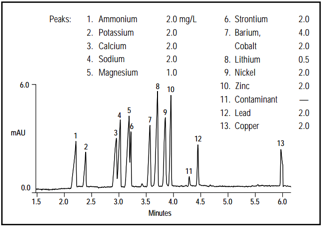
The above image represents the expected migration order of ions inside a capillary when it is exposed to an electric field. Note that small, highly charged ions migrate to the electrodes at a higher rate than larger ions with less charge. Anions migrate toward the anode, while cations migrate towards the cathode.The signal intensity of the C⁴D detector enclosing the capillary tube can be charted over time to identify and measure the concentrations of individual ions with high repeatability and precision. This can be represented on a graph as an electropherogram. Each peak represents an analyte passing the detector and its magnitude is proportional to the concentration of each substance. Peaks are assigned to a particular analyte by comparing readings to a separation conducted on a standard solution of known constitution. An example electropherogram is shown below:
Source: http://www.dionex.com/en-us/webdocs/4234-an91.pdf
So what is actually making this happen in there? As with standard spherical particles, the velocity of charged ions moving in an electric field is the proportional to of the electrokinetic energy introduced to the particleFEK by the electric field E and the particle’s drag Fd in a viscous solution (Stoke’s law).
In the case of capillary electrophoresis, an ion’s total electrophoretic velocity v is described by the following relationship:
Where:
q is the charge of the ion.
η is the viscosity of the solvent (usually water).
R is the radius of the ion.
As these physical attributes are unique to each ion, we can expect that some charged particles will migrate through the electric field quicker than others. Because of this, the particles will pass the stationary detector, positioned at a fixed distance, at varying times. You could think of this like drawing a line of a piece of paper and using it to separate ink. Each dye in the ink moves up the paper at different rates due to inherent differences in the strength of interaction with the charged paper surface. In our case, the ‘paper’ is a capillary tube in an electric field and the ‘line’ is the stationary C⁴D detector. The picture below shows the banding produced by applying an electric field to food dye dissolved in water. We can see that this method provides a robust separation of the components of the dye, which are observed as distinct coloured bands.
Source: http://openwetware.org/wiki/DIYbio:Notebook/Keiki_Gels -
Conductivity Detection: C⁴D
08/13/2015 at 13:46 • 1 commentCapacitively Coupled Contactless Conductivity Detection C⁴D
tl;dr
- Electrolytic conductivity can measure the dissolved contents of a solution
- Combined with Capillary Electrophoresis (CE) individual ions can be detected
- Contact with the solution hindered the development of conductivity detection based CE
- The expense and inherent limitations of light-based (UV) detection is prohibitive for amateurs
- Capacitively-Coupled Contactless Conductivity Detection (C⁴D) provides a simple, low-cost detection method
- Our implementation of C⁴D
The detection technique we have chosen for this project is based on the measurement of Electrolytic Conductivity [wiki], which is a solution's ability to conduct electricity. This measure contains highly valuable information on the contents of a solution as its conductivity is proportional to the sum of the Total Dissolved Solids (TDS) [wiki]. Measurement of TDS is typically used as an aggregate indicator of chemical contaminants in the study of water quality, particularly relating to agricultural runoff and industrial pollution. Our system utilises this principle in combination with a separation technique to detect specific substances within the TDS. We apply a technique called Capillary Electrophoresis (CE) [wiki] which separates the solution into a series of ionic bands that migrate past a stationary detector at varying times, allowing for individual substances to be identified and quantified.
Conductivity detection has been employed in CE and chromatography for some time however the initial iterations employed a contact-based approach, typically a fixed eC/TDS probe, which came into direct contact with the solution. While this technique is highly sensitive the electrode is subject to degradation, this causes measurement drift due to heterogeneous oxidation of the electrode surface which diminishes the machine’s precision and operational lifespan.The full potential of the technology was realised with the introduction of contactless detection systems, which led to the development of the technology we have chosen: Capacitively-Coupled Contactless Conductivity Detection (C⁴D). C⁴D utilises the wall of the capillary as a dielectric to wirelessly transmit an electrical signal through the solution which is attenuated by the change in resistance due to the ion concentration.
The C⁴D technique allows for a much simpler transmission and receipt of the excitation signal over typical light (UV) and contact-based (TDS) detection, without expensive image sensors and complex capillary windows. The versatility of using C⁴D with the CE separated samples means that by manipulating only a few simple parameters of the system almost any substance can be identified and measured. This replicates the function of most Ion Specific Electrodes (ISEs) by utilising a separation technique to get the desired solute by itself, in place of specific electrodes for each solute. The relative simplicity of this technique makes it a highly versatile yet low-cost way to detect the presence of substances in a sample that is highly suited to automated sampling and reporting of water quality.
The measurement of electrolytic conductivity is achieved by measuring the resistance of the solution. Measuring the resistance involves passing an electrical signal through the solution and measuring the attenuation of the signal as different ions pass the electrodes. Contactless detection in a Capillary Electrophoresis (CE) systems couples electrodes to the capillary forming a picofarad capacitor, which requires a high frequency input signal to transmit current through the solution. As ions pass through the electrode the change in resistance of the solution R causes a change in the resultant current I=V/R. The current of the output signal is converted to a voltage by a transimpedance op-amp (current-voltage conversion) which is then synchronously demodulated into a DC voltage, cleaned of noise and sampled by an onboard ADC. The flowchart below describes the components and operation of our detection circuit.
-
Introduction to C4Dapillary - An open-source C4D-CE Platform
08/13/2015 at 07:17 • 0 commentsCapillary Electrophoresis (CE) using a Capacitively-Coupled Contactless Conductivity Detector (C⁴D).
tl;dr
- There are no accessible detection systems for taking automated measurements of water quality, particularly nutrient levels
- Enter Capillary Electrophoresis (CE), a simple and accurate technique for separating dissolved solids
- Overcoming the major challenges involved with detecting dissolved solids with Capacitively-Coupled Contactless Conductivity Detection (C⁴D)
- Realising the potential of an open-source C⁴D CE platform for a global community of water researchers
Our C⁴Dapillary project began with some hobbyist Aquaculture after discovering we couldn't find a product to autonomously monitor the nutrient levels in our systems. Aquaculture systems require careful and precise control of a range of nutrients. Although, in these natural systems, the levels of these nutrients tend to vary across the day – making manual techniques cumbersome and fraught with error. Research into detection systems failed to find any products meeting capable of reliable, automated measurement of a range of nutrients. Most available sensors only detect select compounds, which meant no alternatives existed outside expensive laboratory-grade equipment. Our strong background in science drove us to research other analytical techniques that could detect the presence of compounds. We uncovered a powerful technique called Capillary Electrophoresis (CE) which allowed for the repeatable detection of ions with different charges without the need for expensive, closed-source components. Unfortunately affordable (<USD$10k) commercial implementations of CE are relatively non-existent which drove the development of the C⁴Dapillary open-source CE platform. This project will focus on the detection of ions in water, given the vast potential for improving Humanity's quality of life, although the potential applications are innumerable.
Capillary Electrophoresis (CE) works by passing a high voltage current through a solution filling a micron-diameter glass capillary tube. The current passing across the charged ions causes them to migrate from one side of the tube to the other. This causes them to pass the detector at different times allowing them to be mapped onto a chart called an electrophoretogram. This technique was limited in its widespread application as it was often coupled with UV-based optical detectors which are prohibitive due to their expense. Conductivity based detectors offered a cheaper alternative but came into direct contact with the solution, degrading and bio-fouling over time causing spurious measurements. This project uses a detection system that negates the large costs of UV and other spectroscopy based CE implementations by using wireless detection of CE separated ions. This process is superior to Spectroscopy techniques as it removes interaction between ions, a large source of error in separated samples.
You can imagine this like dropping several different coins off the top of a tall enough building. If you stood on the ground you could determine each of them by the time when they hit the ground, with the lowest surface area to mass ratio first. The following GIF shows how the CE process works,
This illustrates the Capillary Electrophoresis (CE) technique using a detection system called Contactless Conductivity Capacitively Coupled Detection (C⁴D). C⁴D functions by applying a high-voltage electrical signal across the capillary and reading the signal as it is attenuated by the solution passing through the capillary. The attenuated signal is converted to a DC voltage signal with peaks as each ion passes through the sensor. As the different ions are separated through CE the time the ion passes the detector can be compared to a standard sample and the ion identified.
The Executive Director of the United Nations Environmental Programme states that the lack of resources for monitoring and assessment make it difficult to obtain a global picture of water quality. The application of the CE-C⁴D to the monitoring of compounds in drinking and sanitary water has the potential to address many of the issues in the resourcing of sustainable water management. The impact of widespread access to an affordable automated nutrient monitoring system is a paradigm shift from our current complicated and onerous measurement processes. Technology such as this in the hands of the average citizen empowers the population with knowledge of their water quality and, with simple cloud based technology, has potential to expand to a global community of water researchers.
From our research it is becoming increasing clear that the potential applications of CE-C⁴D are almost limitless. While nutrient monitoring is critical to human health it is also an important indicator in the health of other natural systems that are critical to human survival. A large proportion of the world relies heavily on seafood as a source of food, while significant research suggest our Ocean’s health is rapidly declining. A fleet of self-sustaining, marine drones equipped with our system could provide the consistent, repeatable and precisely timed measurement of nutrients required to effectively monitor and study the oceans health. The scientific confidence that such an intellectual resource could provide would inform intervention and prevention strategies for minimising harm to our oceans and ultimately the Earth.
We hope you see the same potential in our C⁴Dapillary open CE-C⁴D platform and upcoming water testing prototype. We're excited to be working on something that may just change the world and we look forward to hearing your thoughts as we progress.
C4Derpillar: Open CE-C⁴D
Open Capillary Electrophoresis platform utilising a Capacitively-Coupled Contactless Conductivity Detector geared for on-line water analysis


 Programmable gain amplifier circuit which brings the signal within specification of the ADC: