-
Implemented EMG
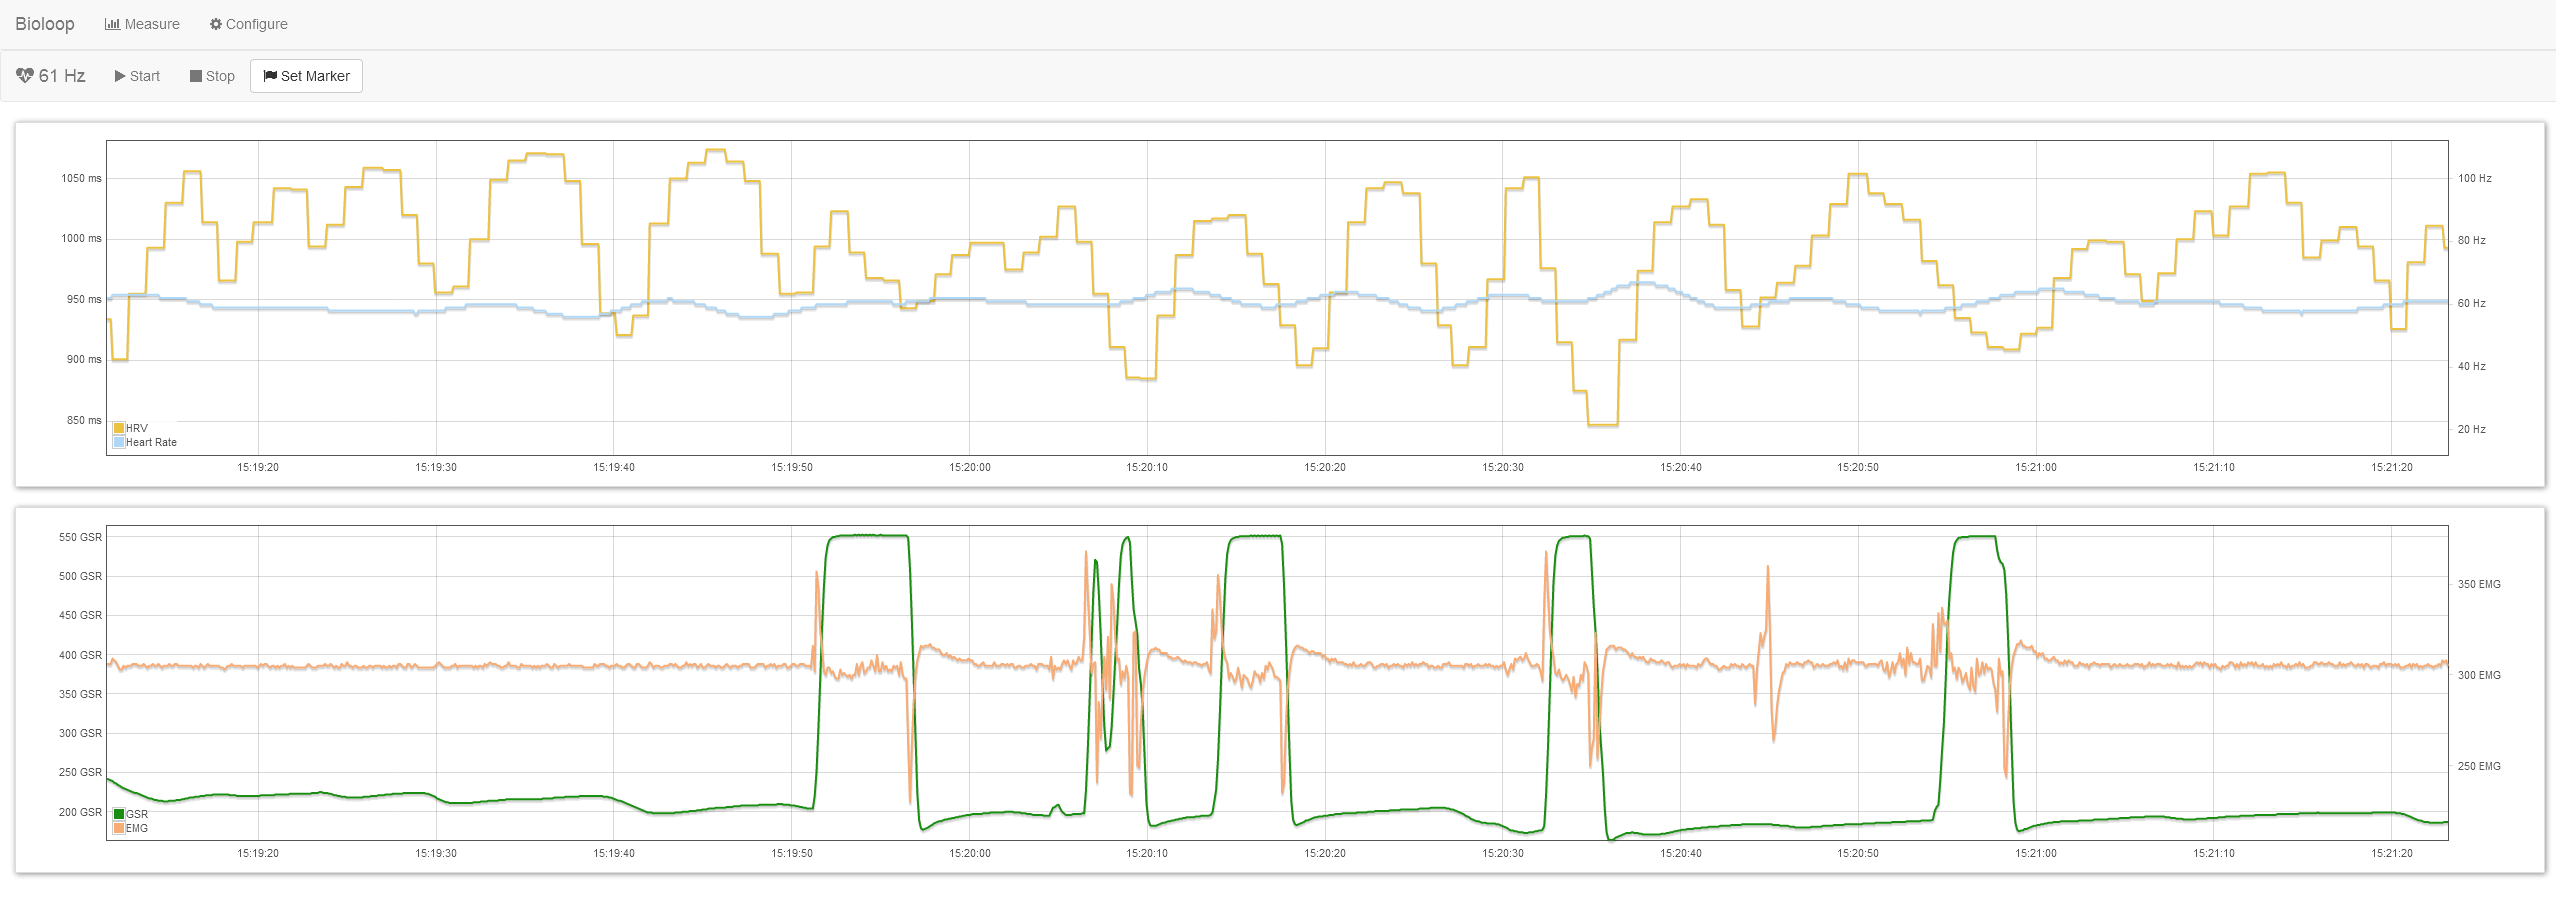
10/24/2015 at 13:32 • 0 commentsEMG capability is now available for project bioloop - together with an extended GUI (additional diagram):
![]()
The first diagram shows heart rate and heart rate variability (HRV), while the second one shows GSR and EMG. Unfortunately the used EMG sensor from Seeedstudio (Grove) is badly documented, so the results are not as significant as they should be (orange line). Furthermore, there seems to be an electrical interaction together with the GSR sensor (green line) when both sensors are attached to the same arm, for example.
If anyone else uses Grove EMG, too, and achieves better results, please let me know...
-
Improved Software
10/19/2015 at 11:25 • 0 commentsThe software of Bioloop has been improved:
- Added Configure section for time axis
- Created submenu for measurement section
- serial port communication now uses 115200 Baud instead of 9600 Baud
![]()
-
Case Study: Working vs. Relaxing
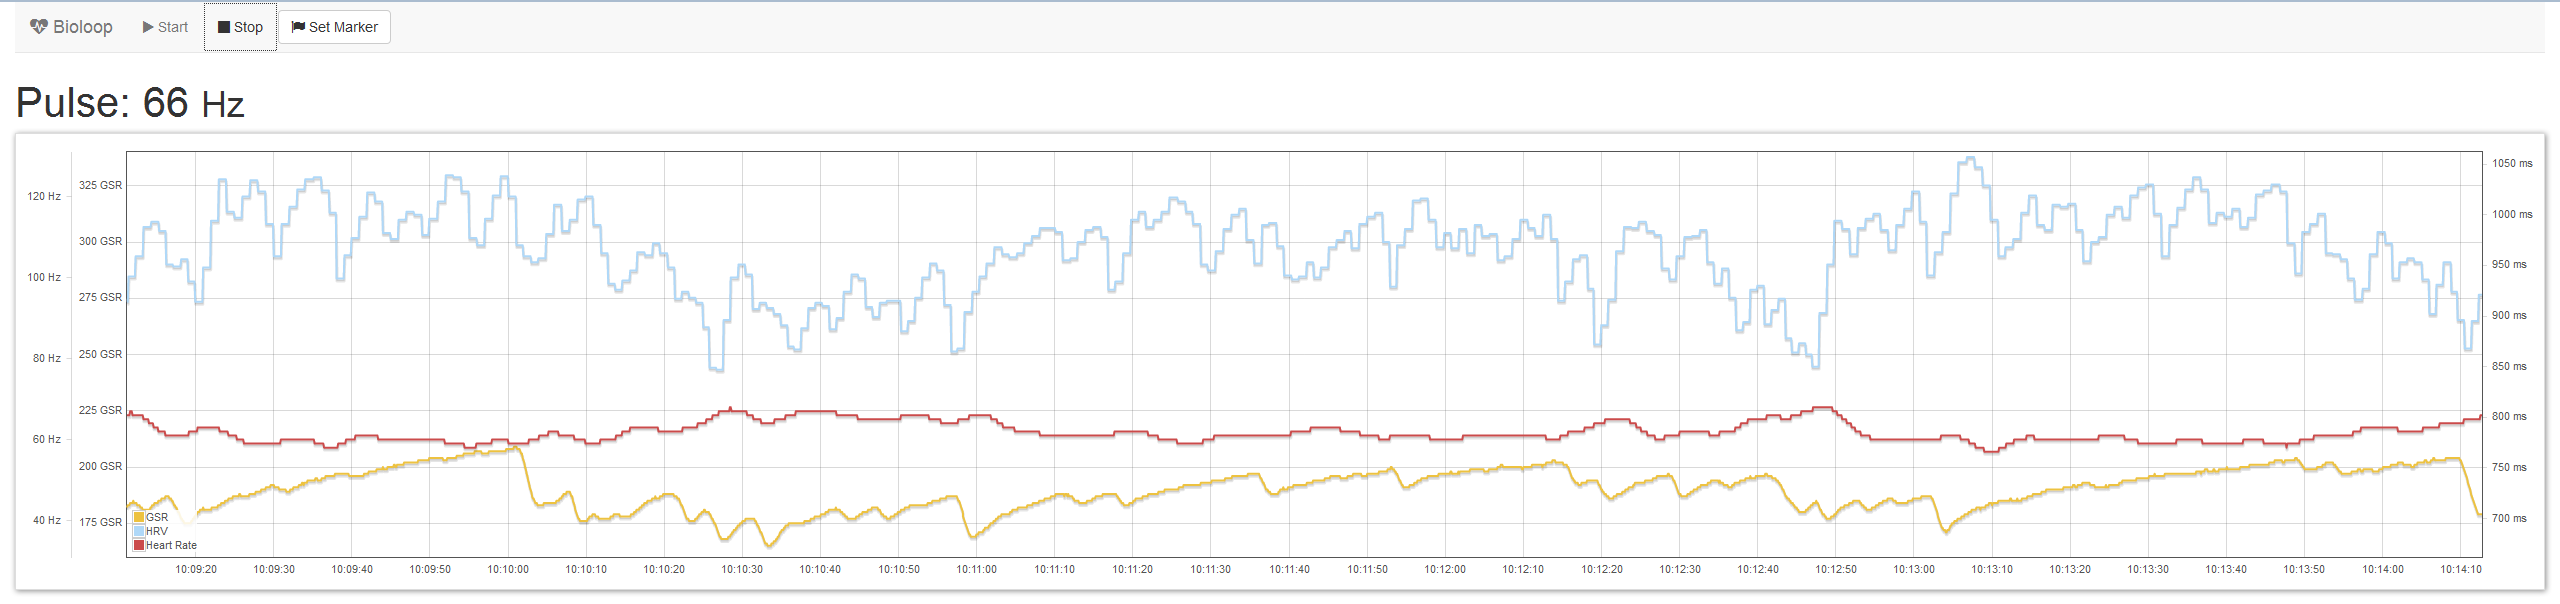
10/15/2015 at 09:23 • 1 commentA recent experiment demonstrates impressively the contrast of biofeedback during a focused working session and a relaxation excercise.
The recorded working session at the computer:
![]()
... in contrast to the relaxation excercise:
![]()
I didn't expect the results to be that different!
-
Case Study: Stress
10/14/2015 at 12:34 • 0 commentsAn initial version of the software has been finished, so its time for a first case study. As biofeedback is a method for visualization of physical body reactions, stress should be a good stimulus. And which type of stress can be generated instantly? Right! Don't breathe! ;-)
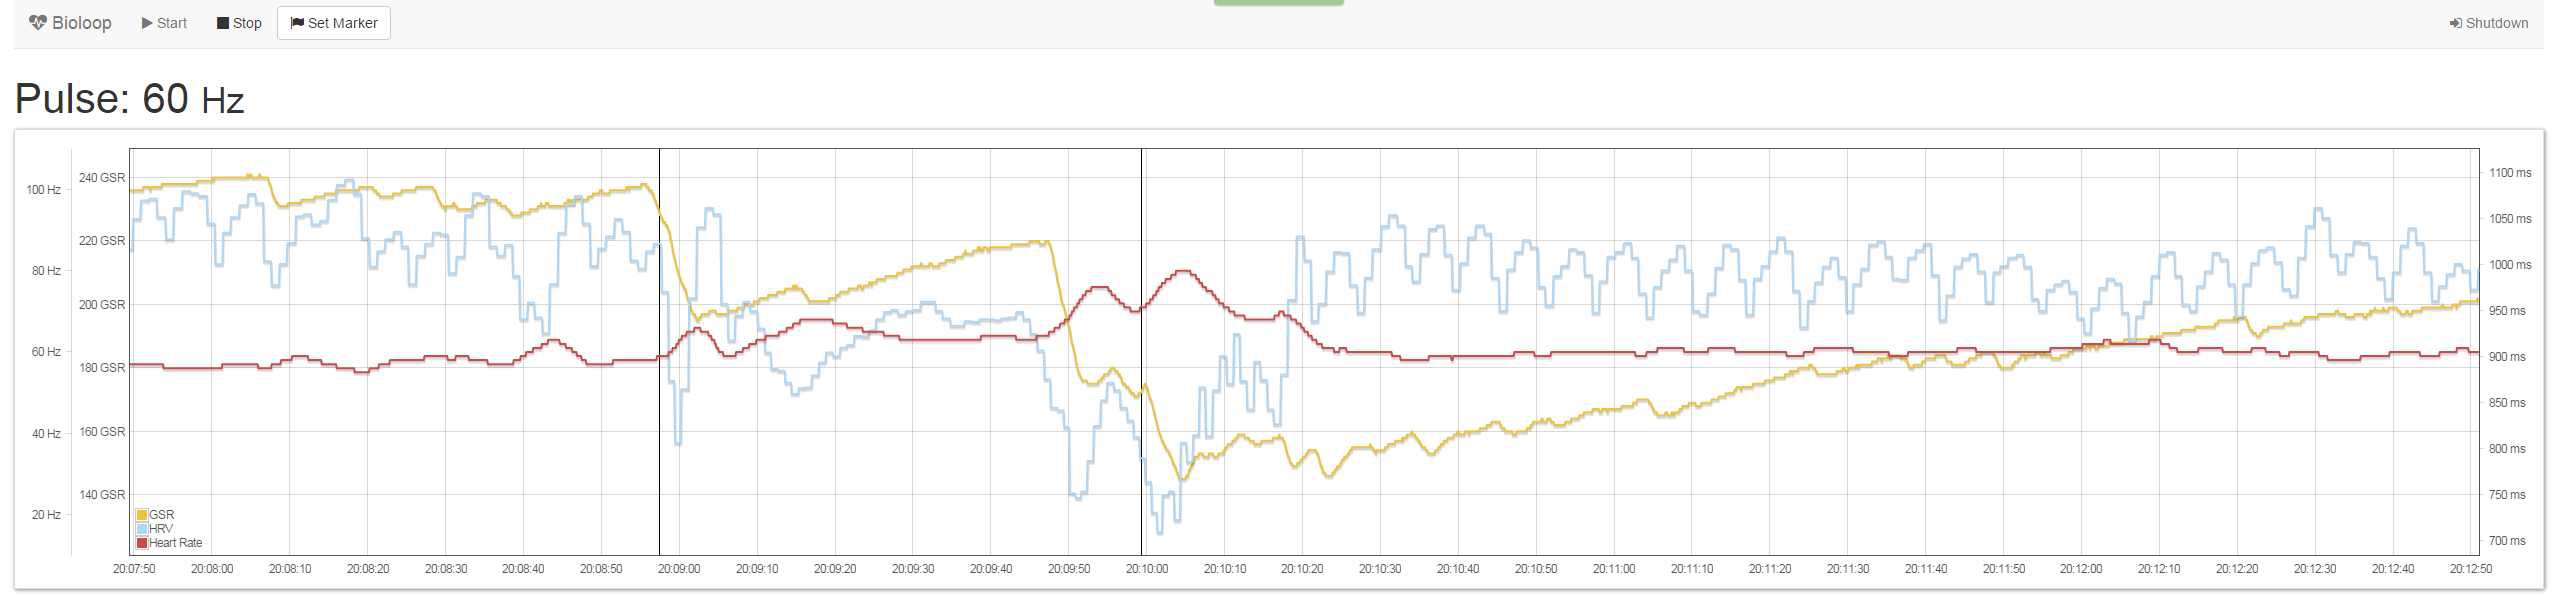
The following diagram displays a recorded period about 1 minute with no breathing. The two vertical black lines mark the beginning and end of the period:
![]()
- Yellow line: Galvanic Skin Response (GSR). Falling line means increased skin sweat production
- Blue line: Heart Rate Variability (HRV) - the varying time delta (in milliseconds) between two heart beats
- Red line: classical Heart Rate
Some facts that I noticed and that I could reproduce:
- Heart rate does not increase as much as expected
- HRV is much more regular than before
- Heart rate is more constant than before
- GSR line: fall - rise - fall pattern