What is bio-engineering?
Bioengineering is the application of engineering and science principles to tissues, cells and molecules.
What can you do with the bio-engineering basic kit?
The kit contains two main items: An Arduino Mega shield with 3-D printed stand and probe arm to measure pH, temperature, optical density of solutions or growth media and record data over time on a SD card for further processing and a micro hot plate with digital temperature control to grow bacteria or molds at a constant temperature or trigger chemical reactions at a certain temperature.
Arduino Mega shield design
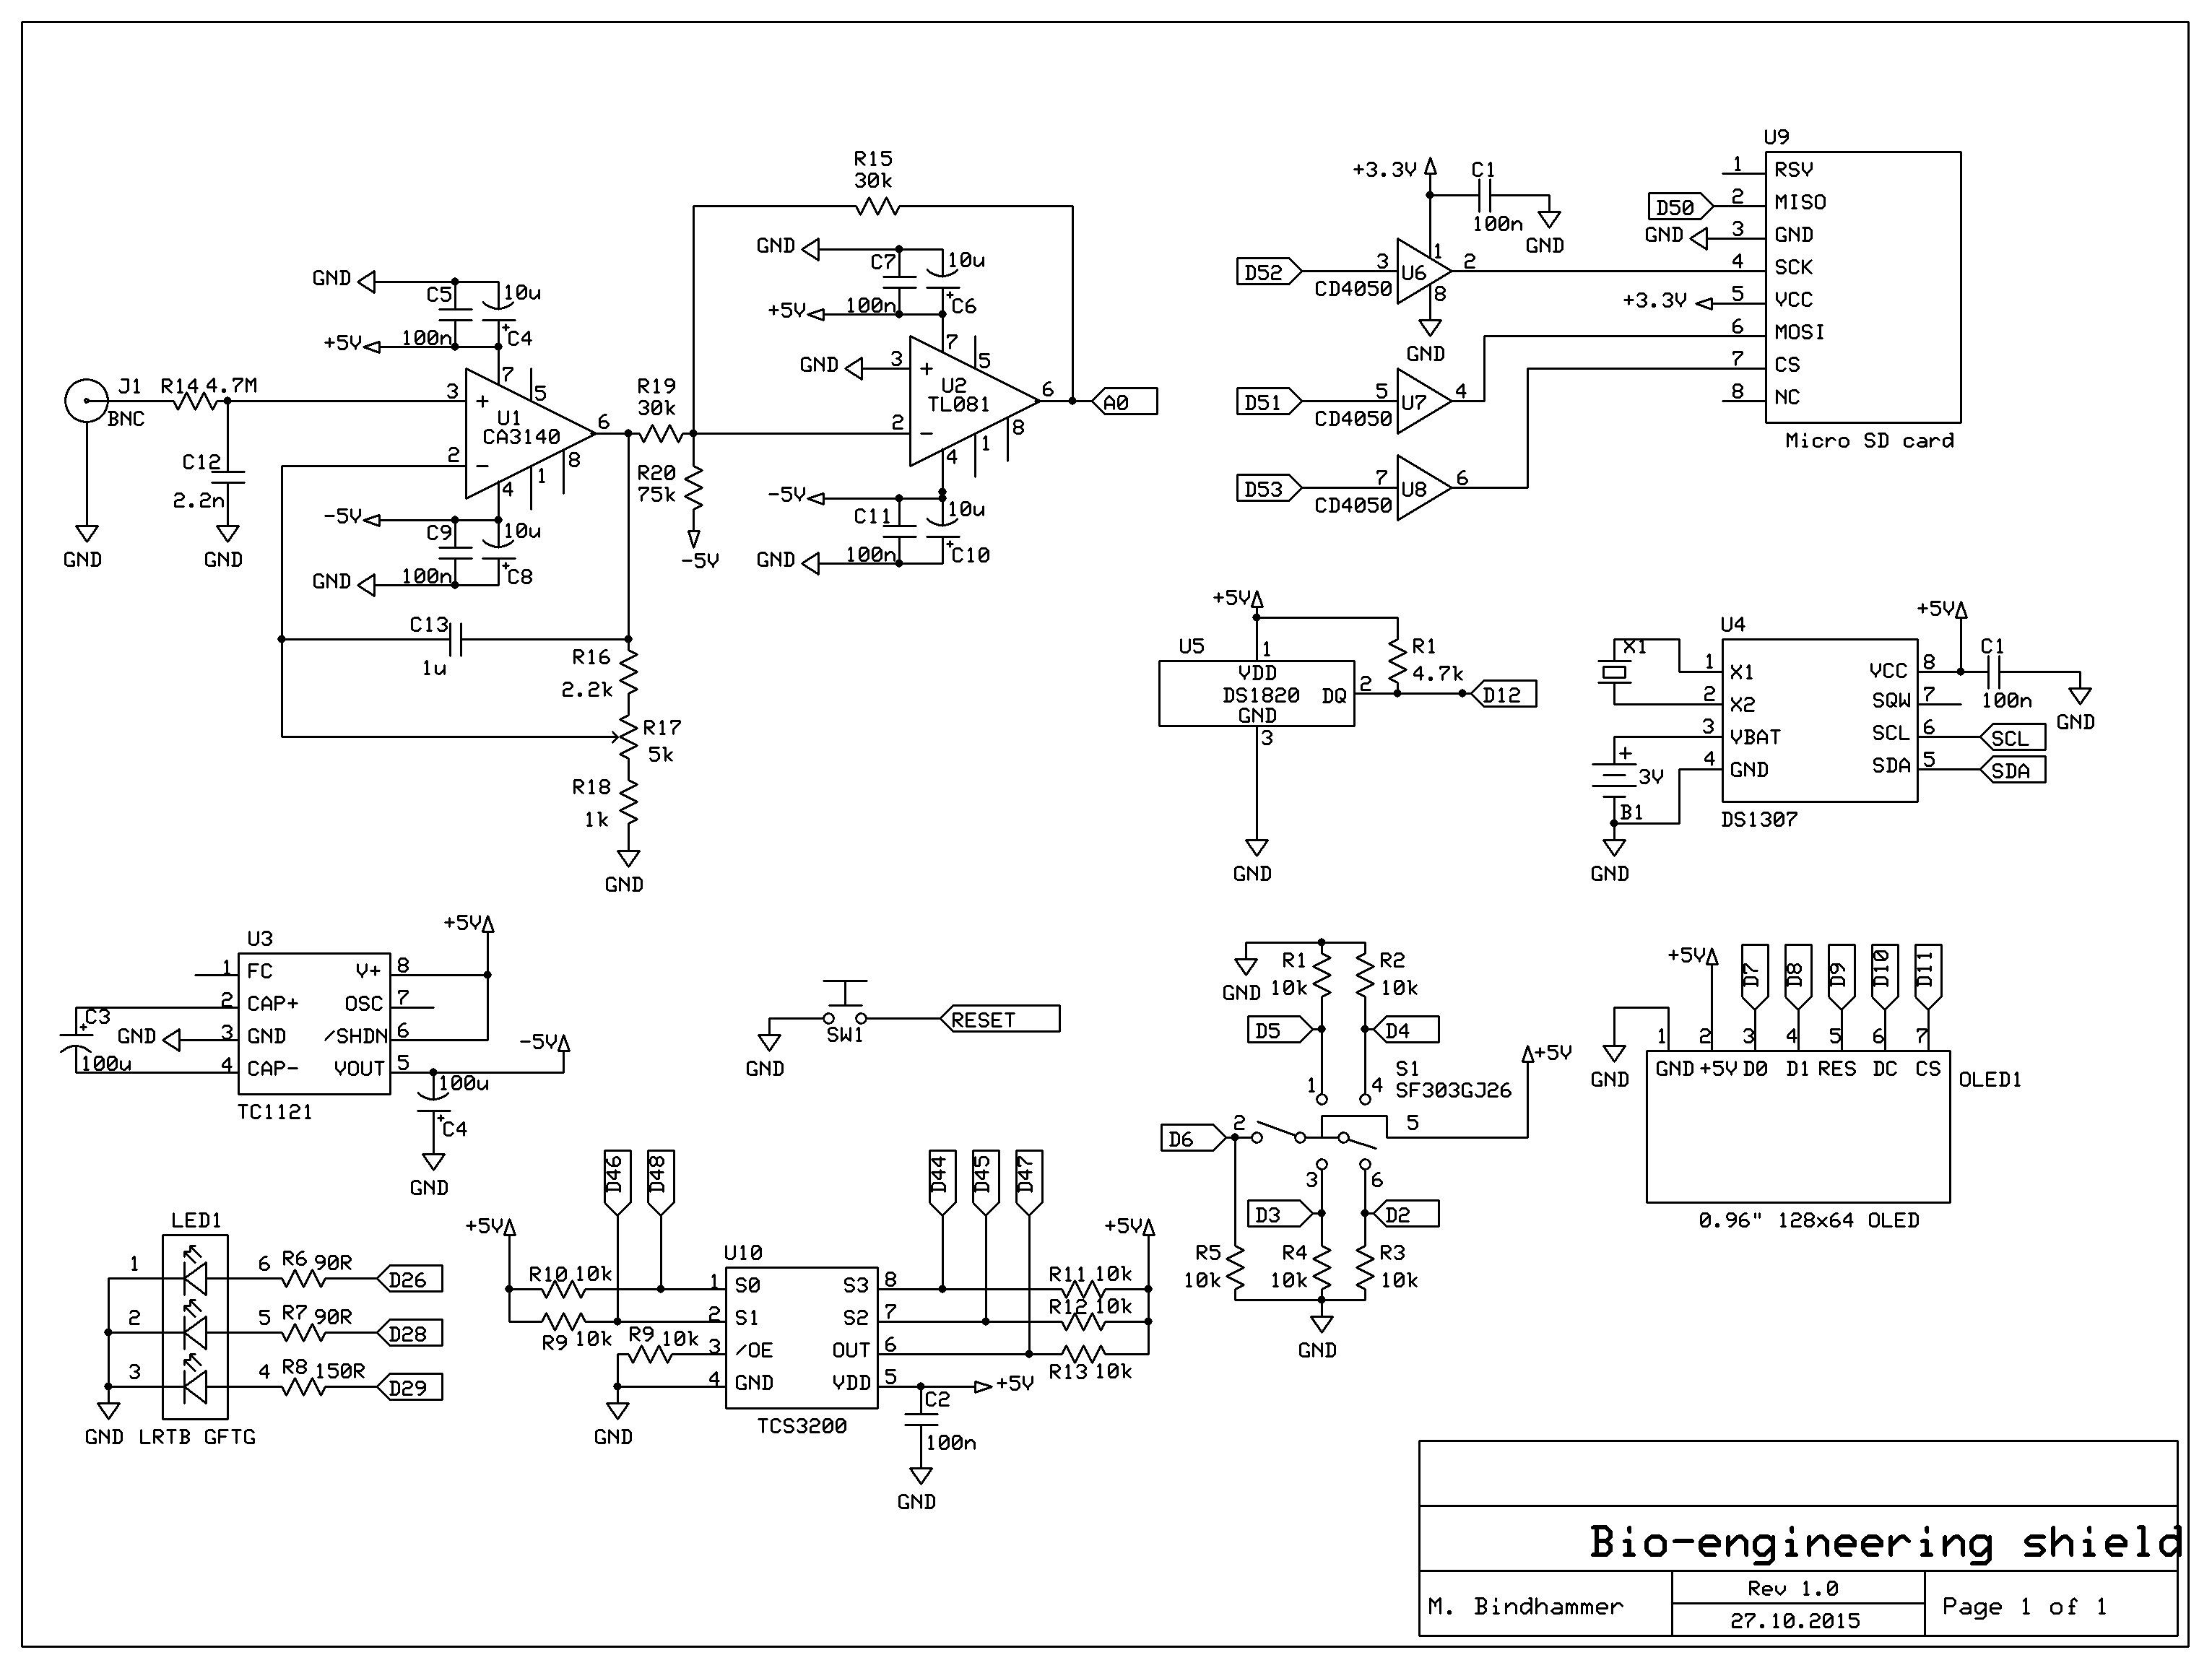
Fig. 1 Shield schematic for the Arduino Mega to measure pH, temperature and optical density of solutions or growth media and record data over time on a SD card
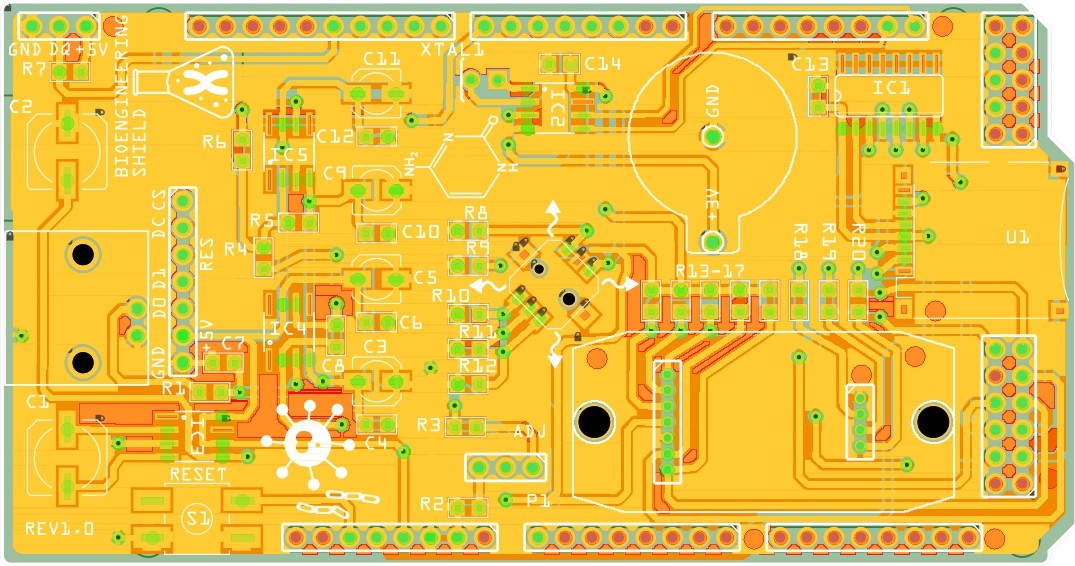
Fig. 2 PCB layout
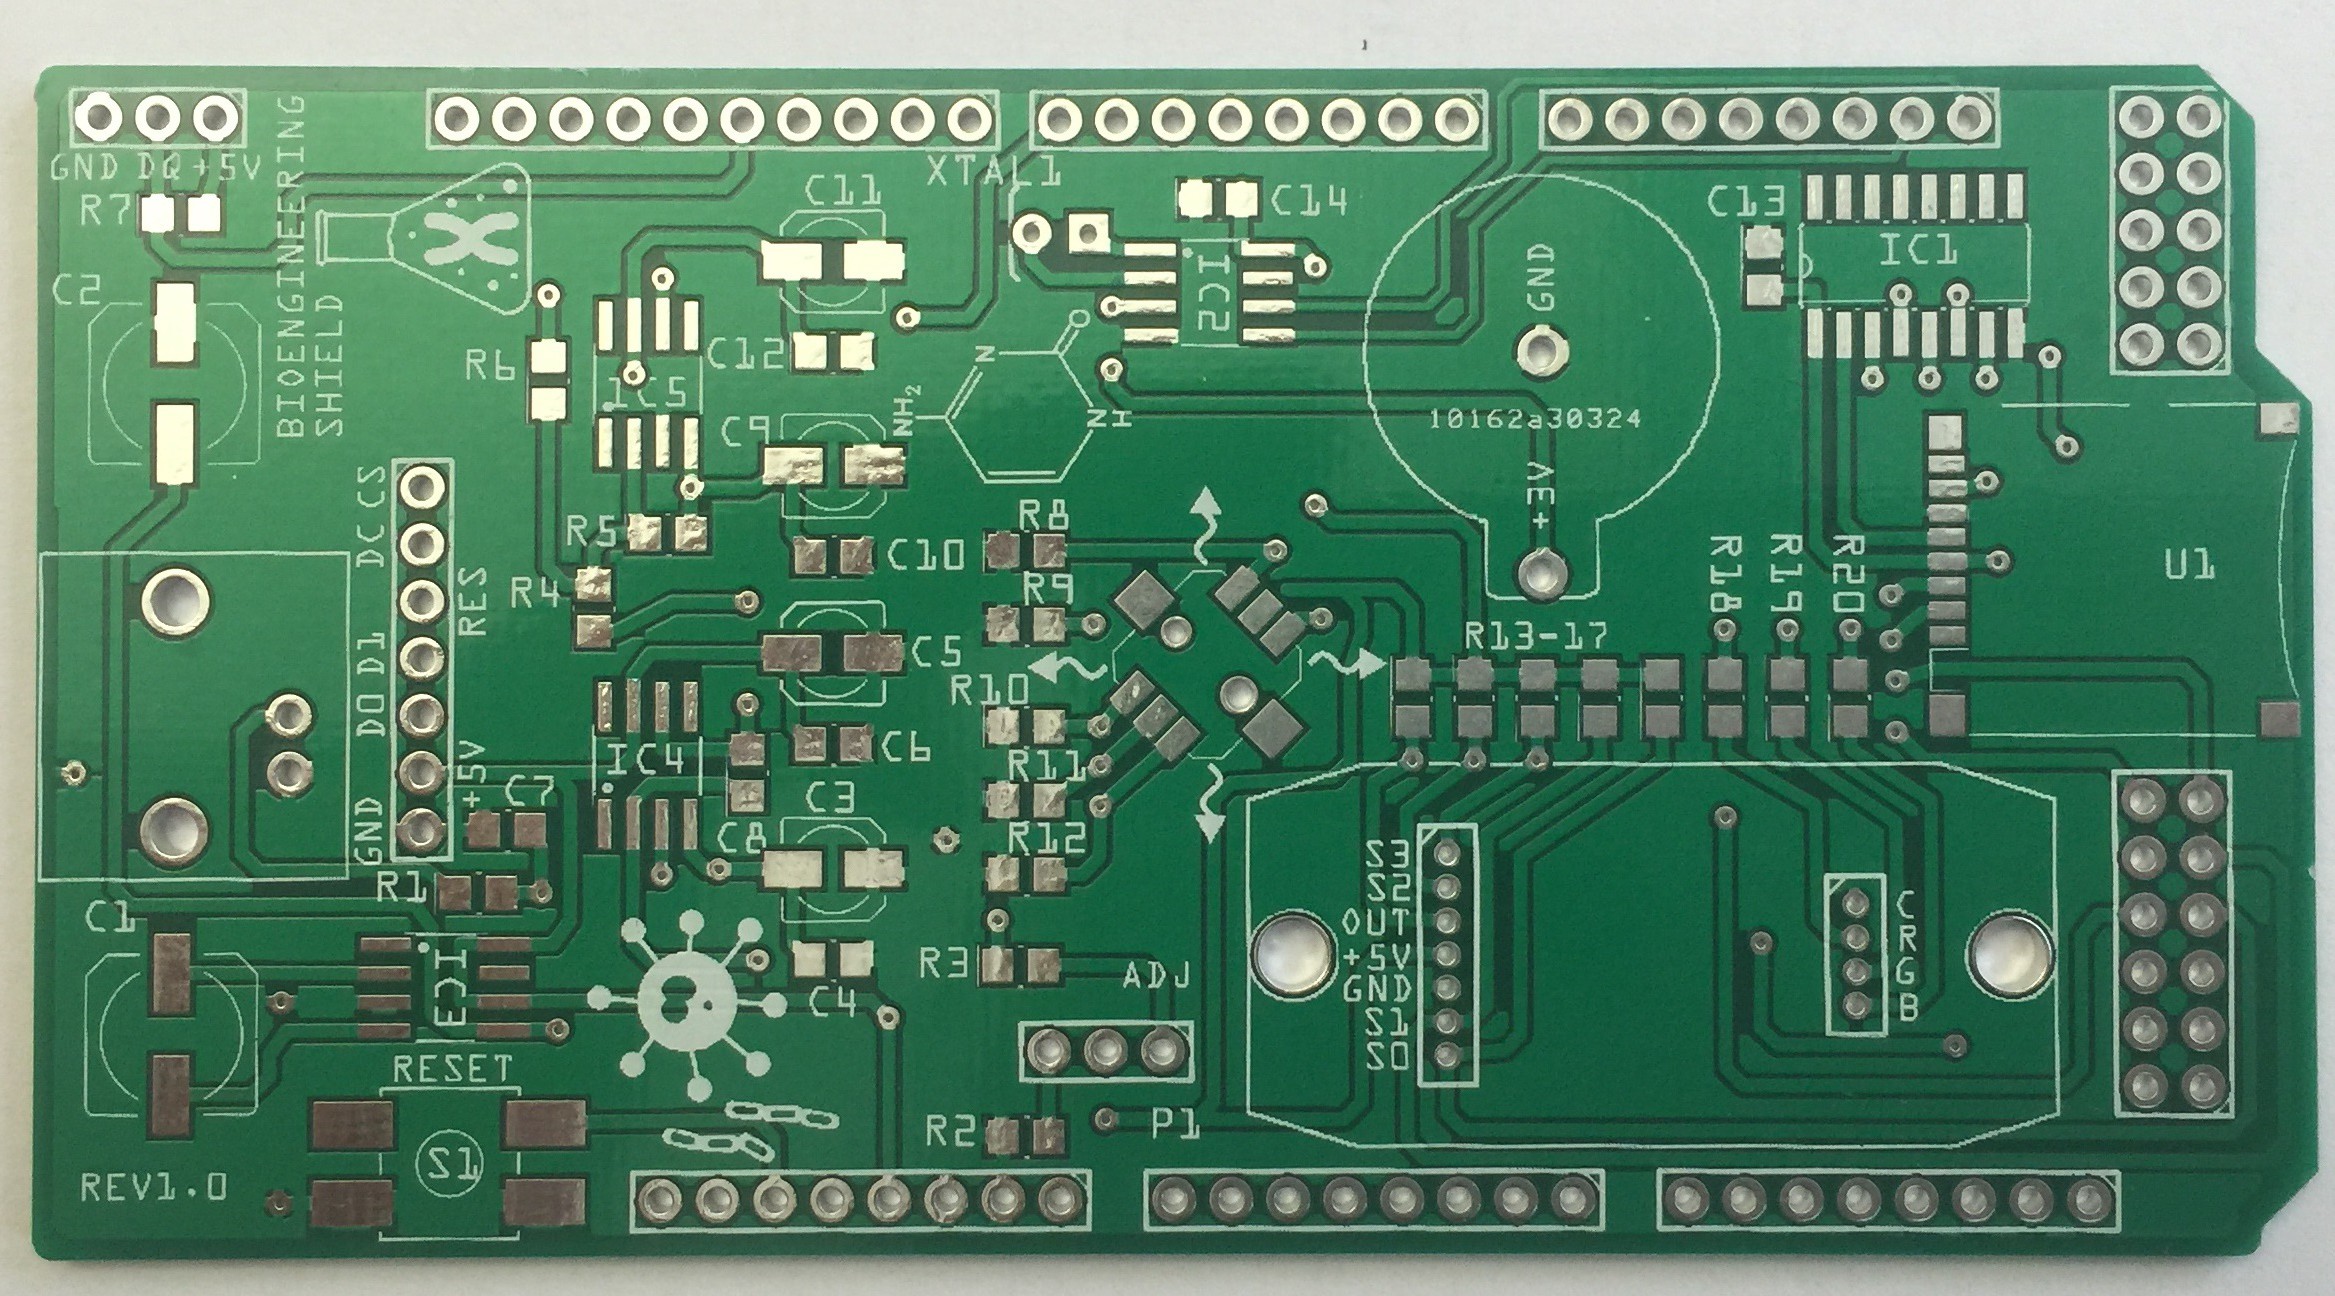
Fig. 3 PCB
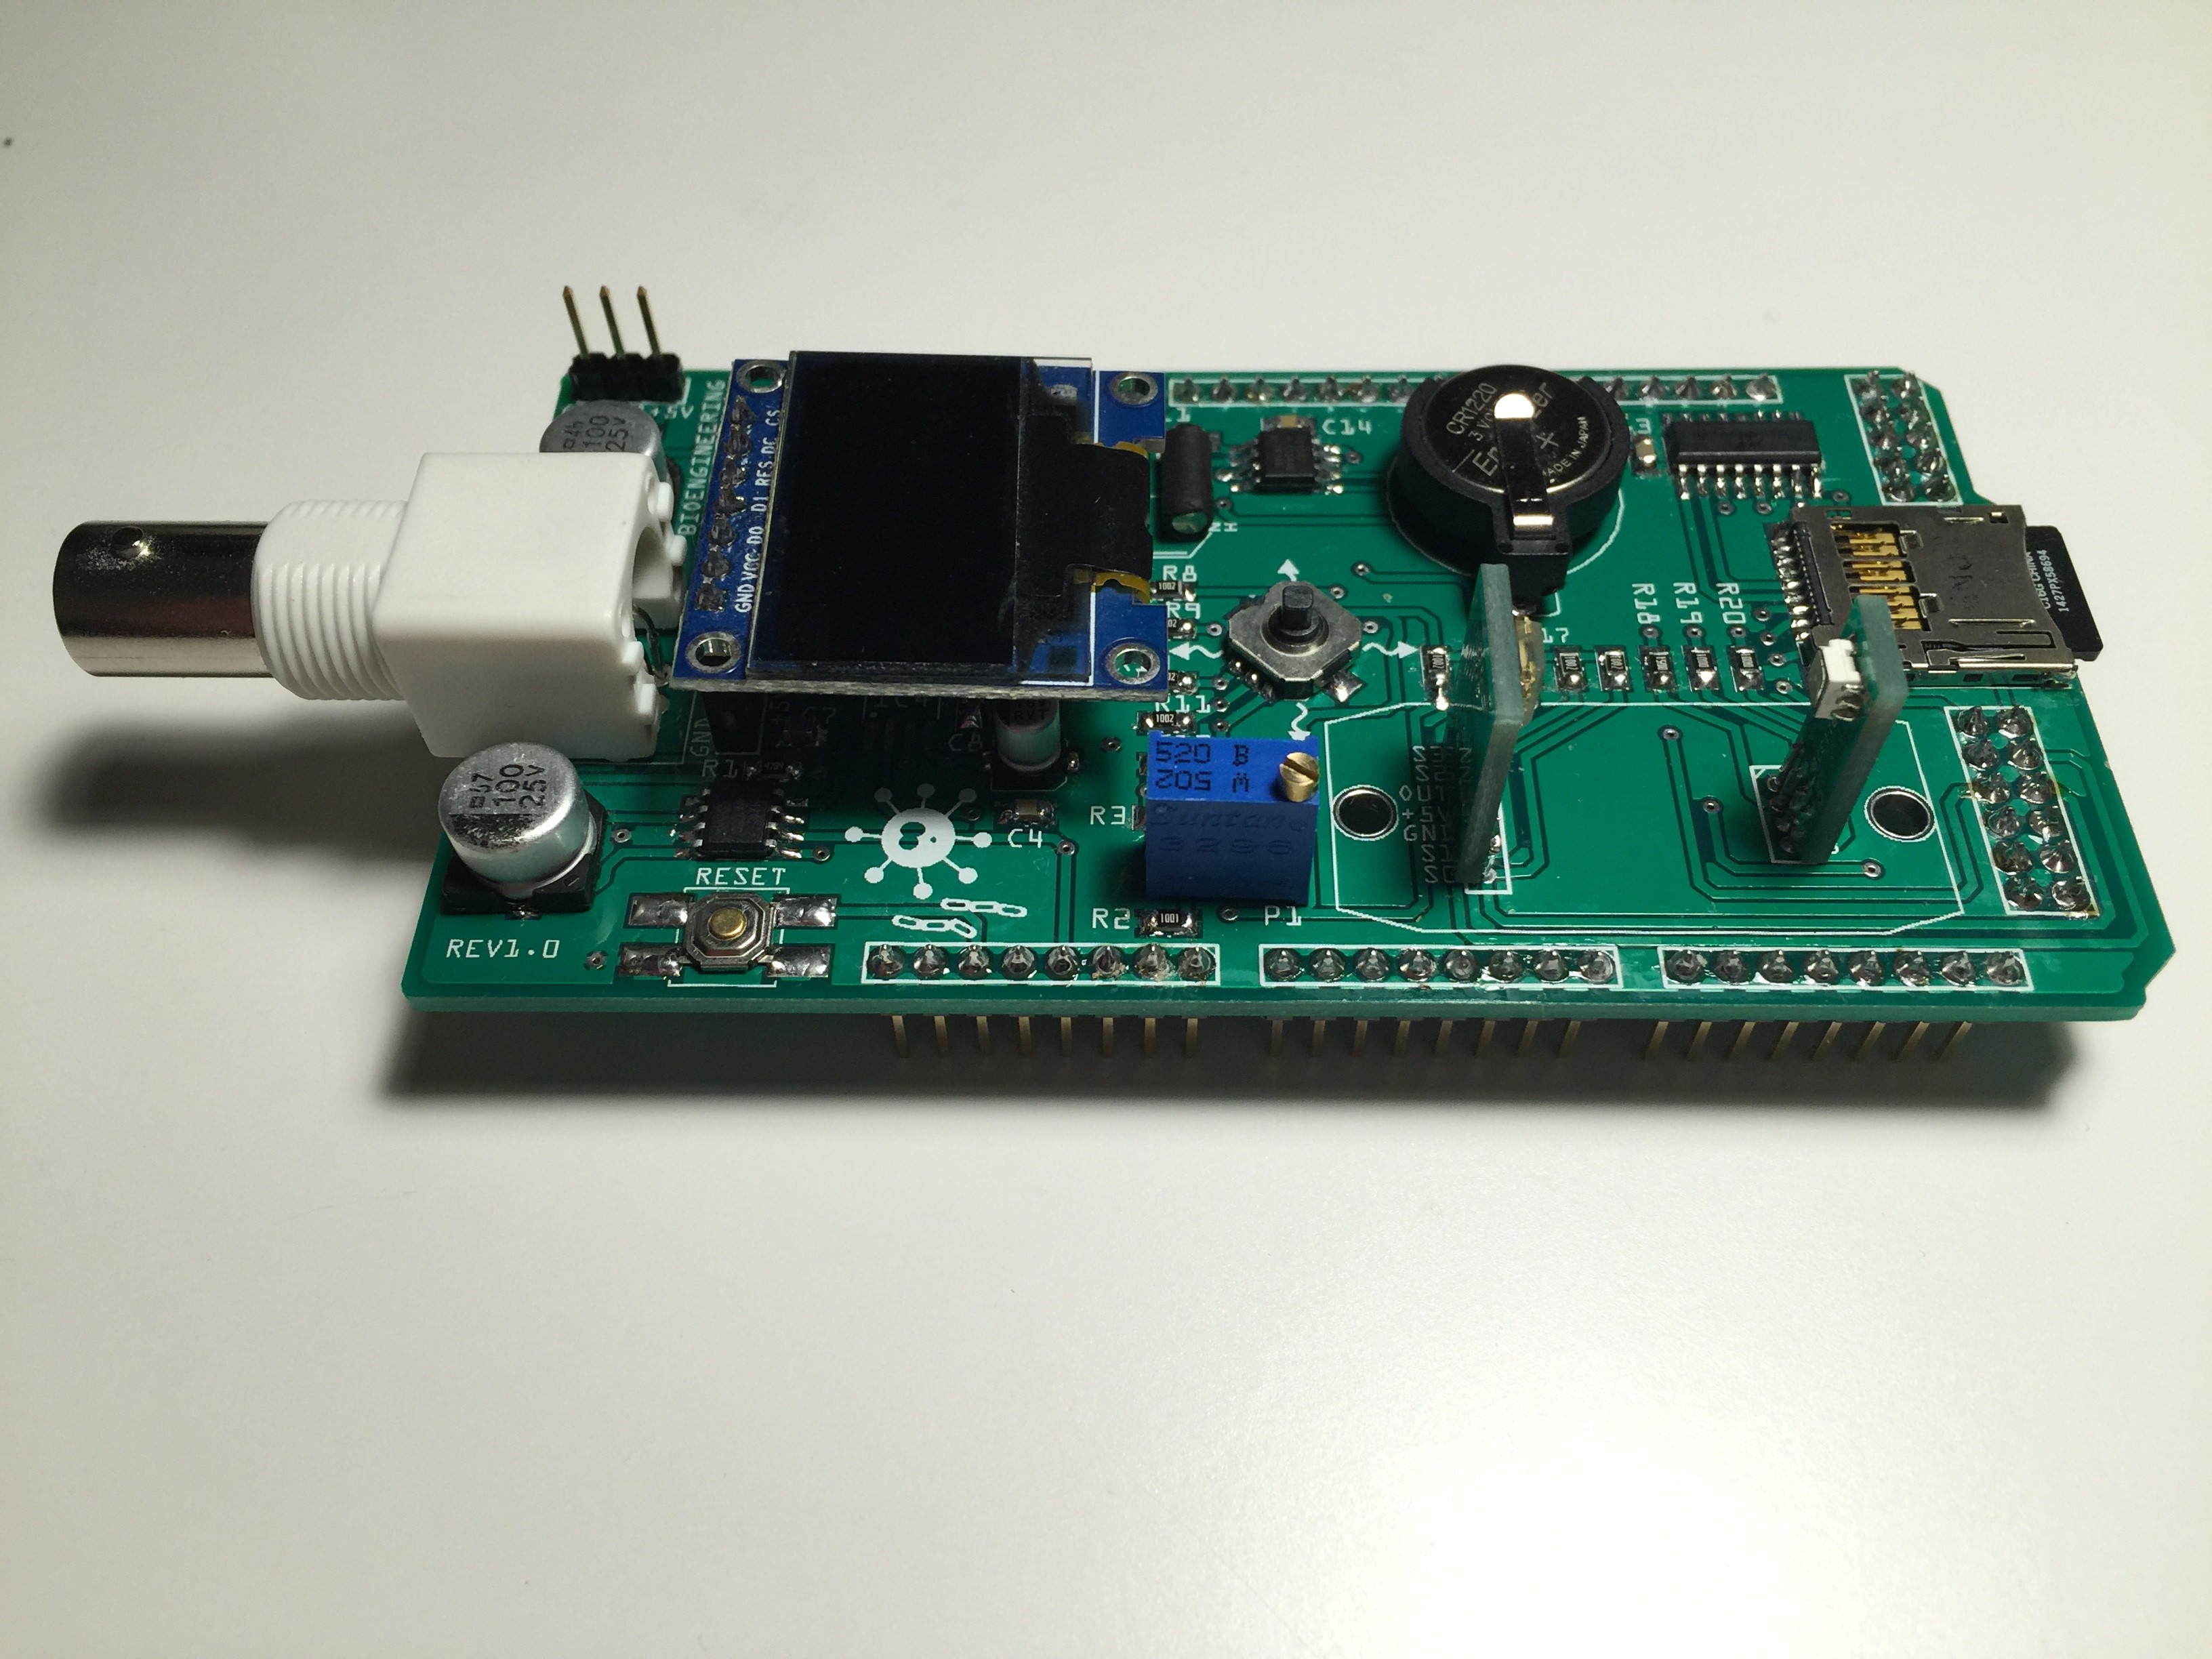
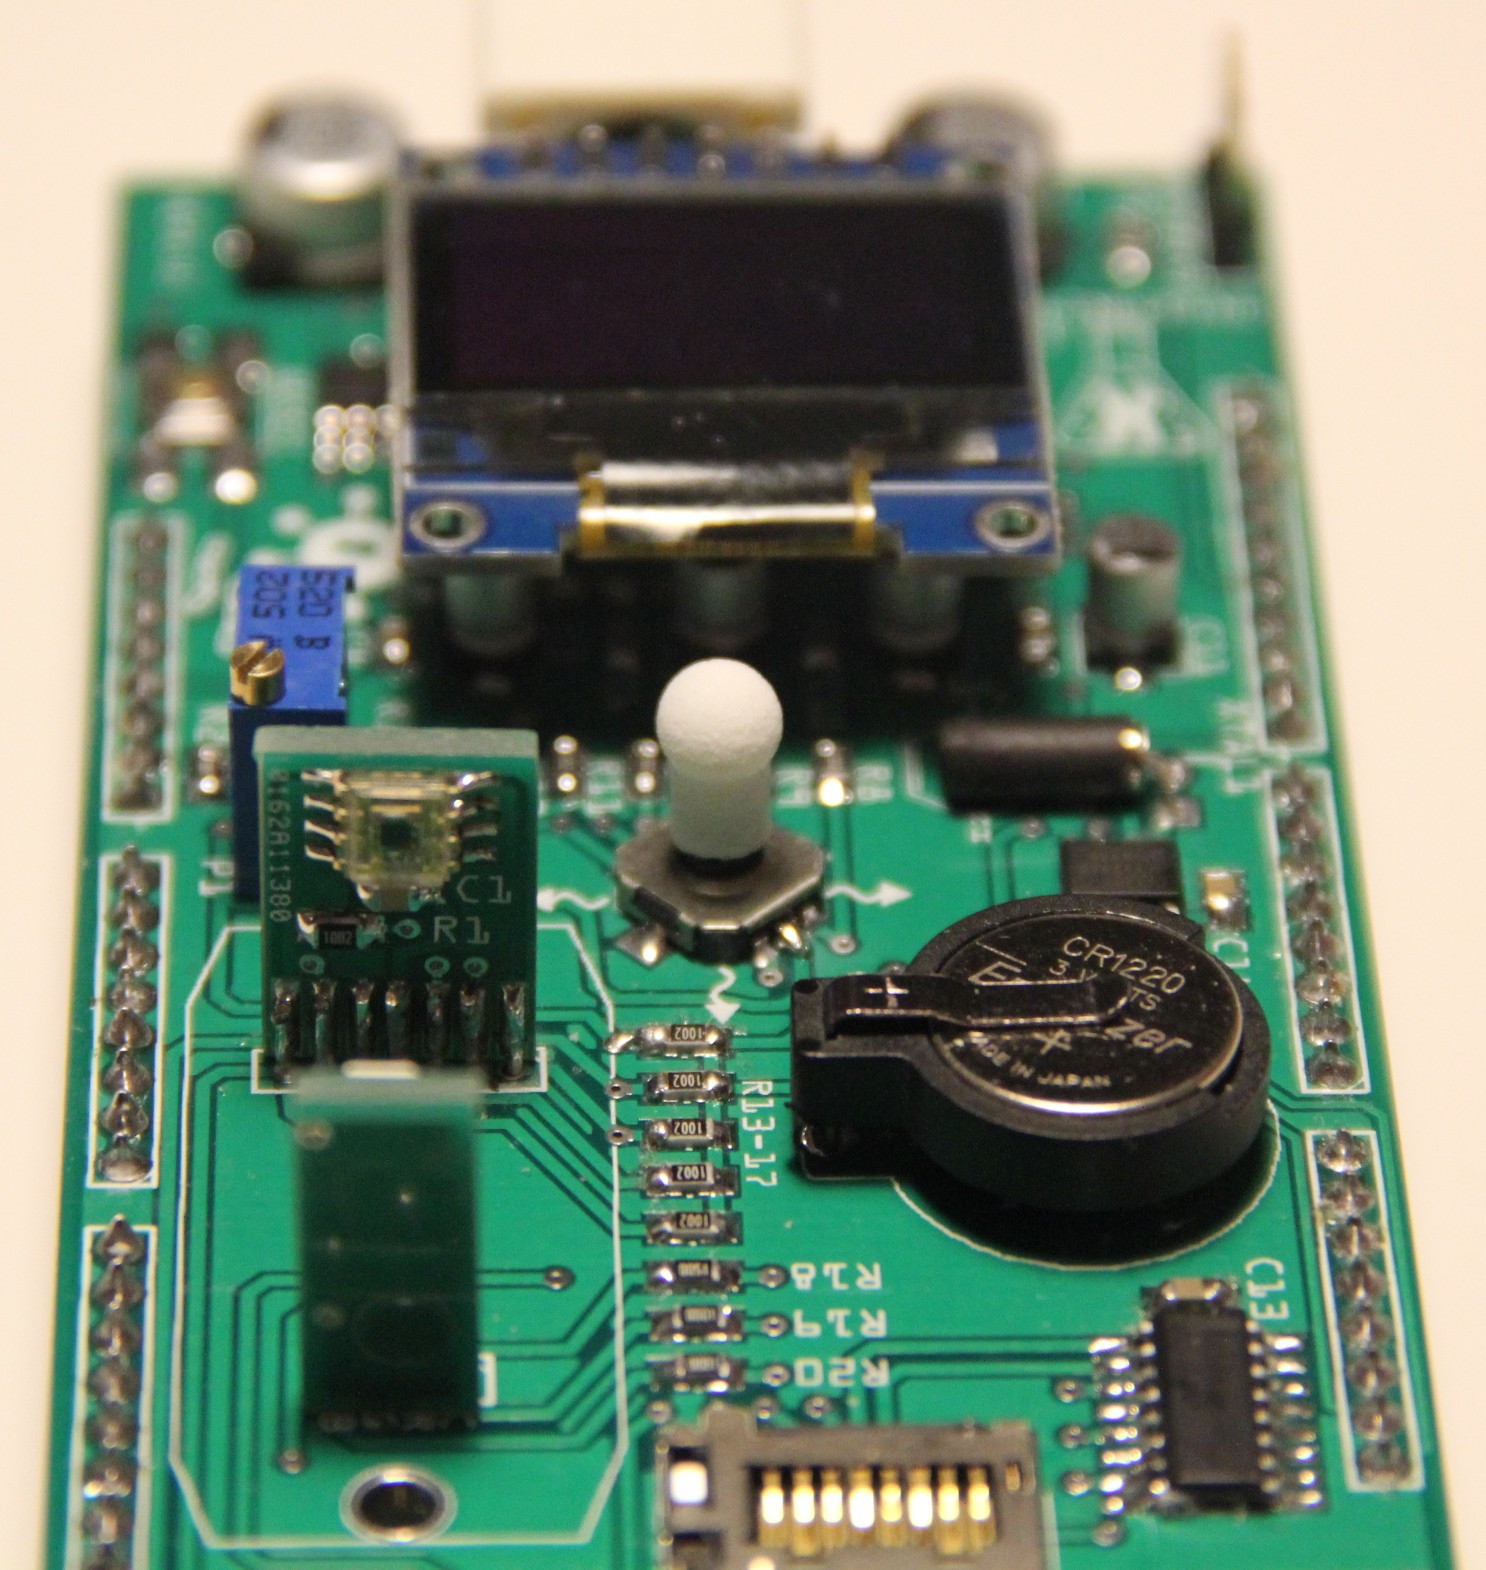
Fig. 4 Populated PCB
pH meter
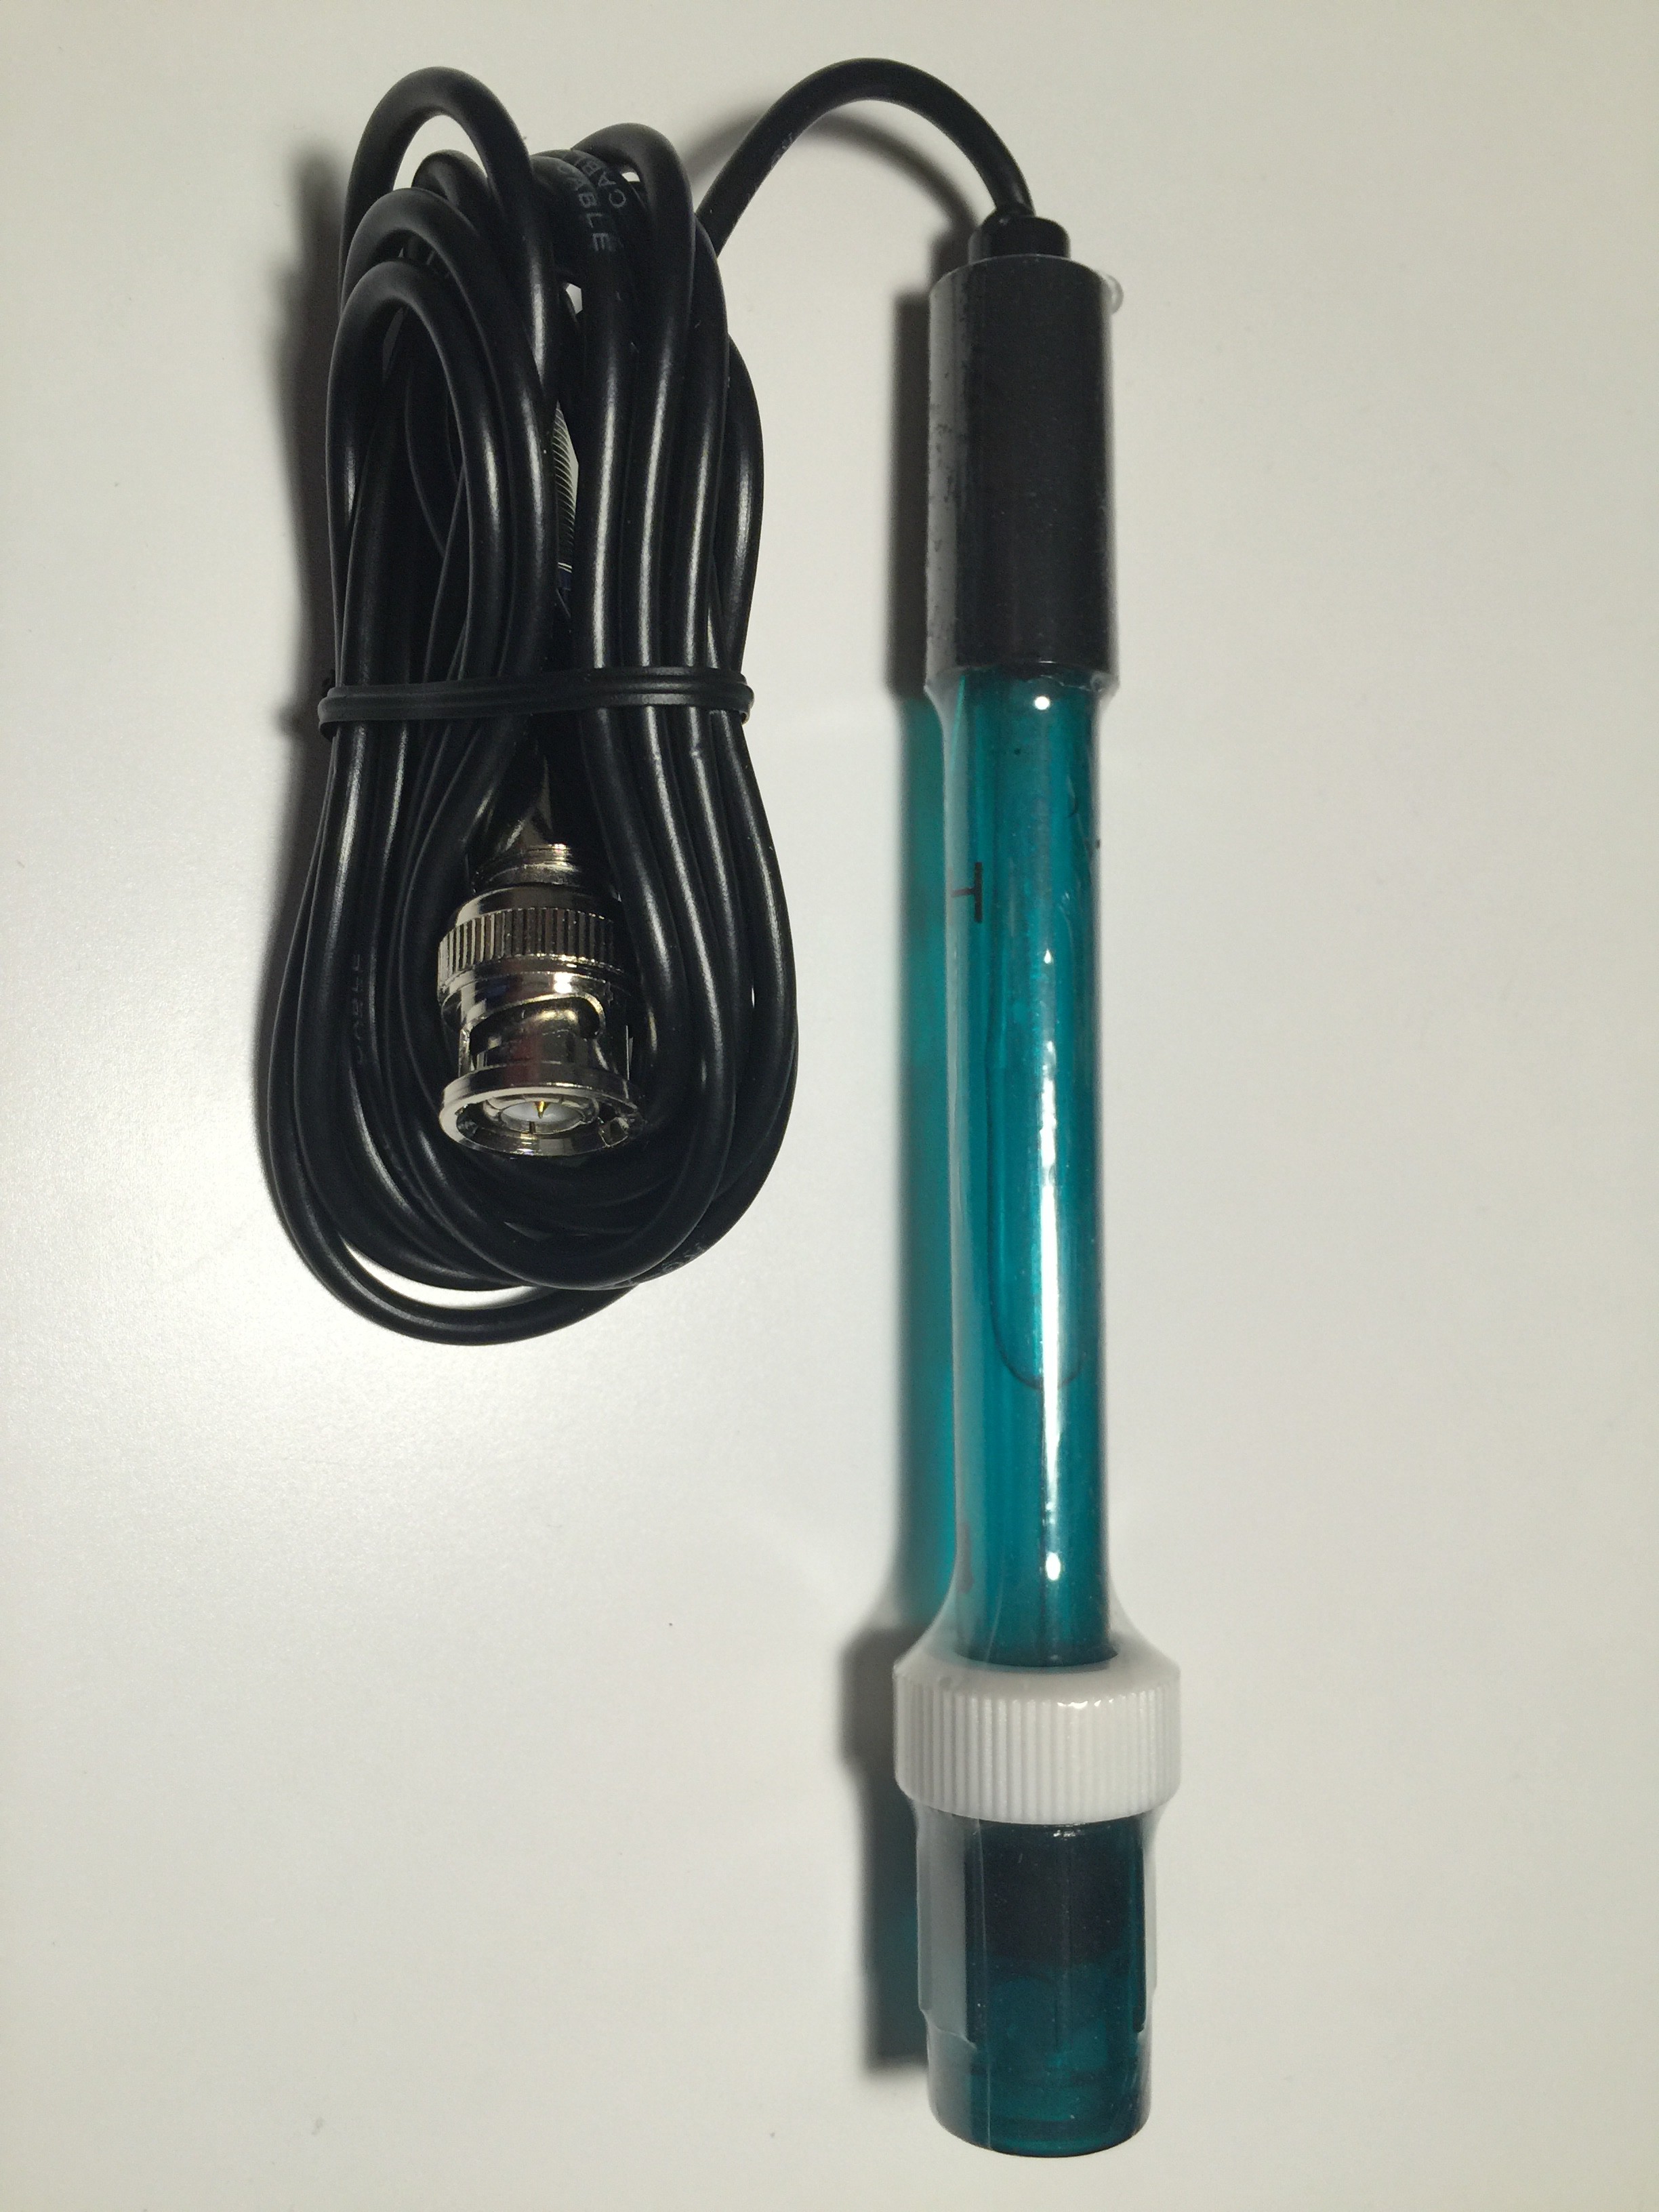
pH electrode specification
Type: 201W
Measurement range: 0 - 14 pH
Measurement temperature: 0 - 80 ℃
Zero point: 7 ± 0.25 pH
Alkali error: ≤ 15 mV
Noise: < 0.5 mV
Theoretical percentage slope: ≥ 98.5 %
Internal resistance: ≤ 250 MΩ
Response time: ≤ 1 min
Max. dipping depth: 100 mm
Cable length: approx. 70 cm
Connector: BNC
Fig. 1 pH probe 201W
pH meter theory
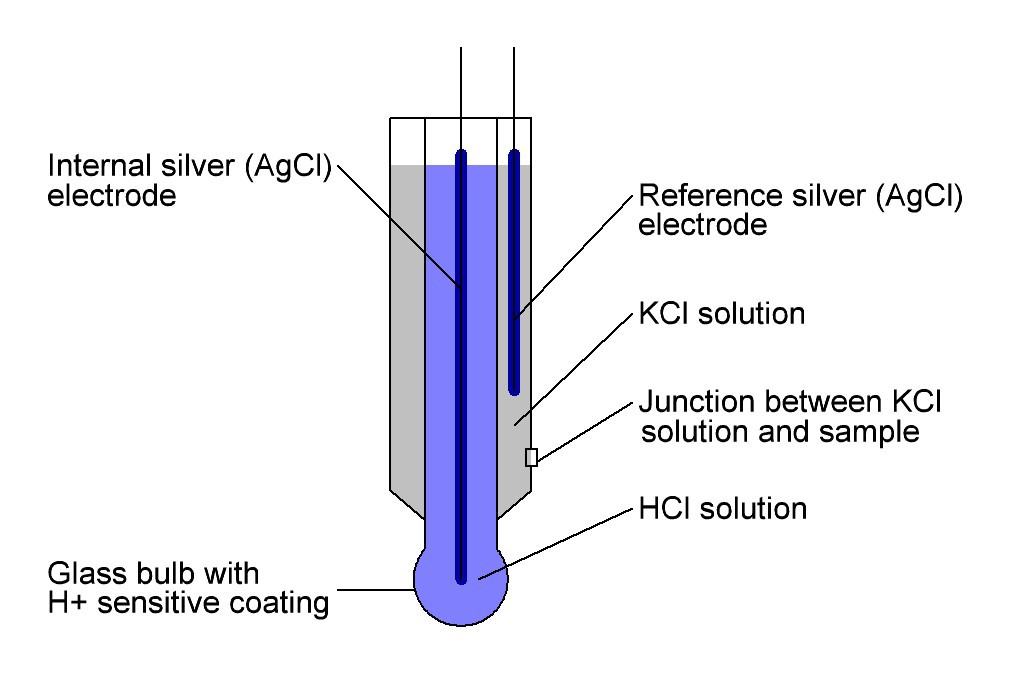
Fig. 1 Schematic drawing of a pH electrode
The Nernst equation expresses the electrical potential of a electrochemical cell at non-standard state conditions and at any time during the electrochemical cell's reaction and is given by
E = Electric potential of the pH electrode
Eo = Standard electric potential of the reference electrode
R = Ideal gas constant ≈ 8.314 V⋅C / (K⋅mol)
T = Absolute temperature = 298.15 K at 25 °C
n = Valence (number of charges on ion) = 1 for H+
F = Faraday constant ≈ 96490 C / mol
Q = Reaction quotient of the species involved
ln(Q) can be expressed as a logarithm to the base 10 by
and log10(Q) can be expressed in terms of the hydrogen ion activity by -log10(aH+) which is the pH of a aqueous solution.
Hence equation (1) becomes
At 25 °C and assuming a zero potential of the reference electrode, equation (3) may now be written as follows:
If we assume the characteristics of an ideal pH electrode, we should have the following voltage outputs of the electrode:
The pH electrode signal is passed through a low-pass filter (R14, C12, see schematic) wit a cut-off frequency of
The op-amp U1 is configured as a non-inverting amplifier with adjustable gain (R17) and active low-pass filter. The output voltage of op-amp U1 is given by
The resistance of Rf and Rg depends on the wiper position of the trimming potentiometer R17.
The op-amp U2 is configured as summing amplifier to accomplish level shifting and output scaling to fit the 5 V input ADC. The summing amplifier sums the two (weighted) voltages:
If we adjust the gain of the non-inverting amplifier for example to 4.8, we have follwing output voltages on U1:
The summing amplifier translates the voltages then to:
pH electrode precautions
- Always store the electrode in the pH meter storage solution recommended by the manufacturer and never in water even it it is deionized water. A pH meter storage solution contains salts that help the pH meter to recover.
- Never let the electrode dry out.
- Thoroughly rinse the electrode with distilled or deionized water, after removing from the storage solution, between measuring samples or calibration buffers and before returning to the storage solution. A quick flick with the wrist also removes the excess water from the probe.
- Only measure cooled samples.
- Move the electrode around in the sample. This avoids localized pH changes caused by the acidic nature of the probe.
- Don't scratch or rub the glass bulb. It is coated with a sensitive layer that is integral to its function and it's rather fragile.
pH electrode/sensor arm
The pH electrode/sensor arm will move in almost any direction and will hold up to three probes/sensors safely. First I designed the stand for the pH electrode/sensor arm.
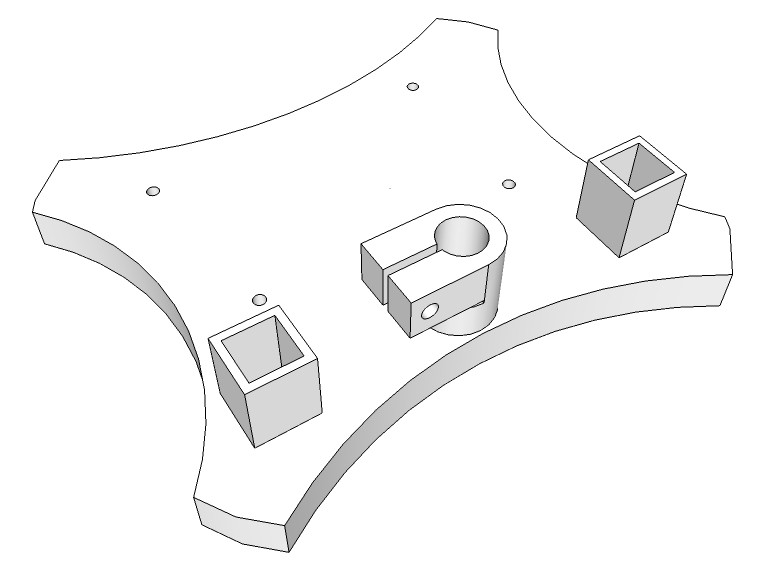
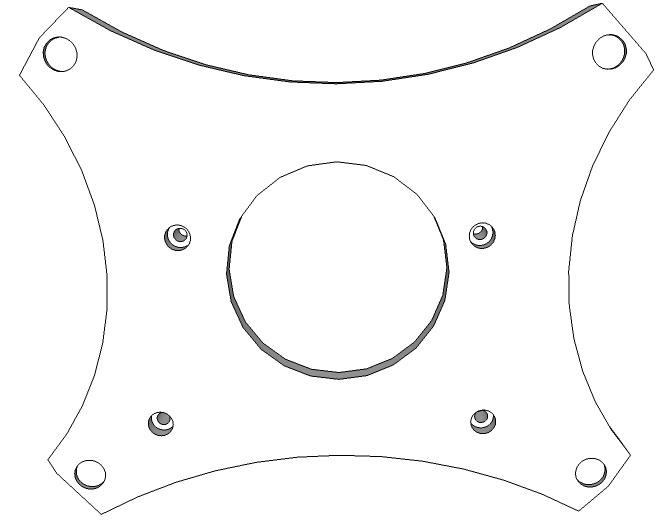
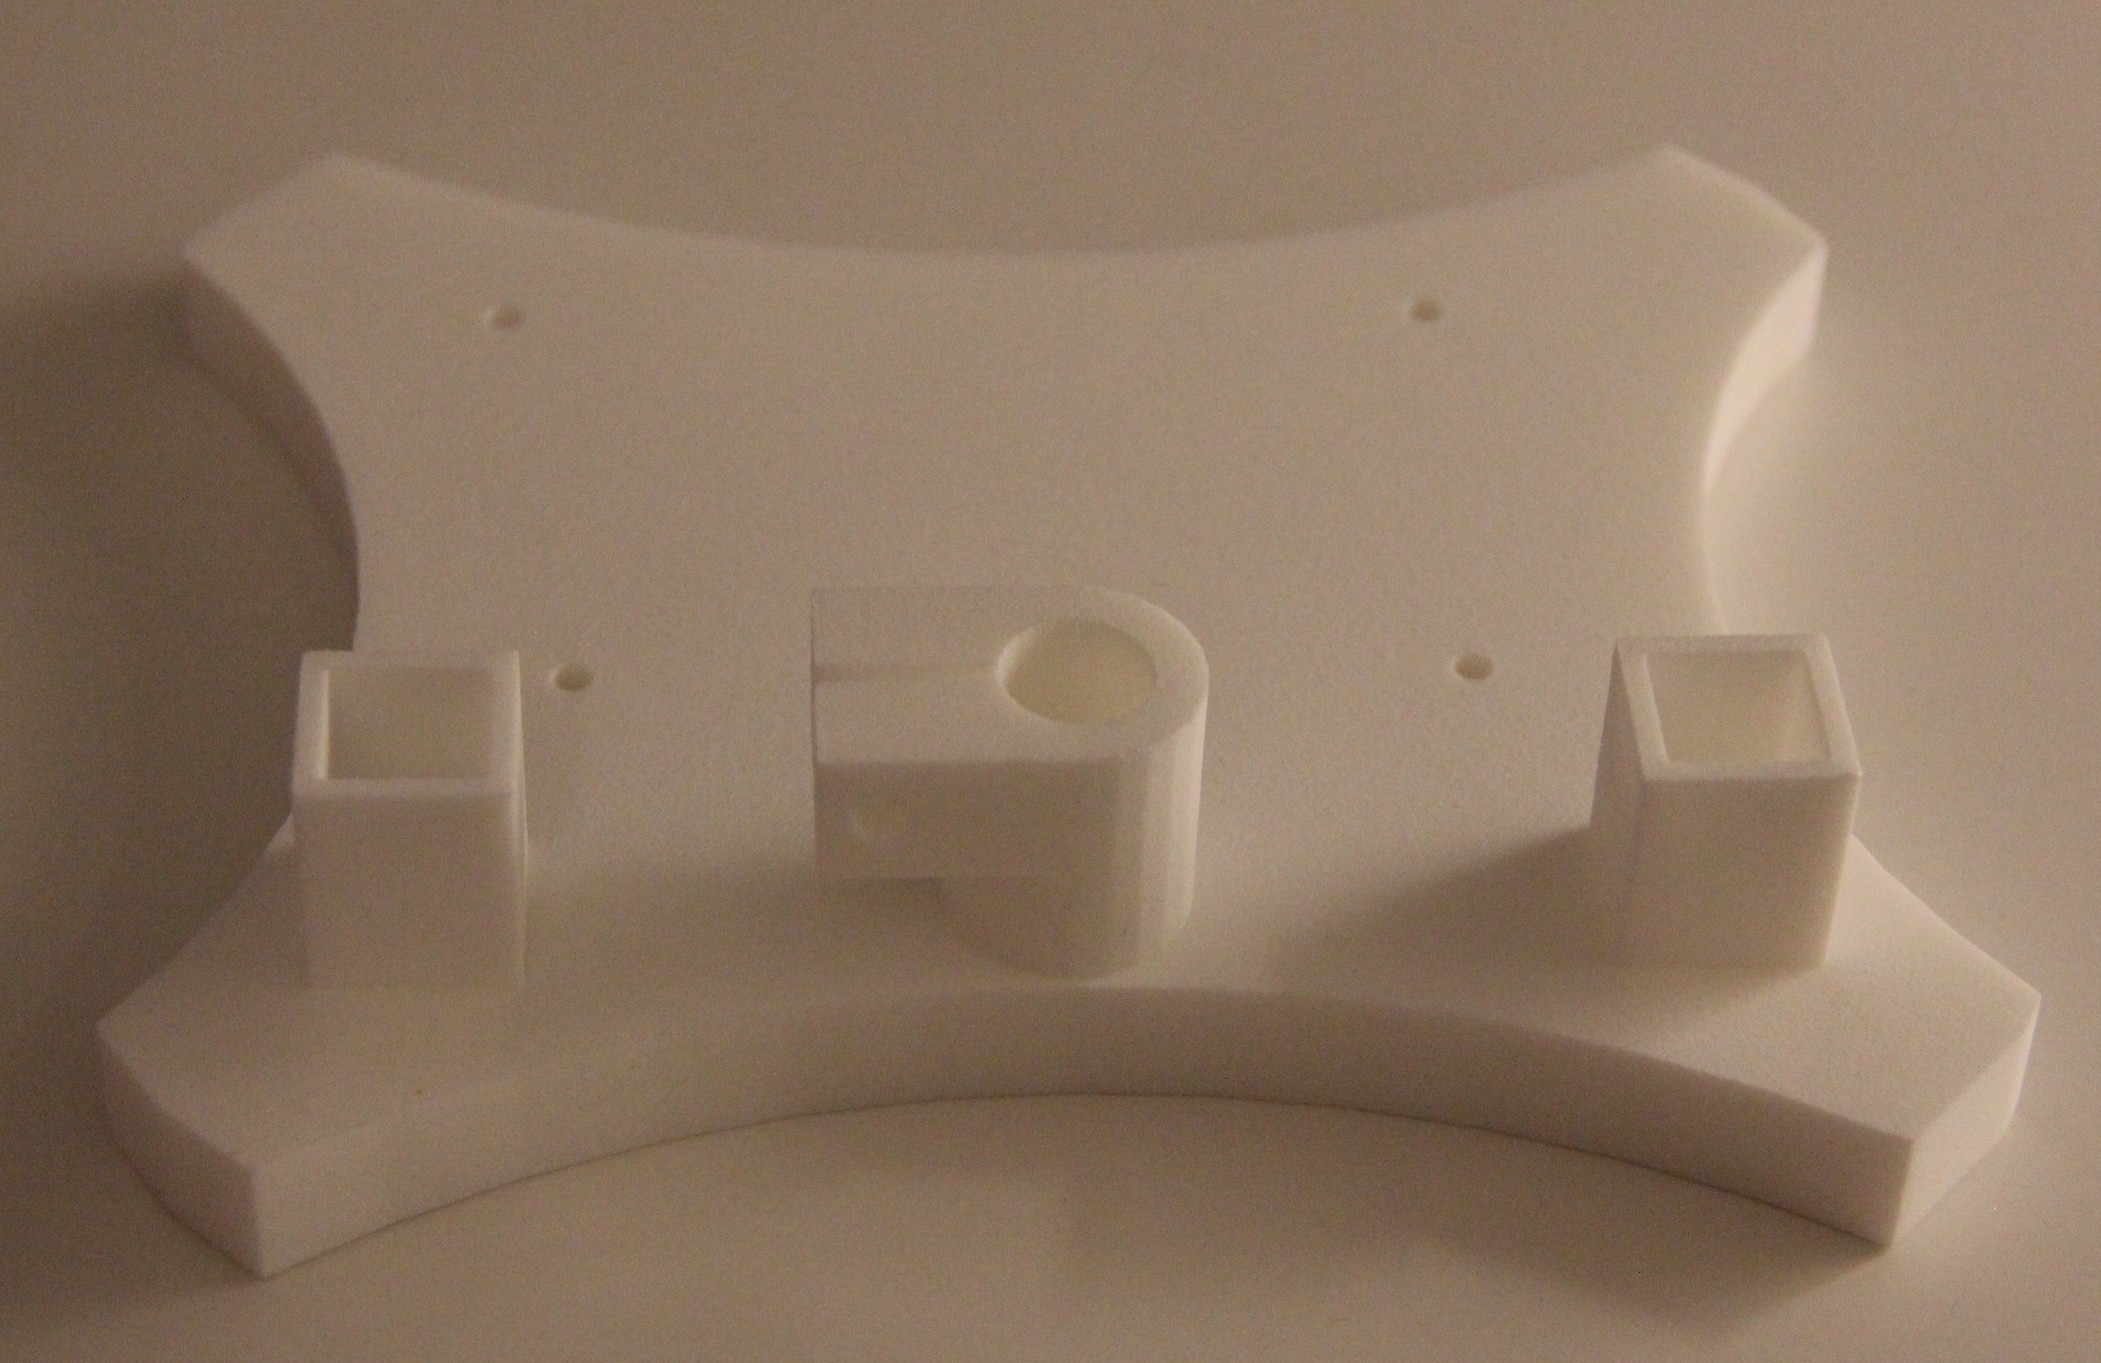
Fig. 2 pH electrode/sensor arm stand design. Upper side features two cuvette holders and mounting holes for the Arduino MegaFig. 3 On the bottom side are cut-outs for 4 adhesive rubber pads and an ID 18 x OD 55 x 5 mm flat washer to gain weight
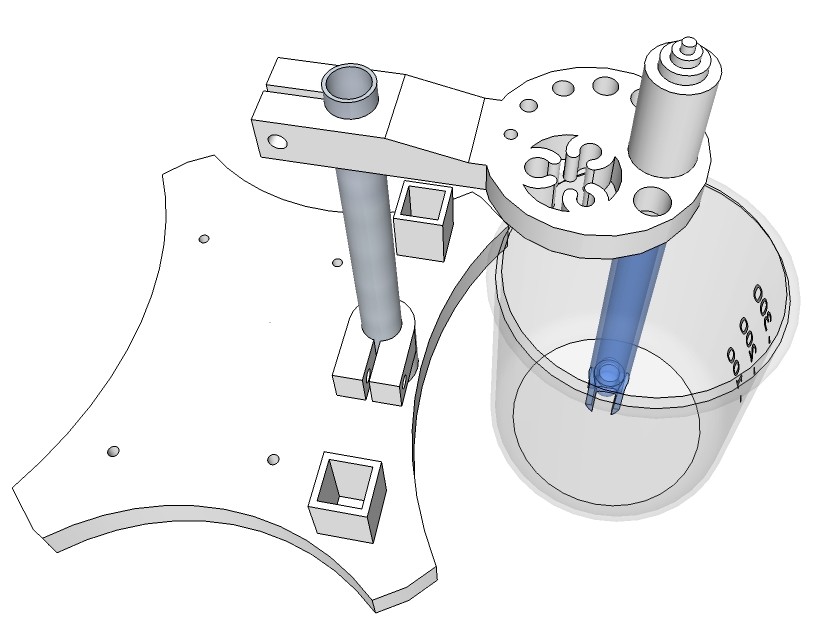 Fig. 4 Design of the probe/sensor arm
Spectrophotometer
Spectrophotometer theory
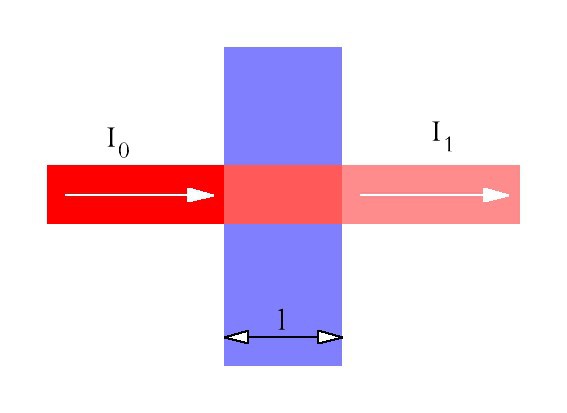
Beer's Law is one of the fundamental laws of spectrophotometry:
where
Fig. 1 Transmittance of light through a sample
A spectrophotometer can not only be used to determine the unknown concentration of the sample. It can also be used to determine the number of bacteria in a sample.
Let us assume the bacteria culture is growing exponentially. Let donate the increase in cells numbers ΔN per time interval Δt, then this ratio is proportional to the actual number of cells N. If for example a population of 10000 cells produces 1000 new cells per hour, a 3 times bigger population of the same microorganism will produce 3000 new cells per hour.
Using a proportionality factor μ < 0, which is called specific growth
rate, yields to the first-order ordinary differential equation:
Determining the integration constant C using the initial condition t = 0:
Substituting C in equation (6):
Let donate the generation time tg, where exactly N = 2⋅N₀, the equation (8) yields
Now, the optical density or in this case more correctly the turbidity is directly proportional to the cell density. However, the proportionality between the optical density OD and the cell density exists only for OD ≤ 0.4.
The cell density [cells/mL] or [cells/L] is given by
where N[sample] is a proportion of the total cell number N and V[sample] a proportion of the total culture volume V.
Hence, equation (9) can be written as
Using a proportionality factor a equation (11) yields
Once the proportionality factor a is determined, we can calculate the cell density from any measured OD .If
we just want to calculate the specific growth rate μ of the bacterium,
we don't need a proportionality factor at all. Let donate OD₀ as the optical density at t = 0, then
 Spectrophotometer structure
A typical spectrophotometer consists of a light source, a collimator, a monochromator, a wavelength selector, a cuvette for sample solution, and a photoelectric detector. To keep it simple, we just use a RGB LED (LRTB GFTG) to produce different wavelengths (625 nm, 528 nm and 470 nm). A variety of wavelengths is necessary because different compounds absorb best at different wavelengths. A TCS3200 color sensor serves as the photoelectric detector. Its output is a square wave (50% duty cycle) with frequency directly proportional to light intensity. As the absorbance is given by
the proportionality factor would be anyhow canceled off within the fraction, so we can use the according frequencies directly instead of light intensities.
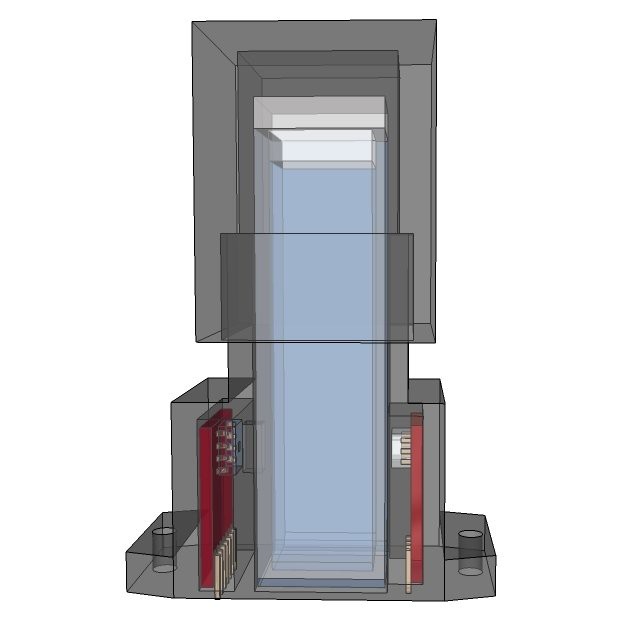
Fig. 2 shows the structure of the PCB mounted spectrophotometer.
Fig. 2 X-ray view of the spectrophotometerThe housing and cap of the spectrophotometer are made by applying black Polymethylmethacrylate in layers, which is bonded together with a binding agent. Standard disposable 12 mm square polystyrene cuvettes with two optical sides, 10 mm path length, a height of 45 mm and a max. filling volume of 4 ml are used.
Thermometer
The thermometer is pre-wired and waterproofed version of the DS18B20 sensor (stainless steel encapsulated). 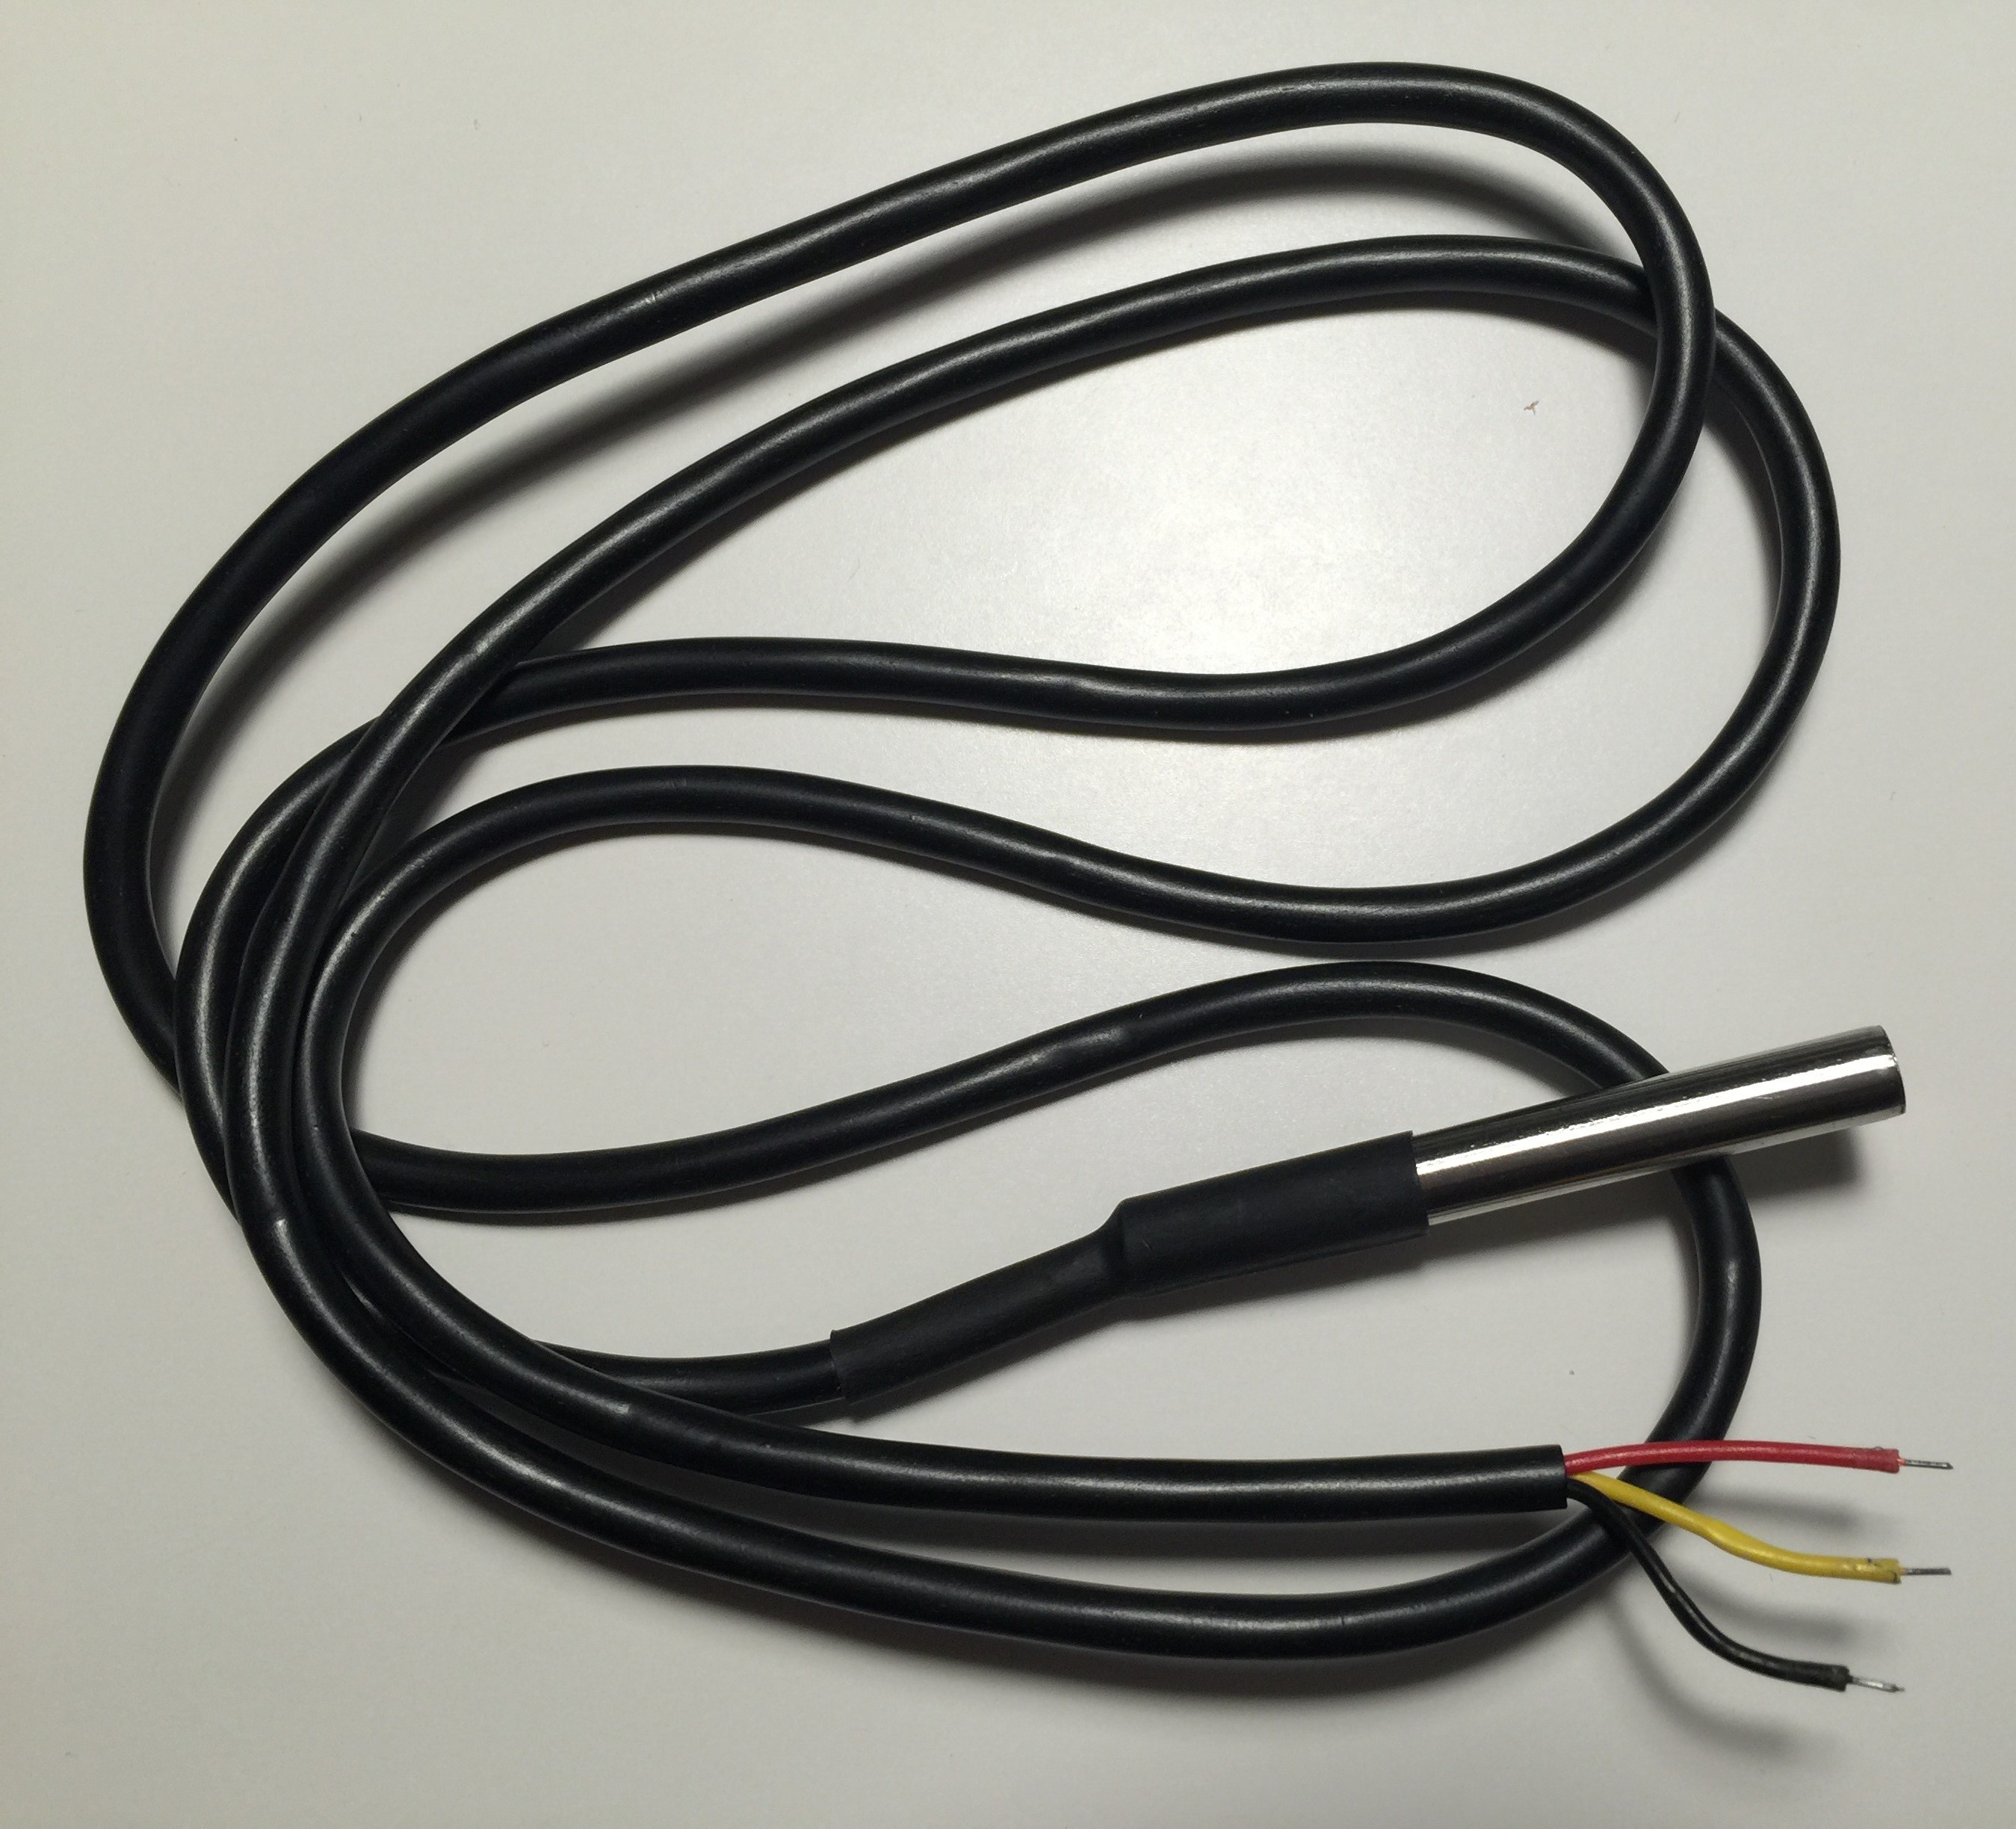
- Usable temperature range: - 55 to 125 °C
- 9 to 12 bit selectable resolution
- Uses 1-Wire interface- requires only one digital pin for communication
- Unique 64 bit ID burned into chip
- Multiple sensors can share one pin
- ± 0.5 °C Accuracy from - 10 °C to + 85 °C
- Temperature-limit alarm system
- Query time is less than 750 ms
- Usable with 3.0 V to 5.5 V power/data
- Red wire connects to 3 - 5 V, black to ground and yellow to data
Micro hot plate
Design
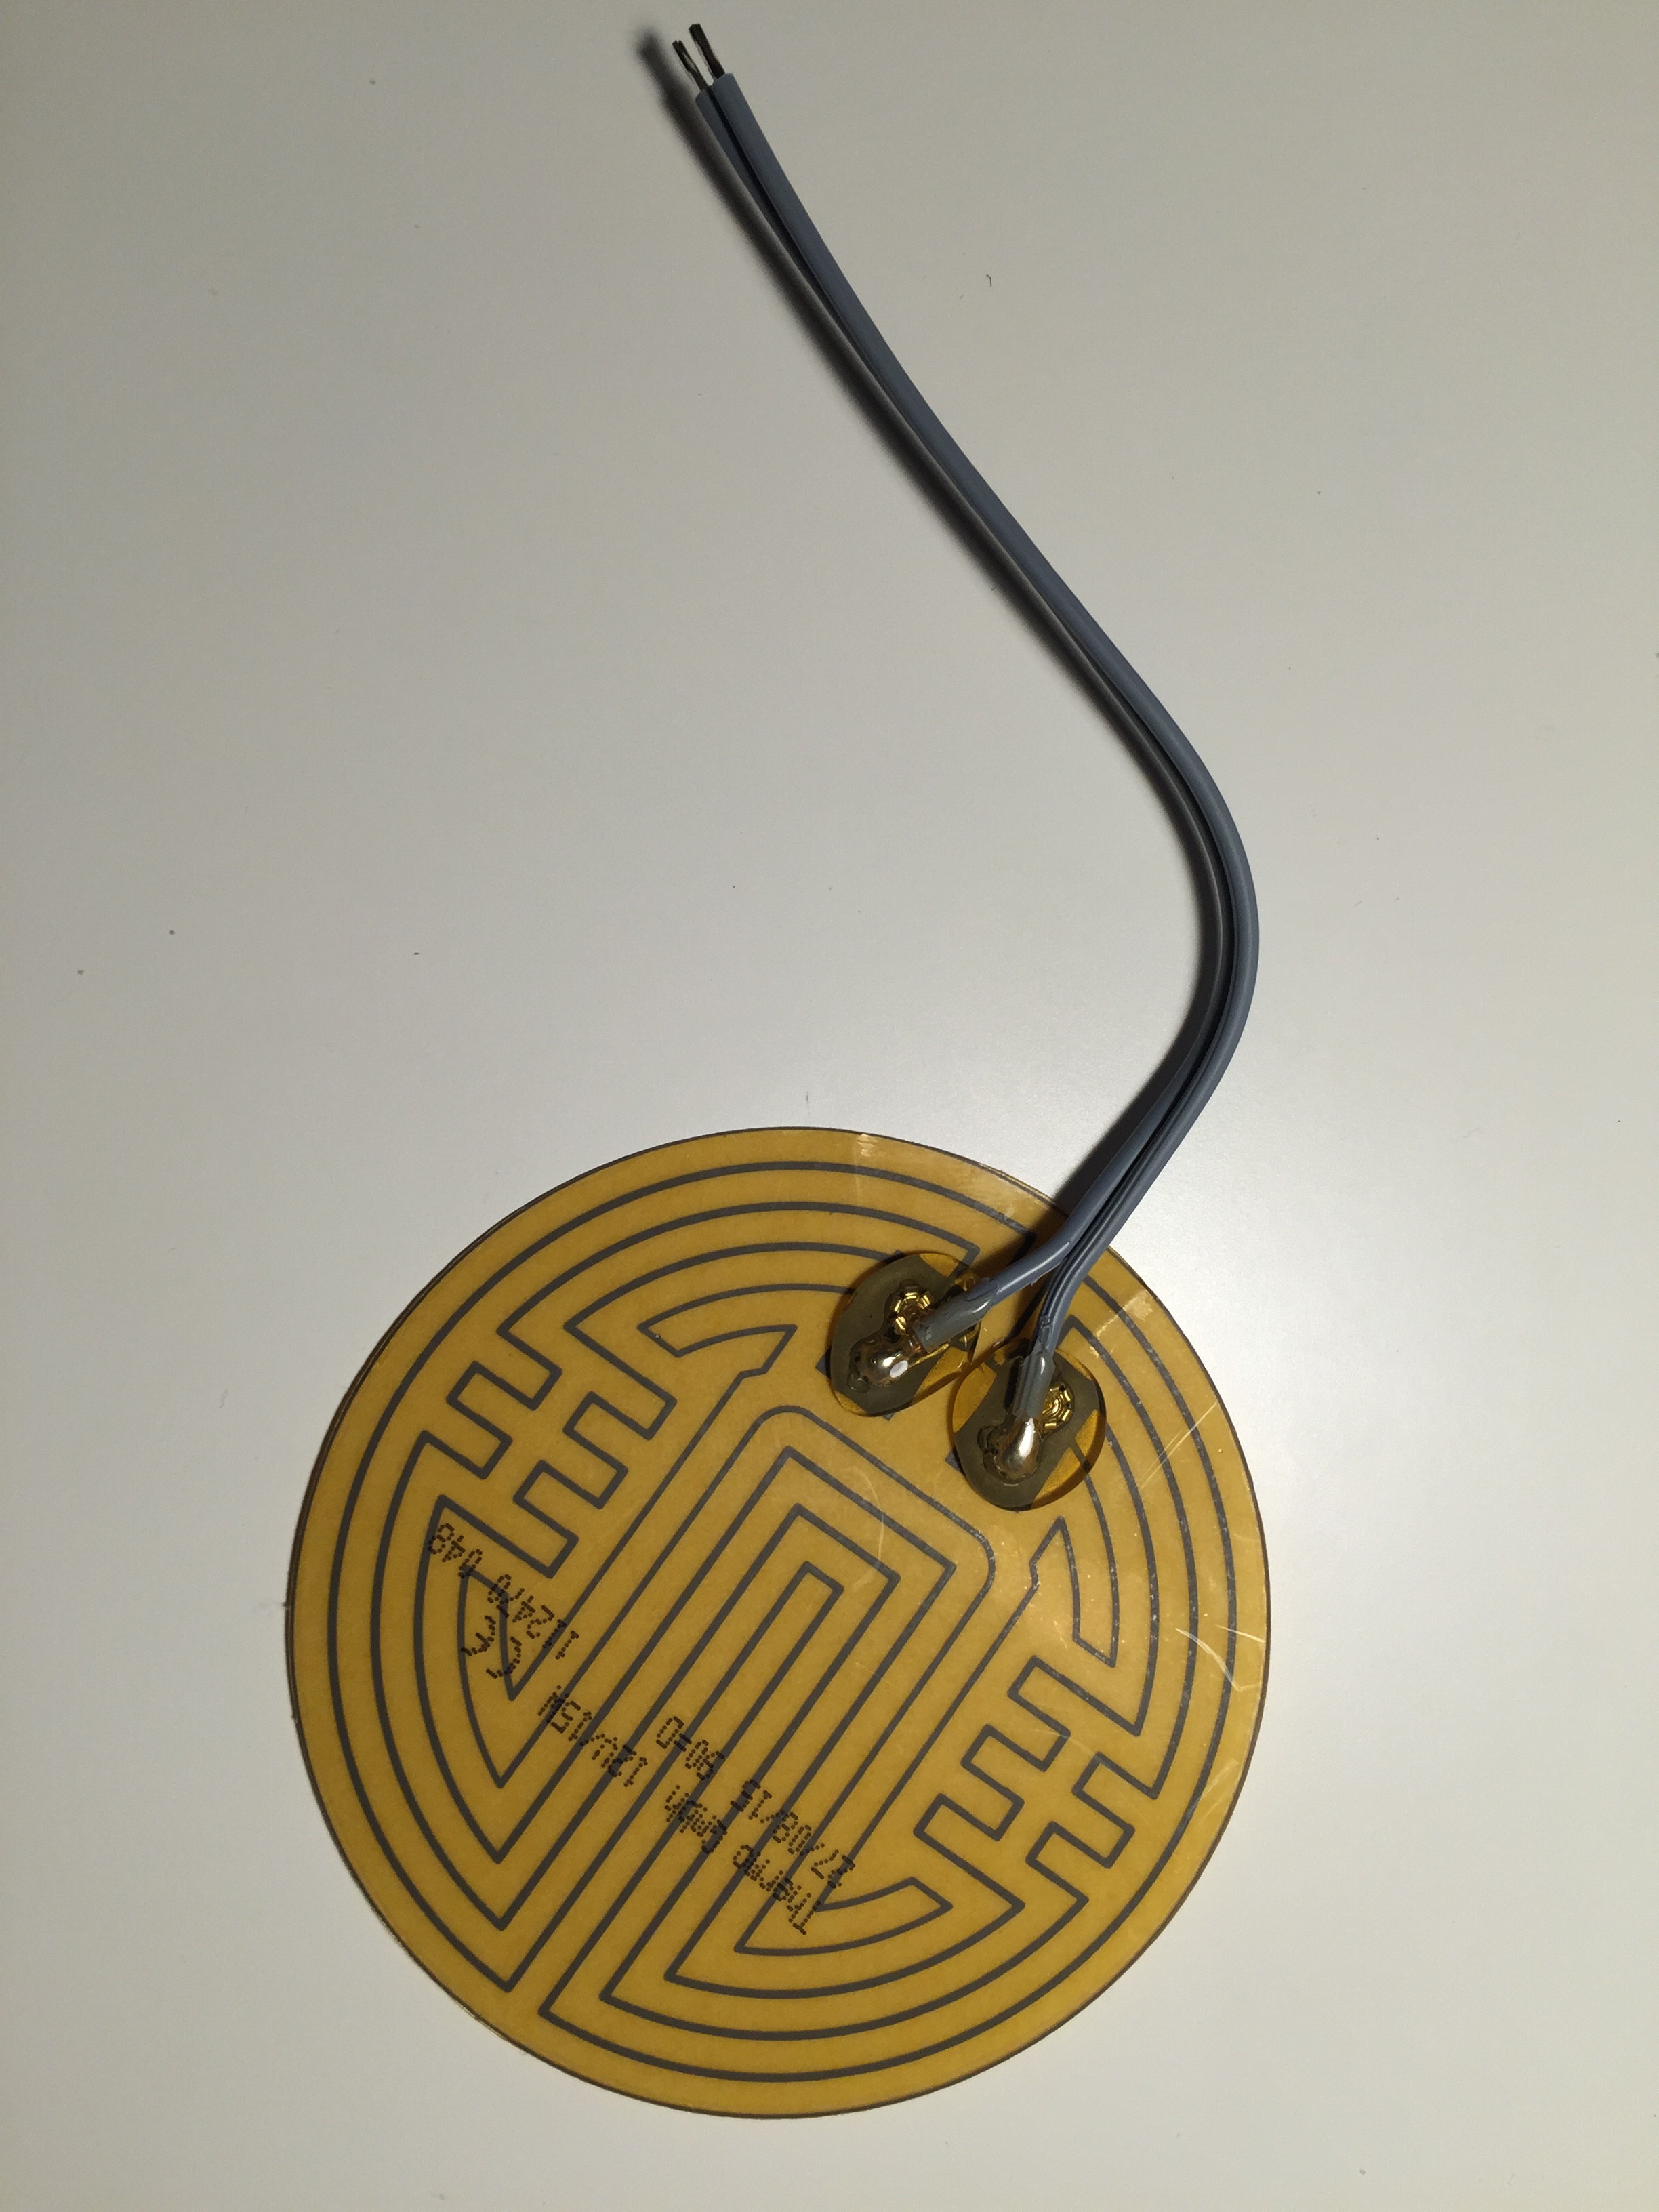
A round heating foil is used for the micro hot plate.
Fig. 1 Round heating foil, diameter 90 mm, 12 V, 15 W
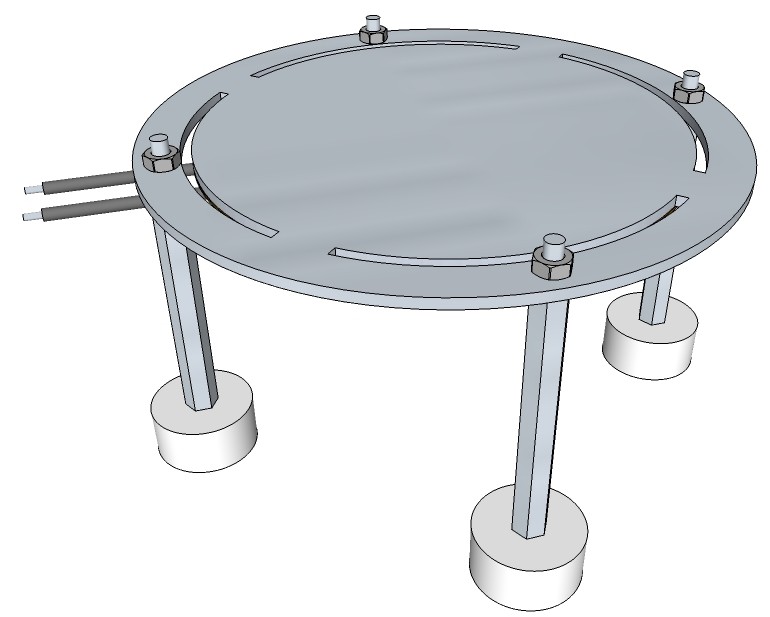
Fig. 2 Micro hot plate design, top view
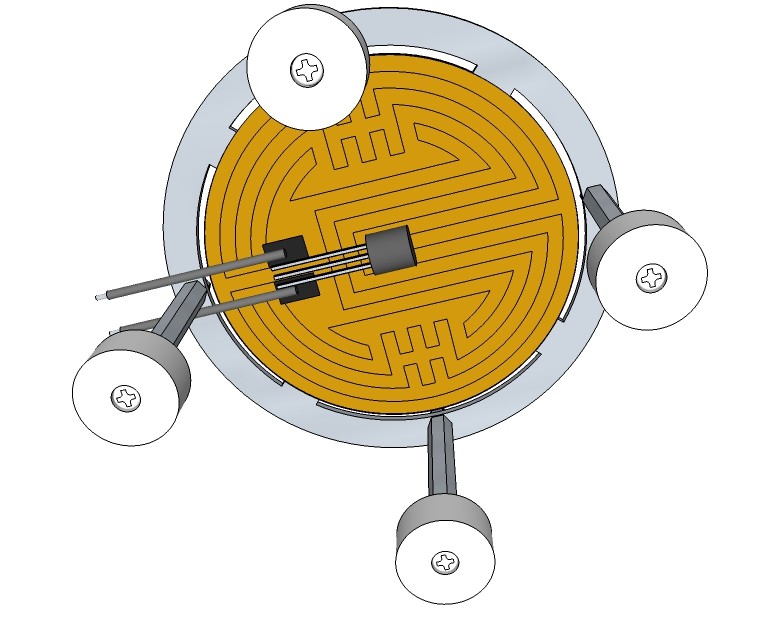
Fig. 3 Micro hot plate design, bottom view
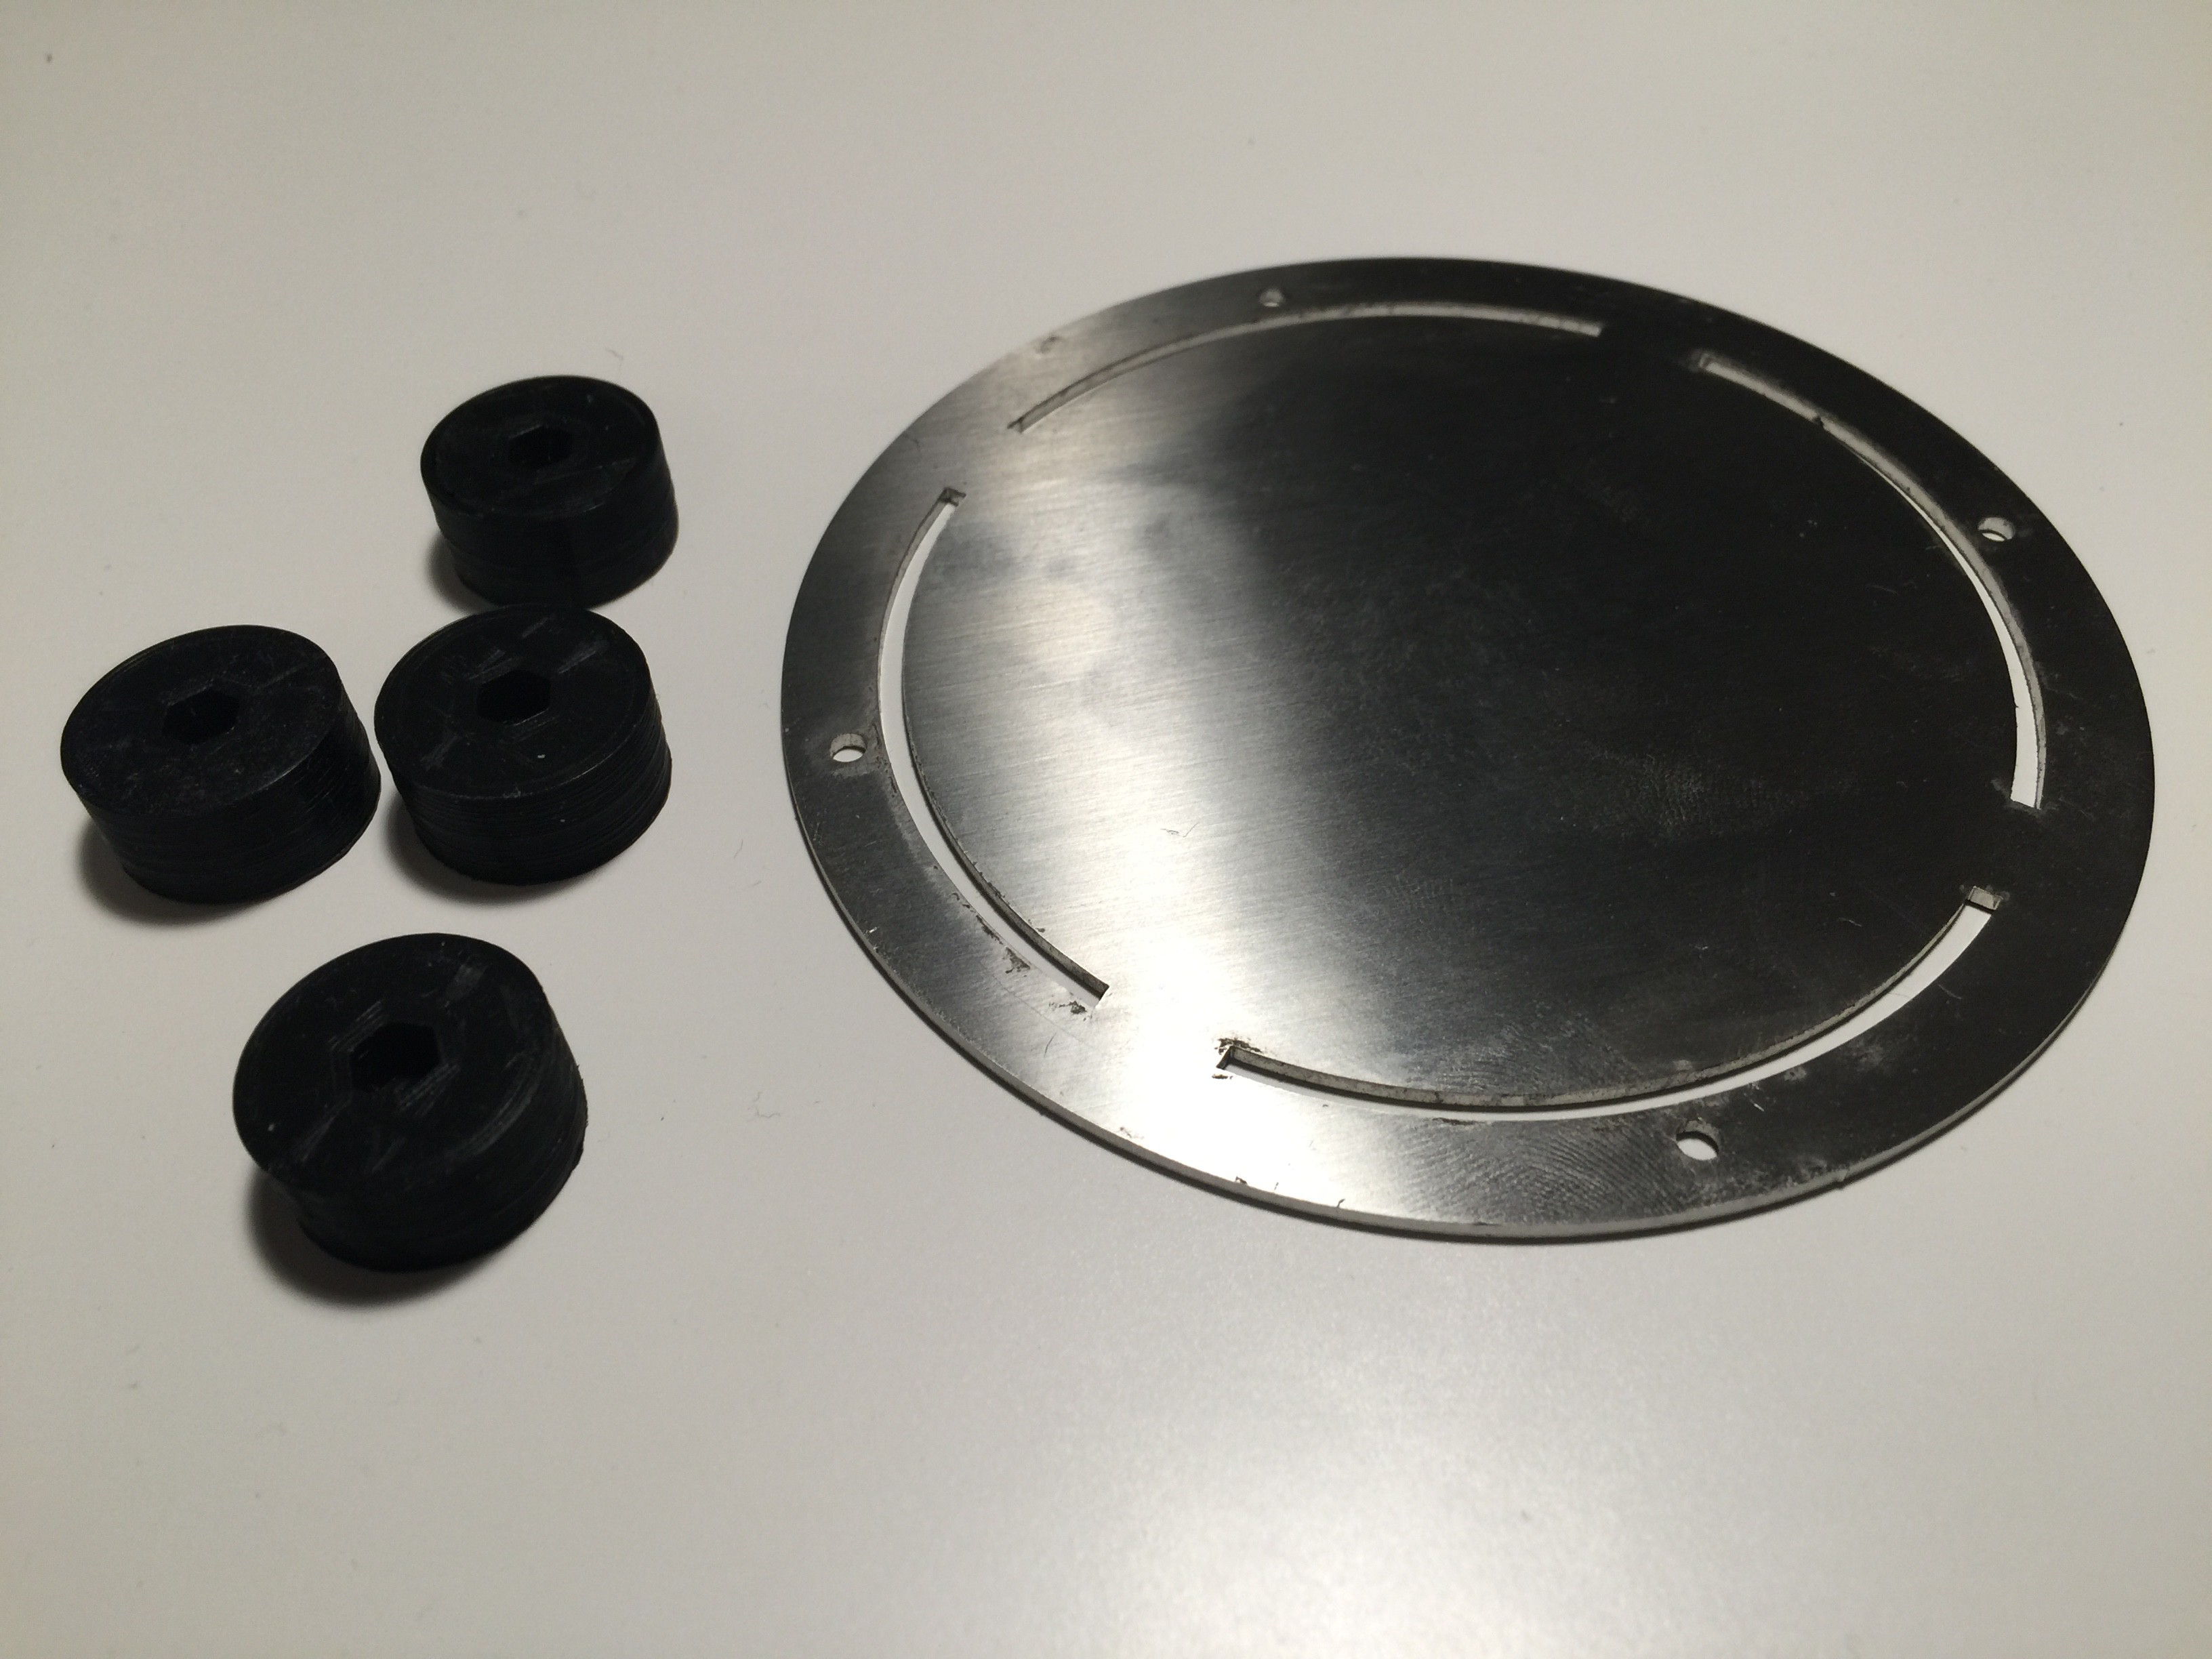
Fig. 4 3-D printed feet and laser cut hotplate (stainless steel, 1.5 mm)
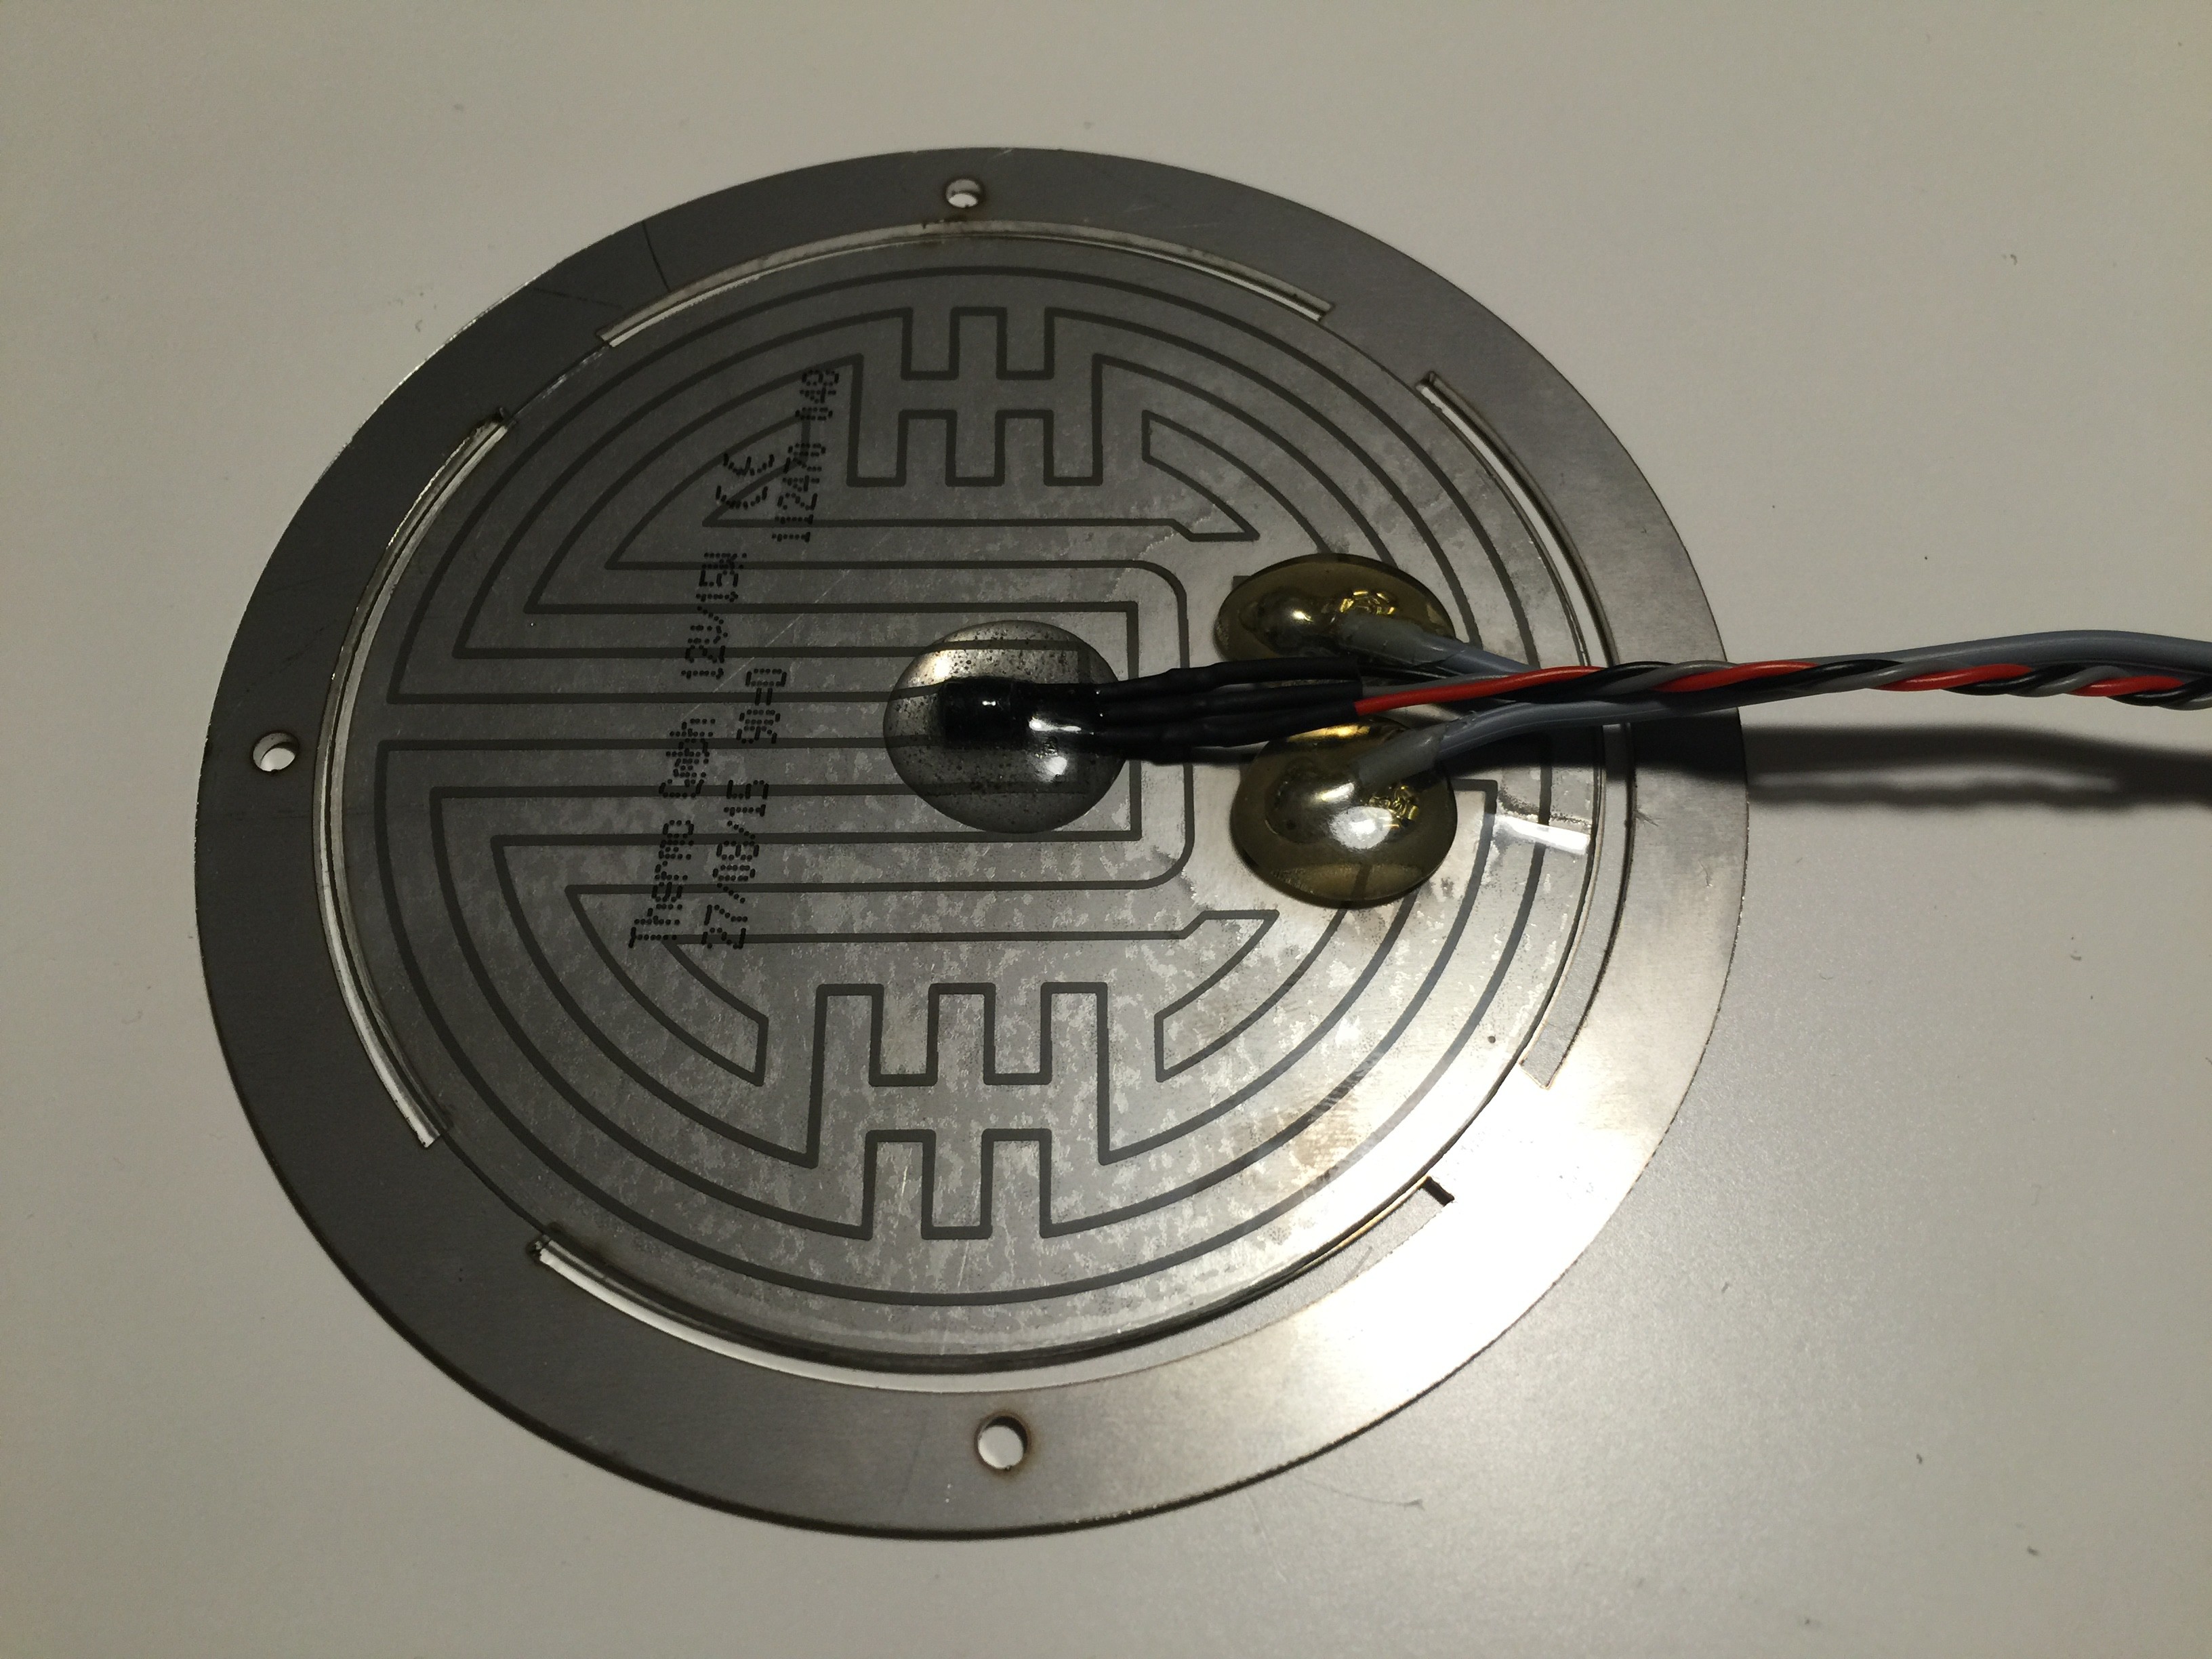
Fig. 5 Bottom side of the hot plate with heating foil and DS18B20 sensor (Glued in place by epoxy resin)
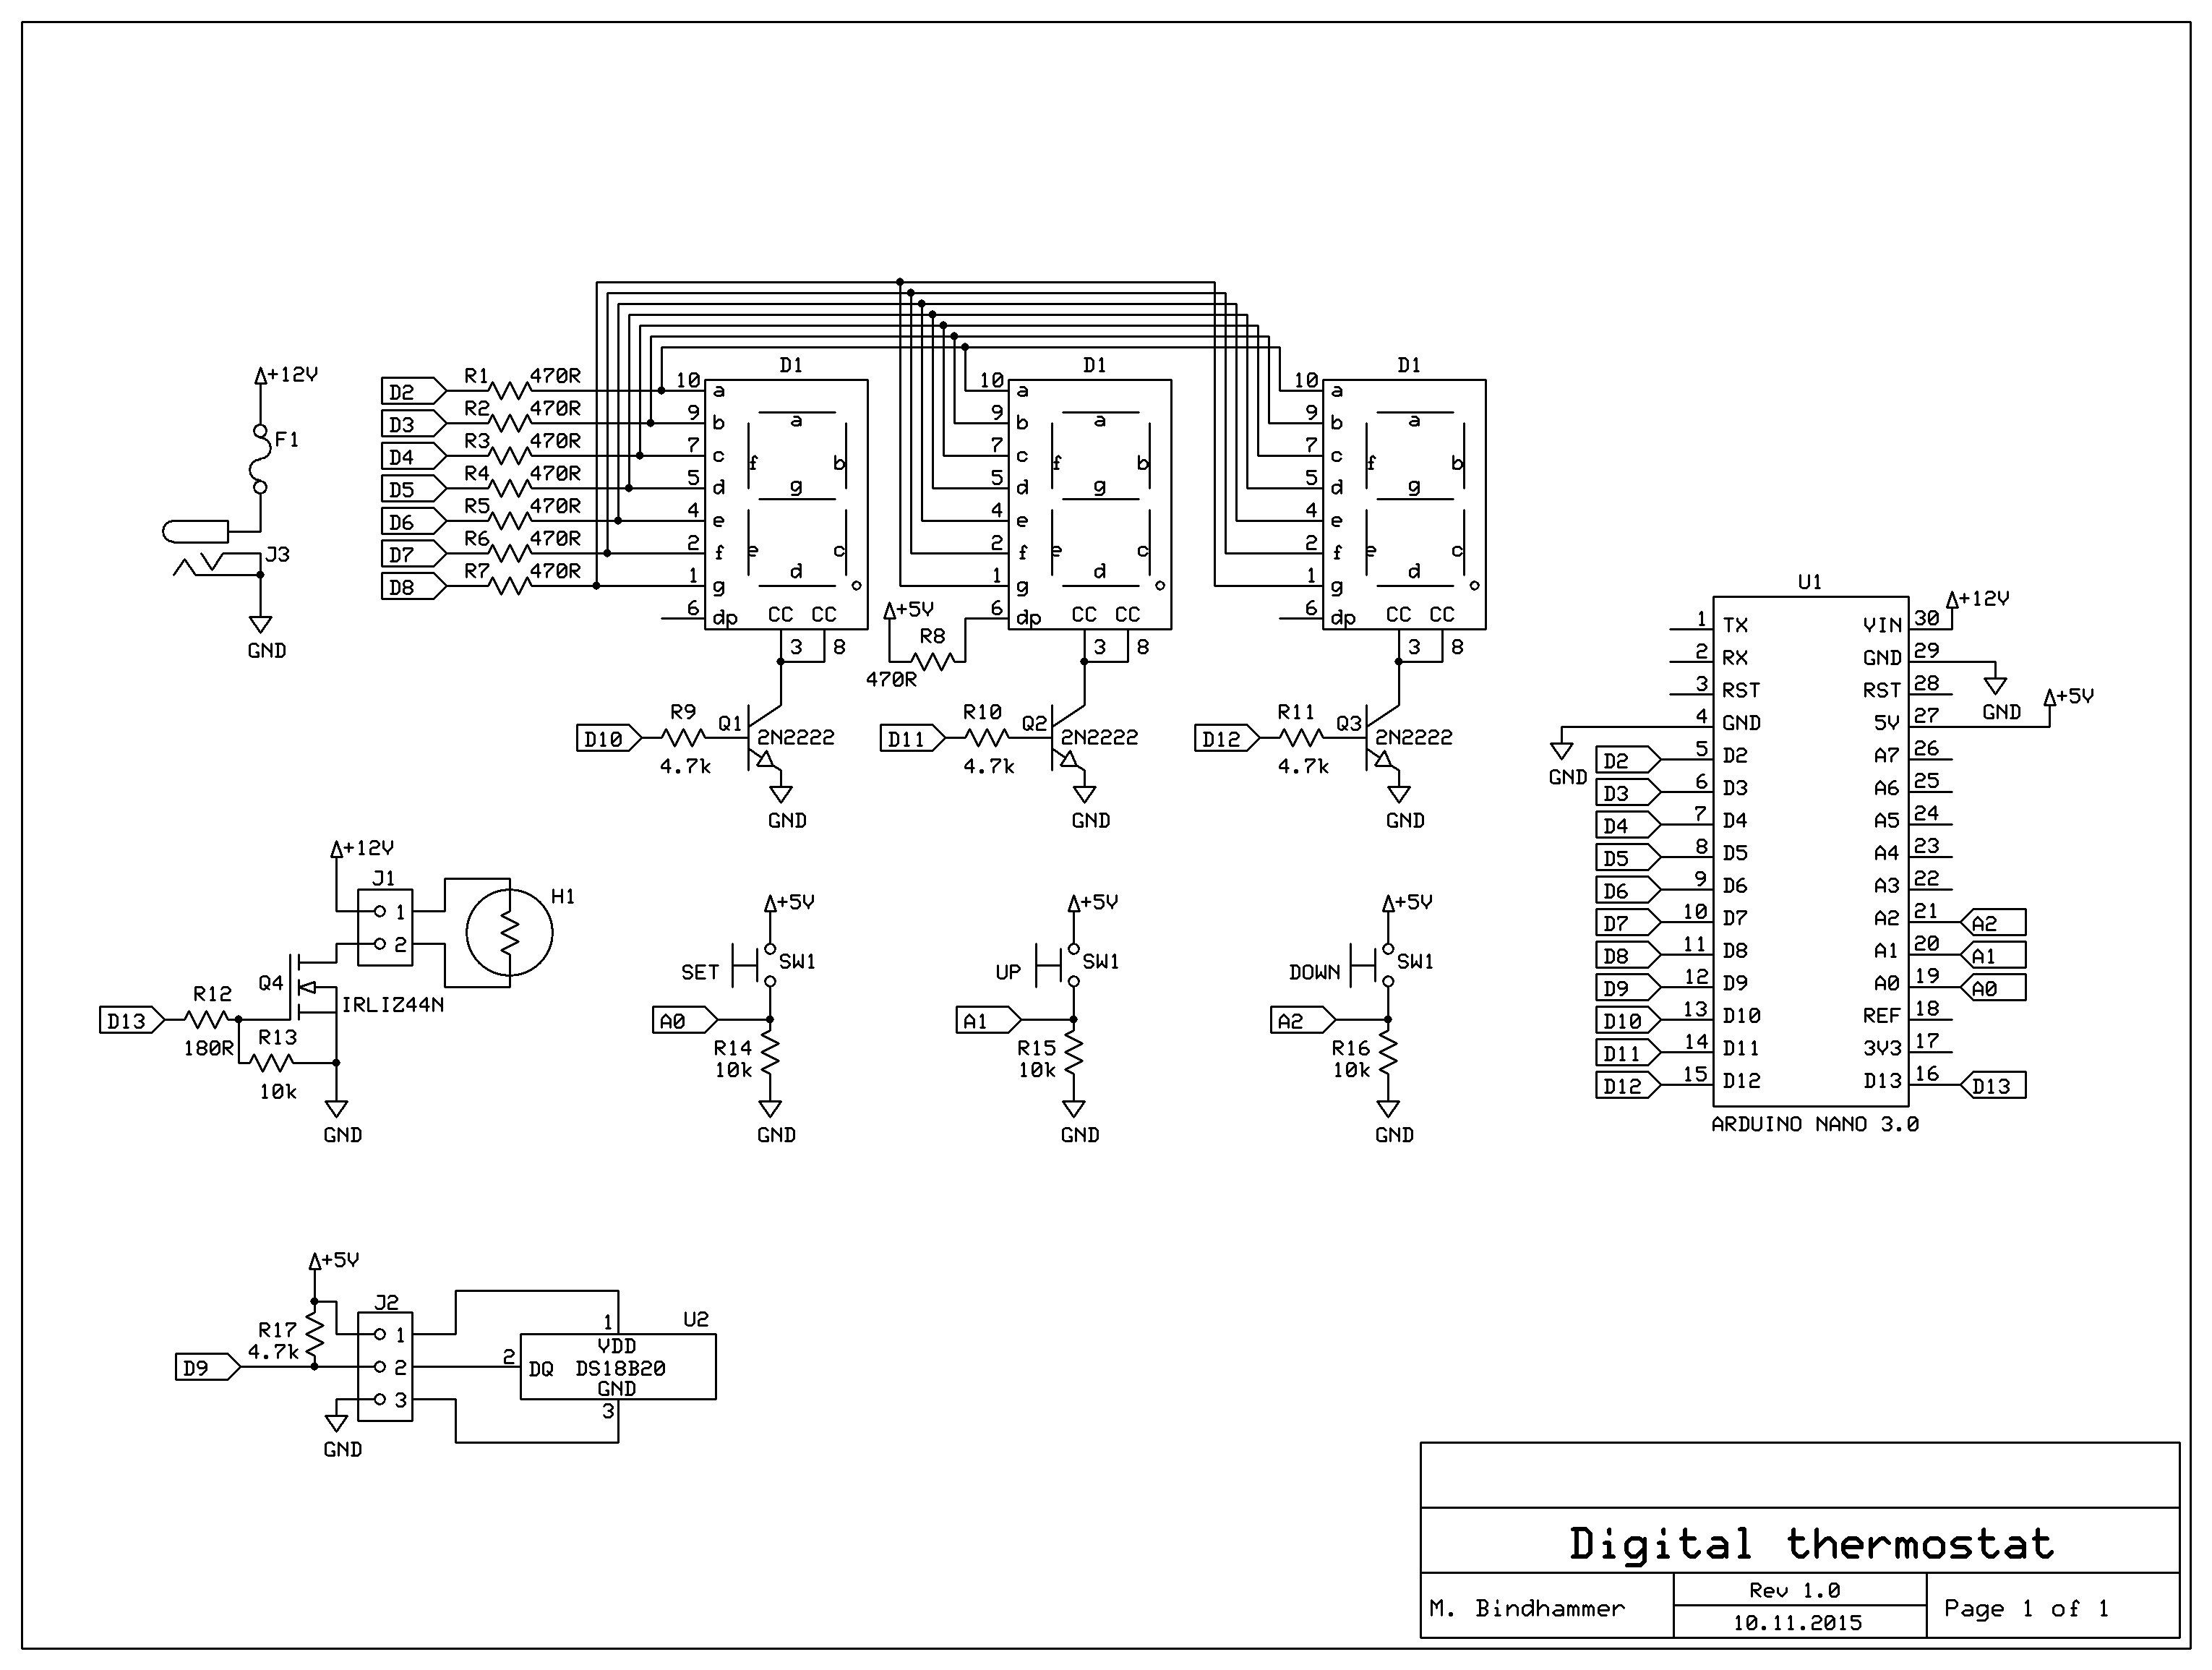
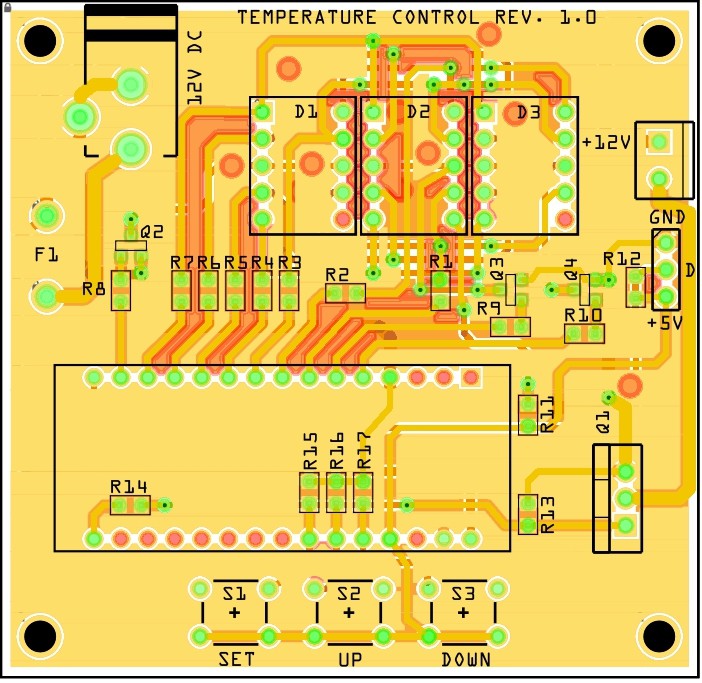
Fig. 6 Schematic of the temperature controllerFig. 7 PCB layout
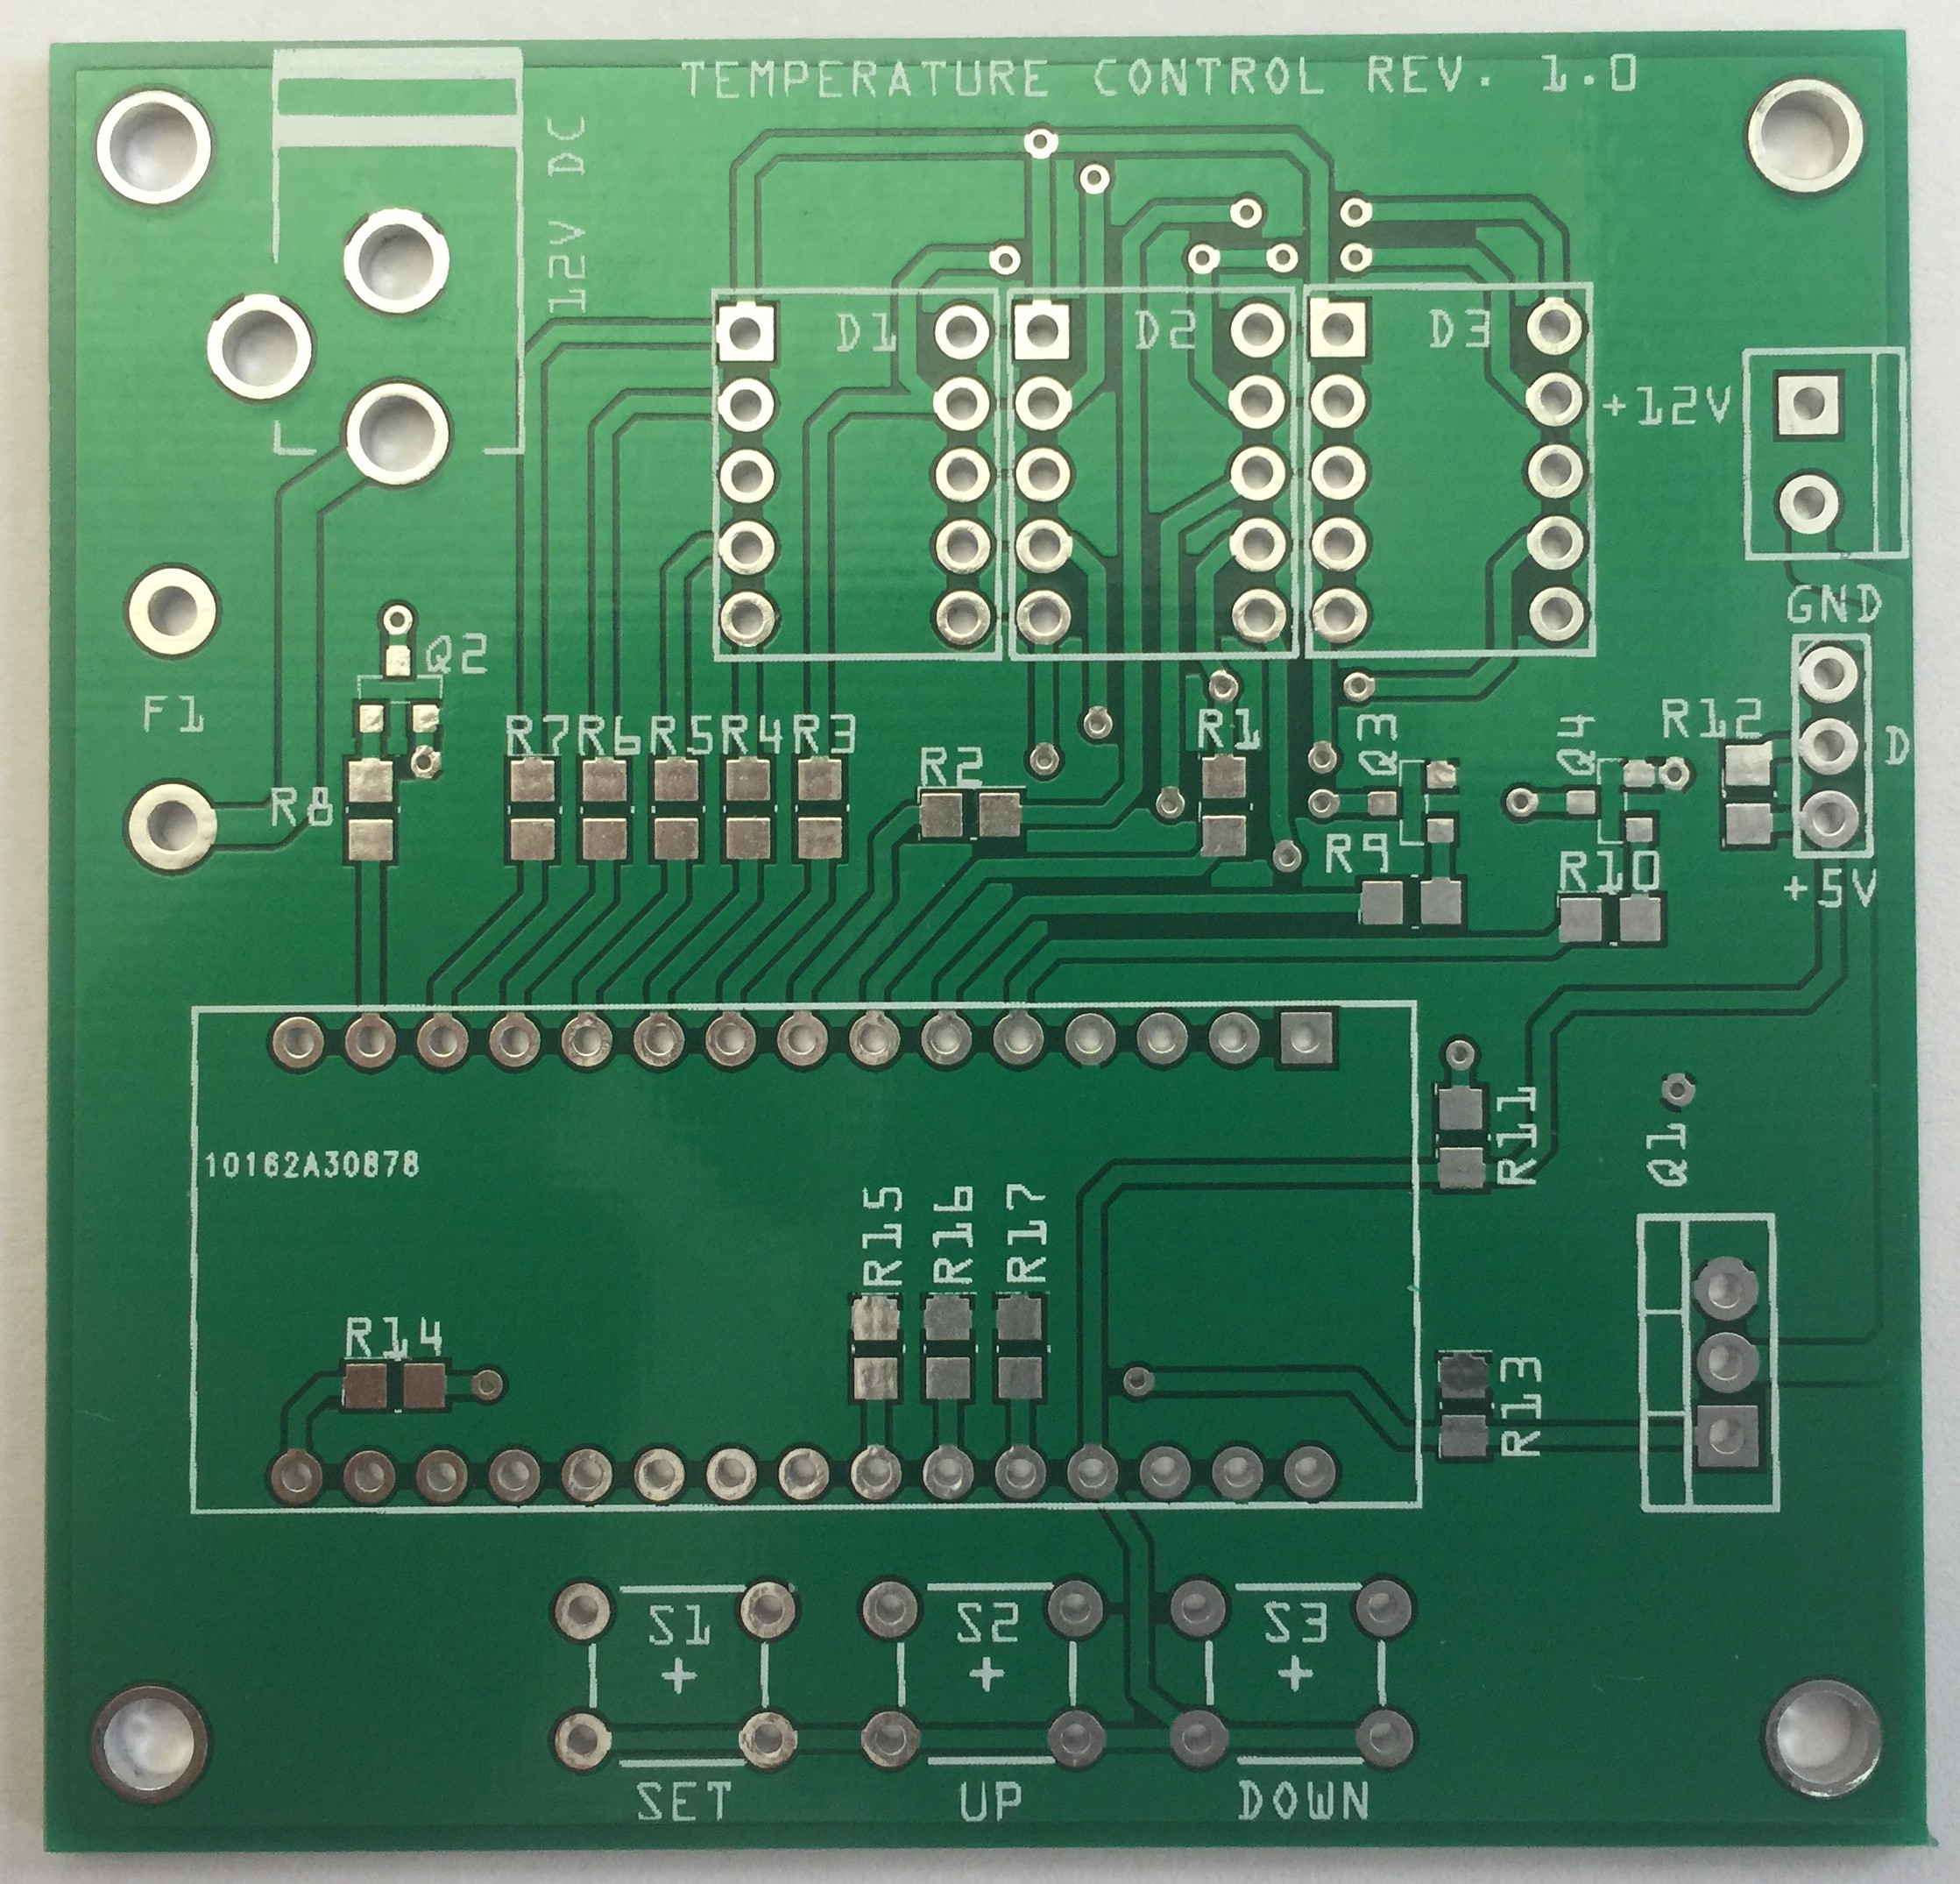
Fig. 8 PCB
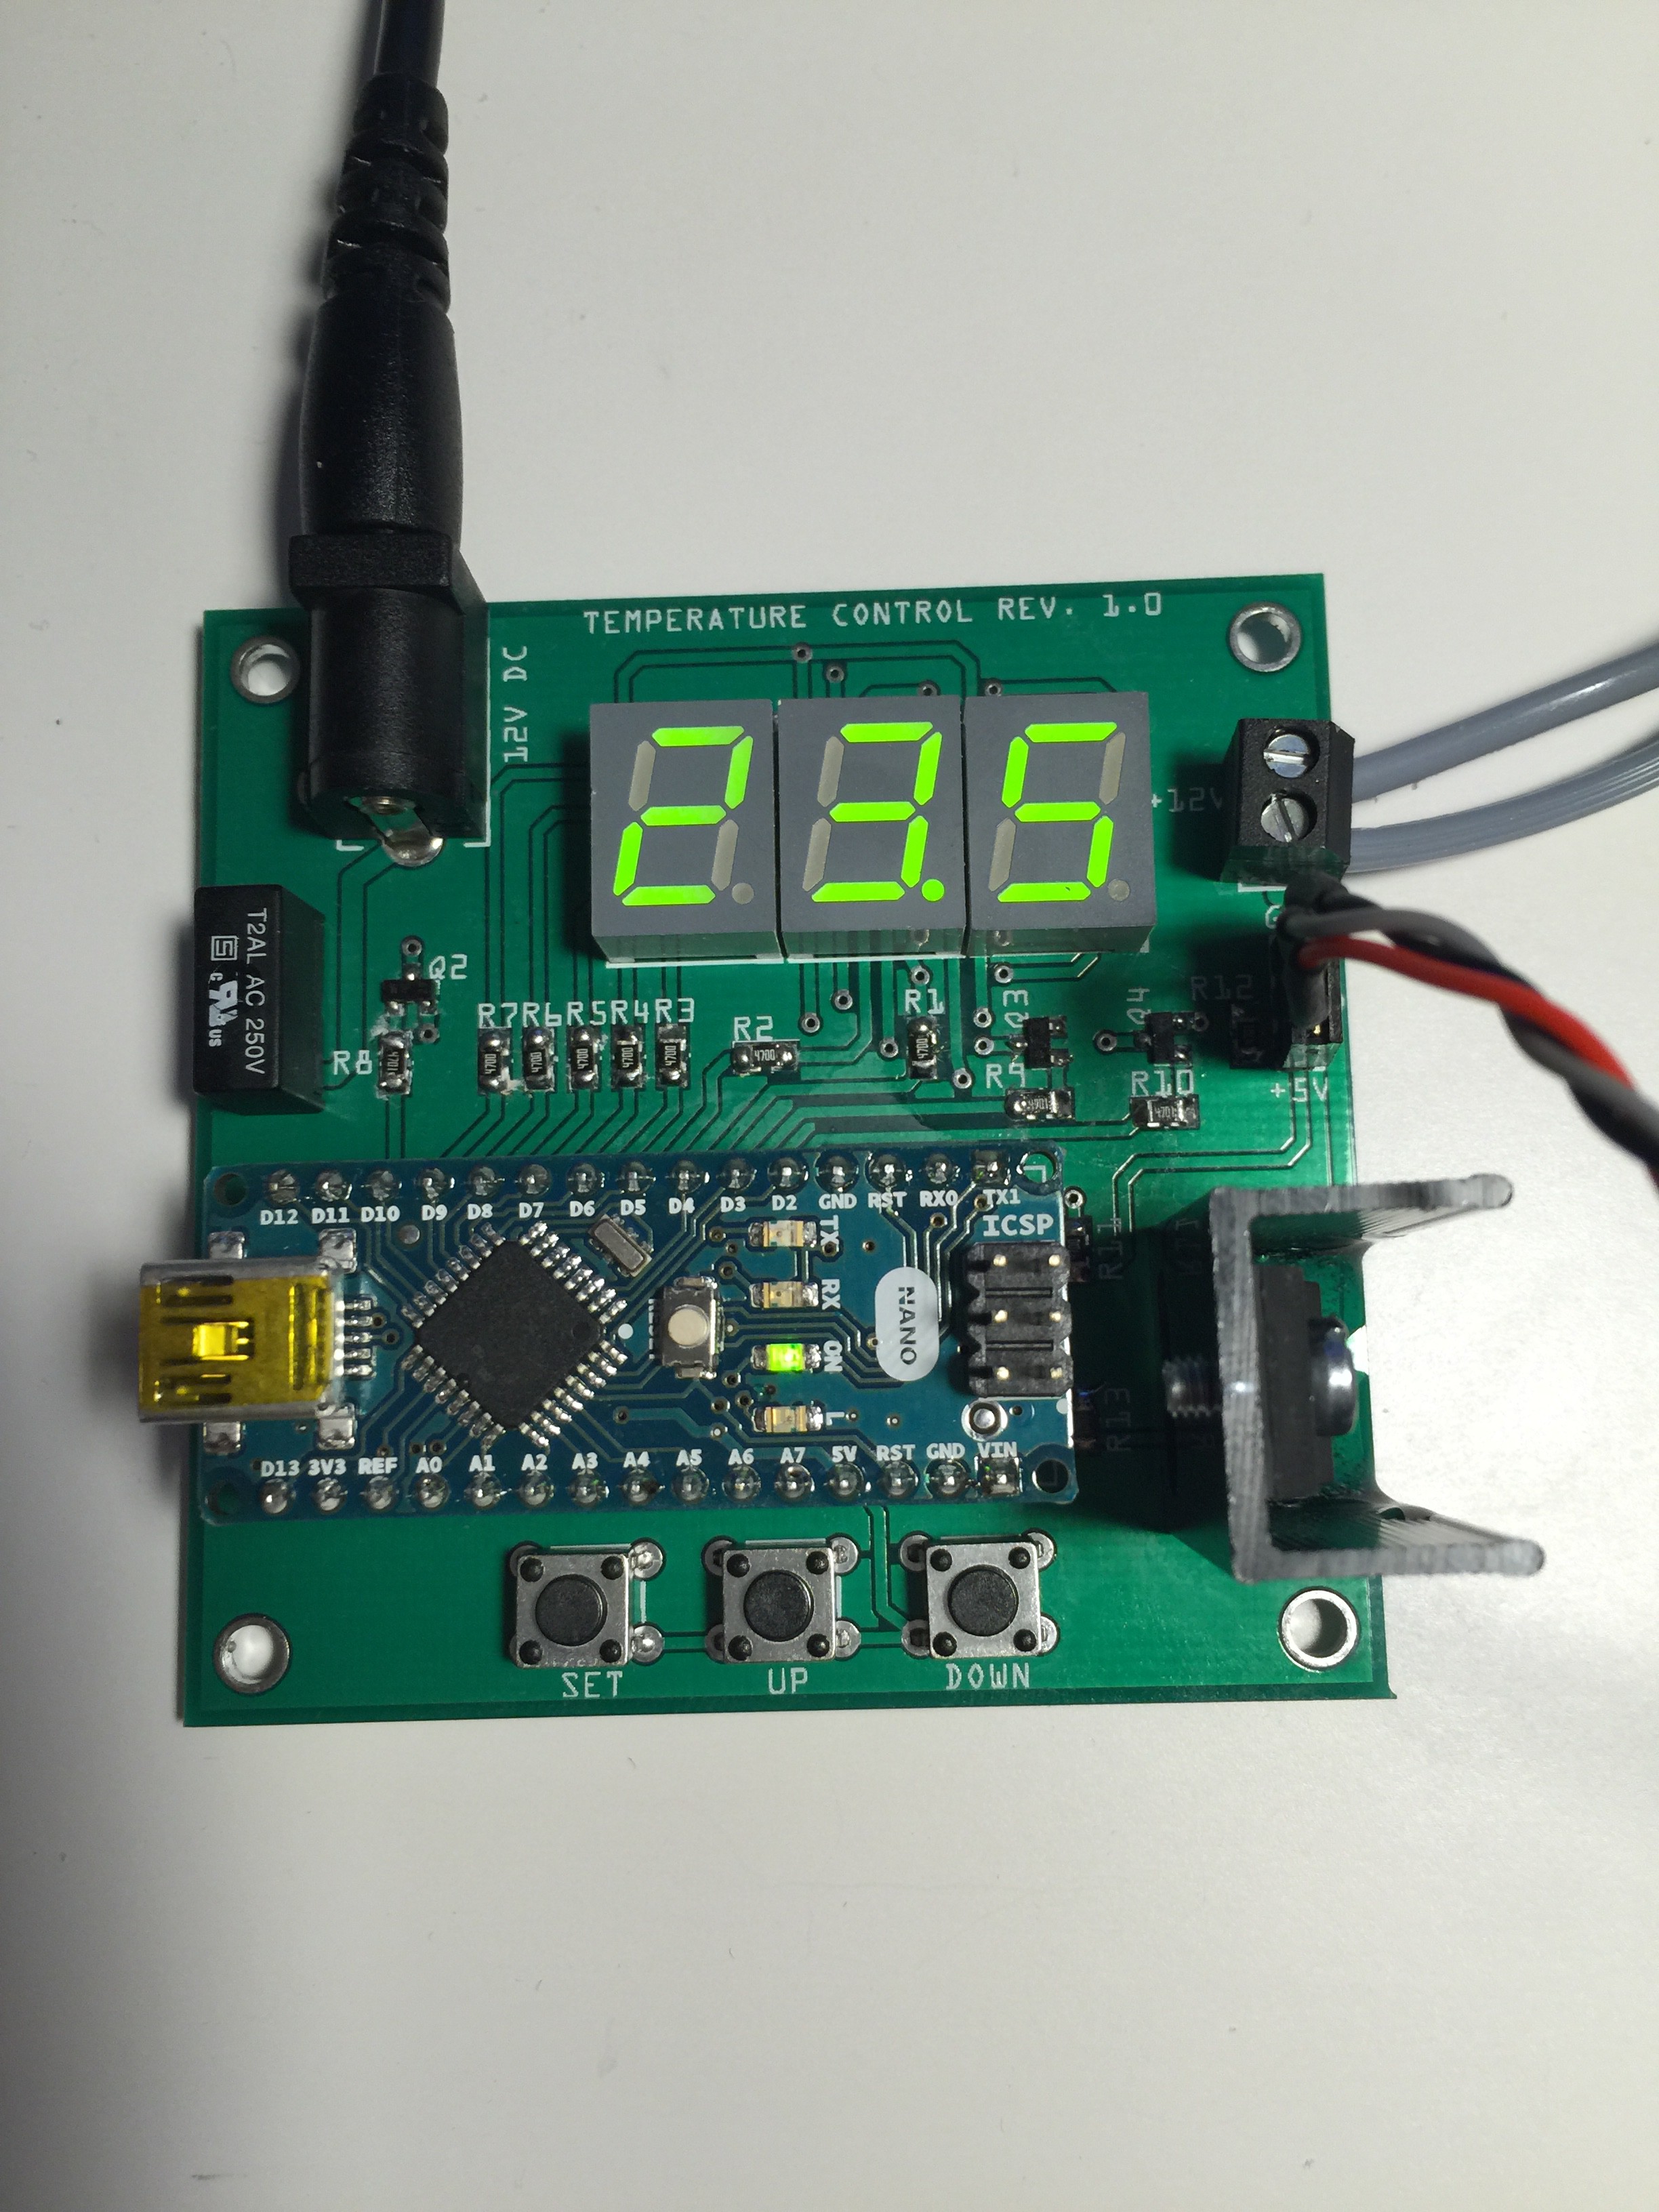
Fig. 9 Populated board
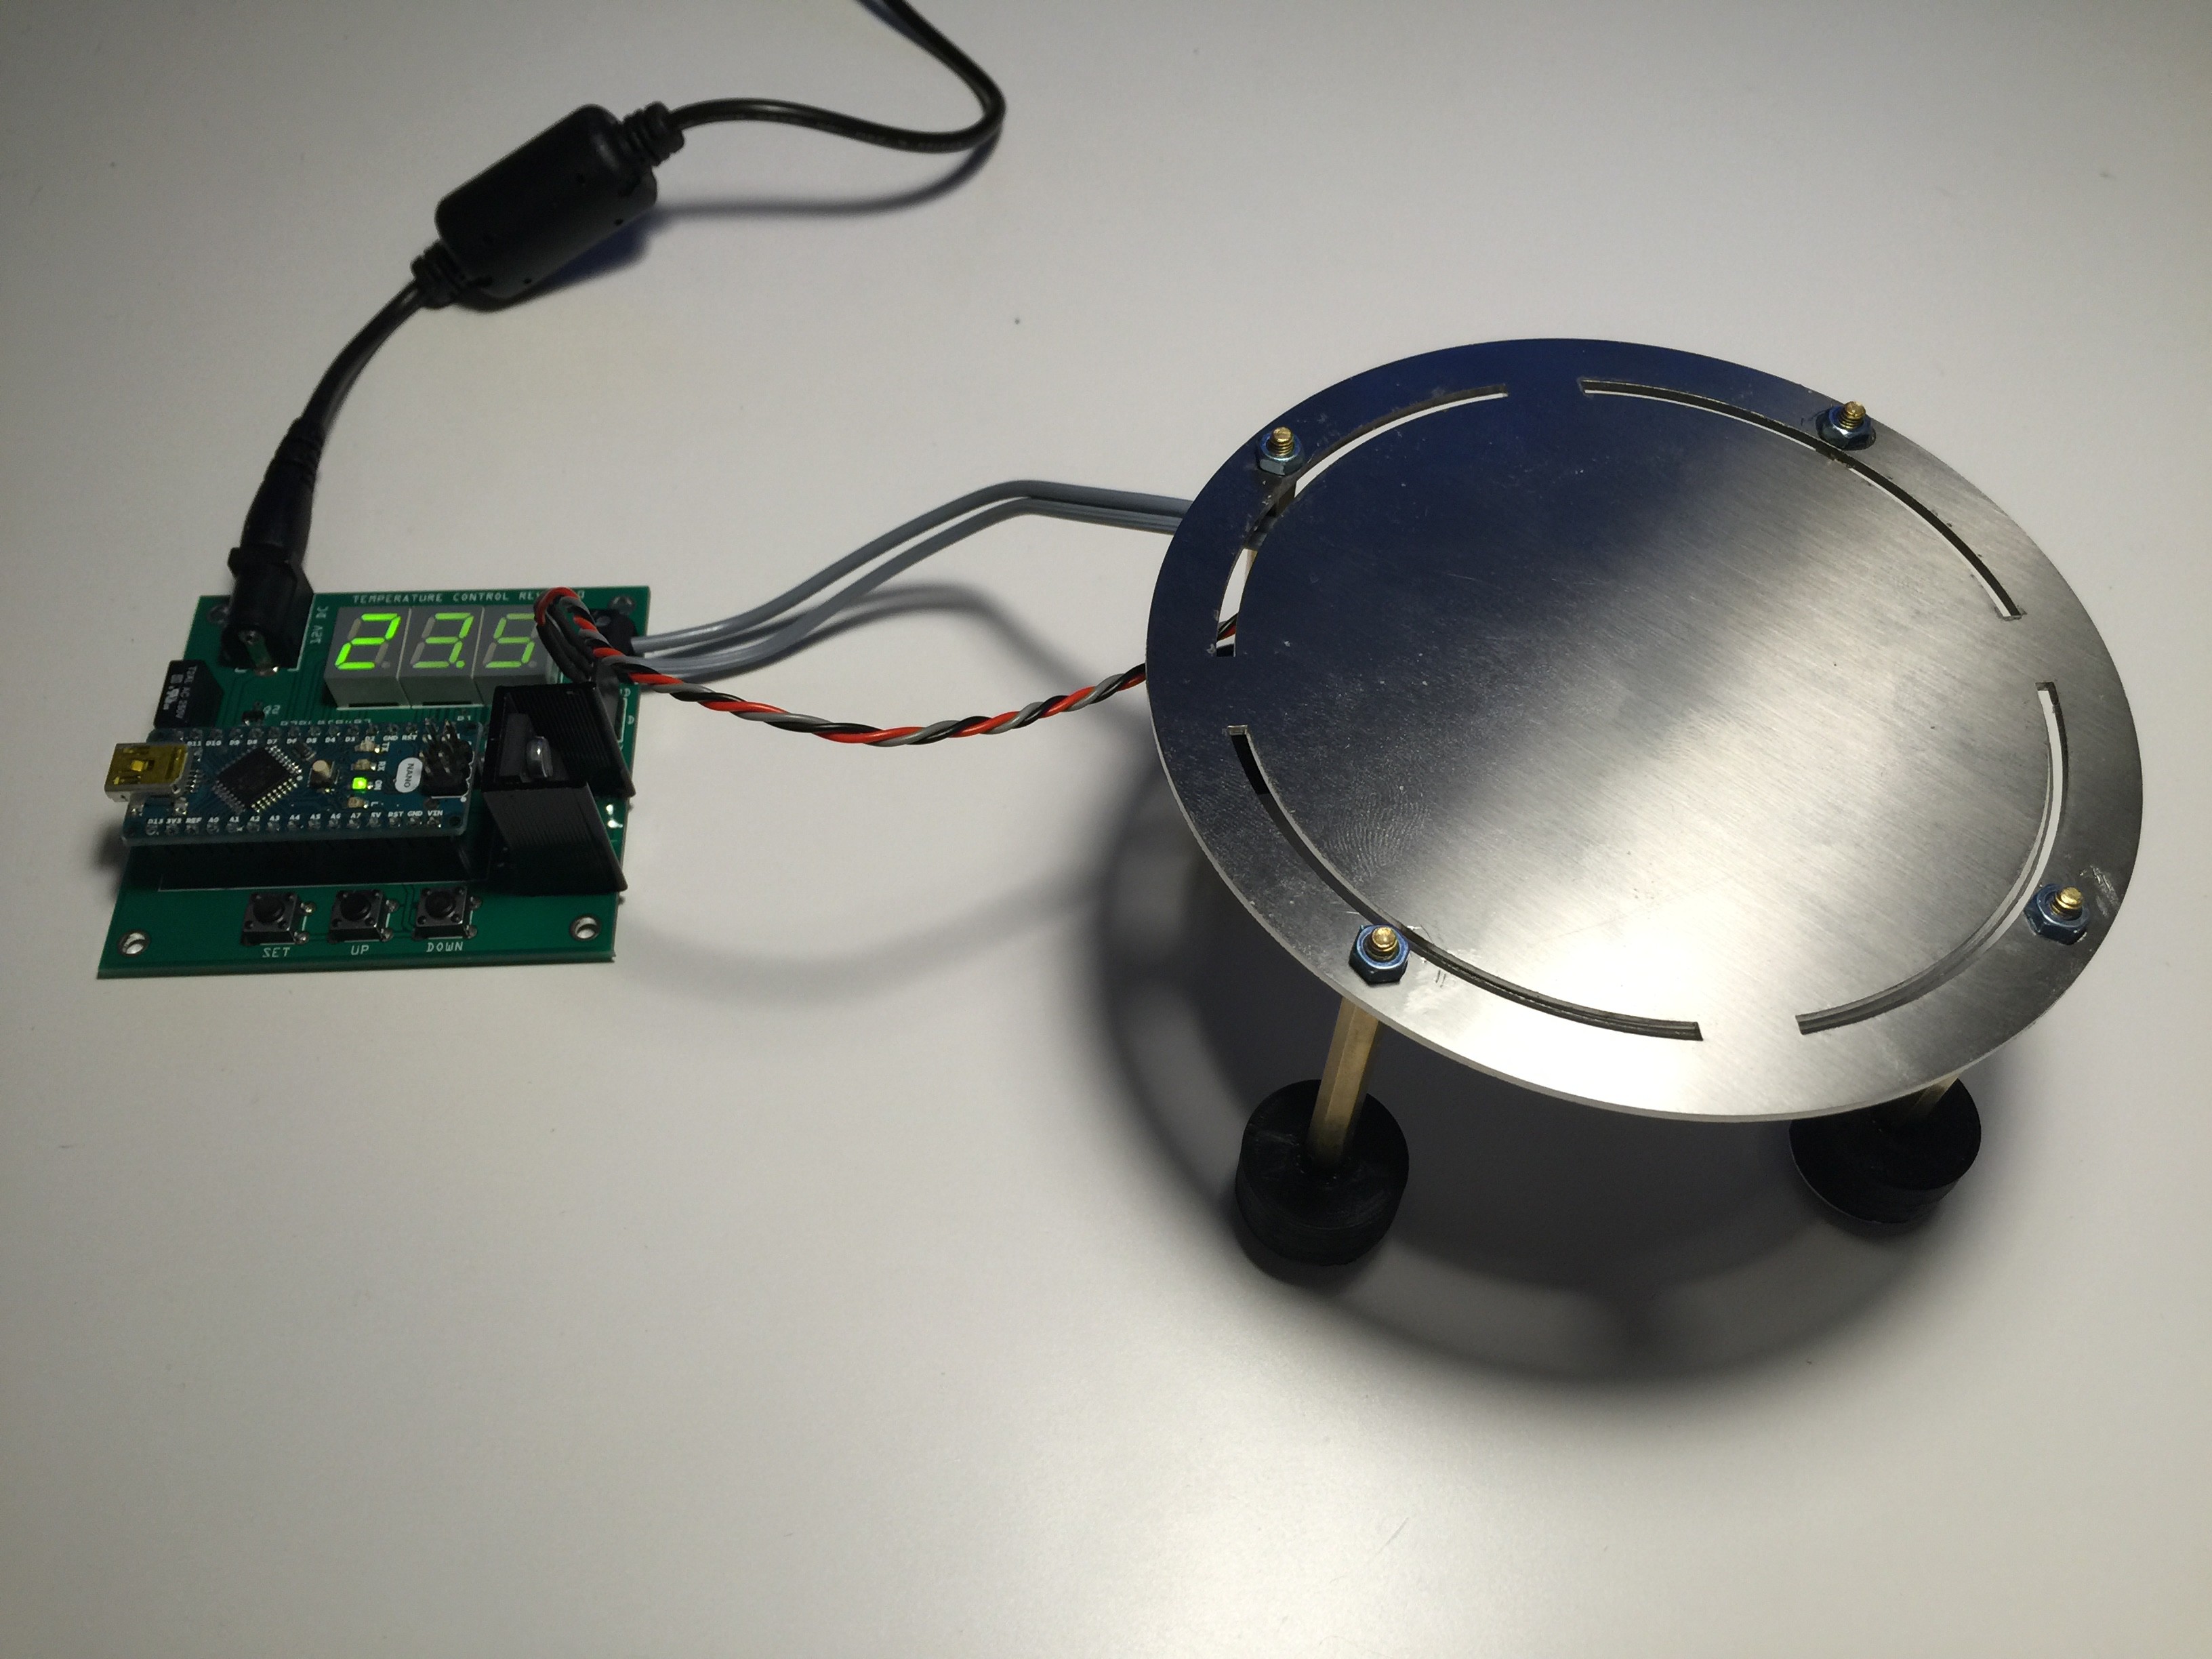
Fig. 10 Complete micro hotplate
PID controller
The output of a PID controller in the time-domain is as follows:where
u(t): Ouptut
Kp, Ki, Kp: Non-negative coefficients for the proportional, integral, and derivative terms
e = setpoint - measured vale: Error
t: time
τ: Variable of integration; takes on values from time 0 to present t
A digital implementation of a PID controller in a microcontroller requires the standard form of the PID controller to be discretized.
The integral term is approximated as
where Δt is the sampling time.
Thus
Remark: First tests with the micro hotplate revealed that a simple threshold comparison algorithm might be sufficient in most cases, providing a temperature stability of approx. ± 0.5 °C at a temperature range of 30 - 70 °C.
Example code
#include <OneWire.h>
#include <DallasTemperature.h>

#define ONE_WIRE_BUS 12 // DQ connected to D12
OneWire oneWire(ONE_WIRE_BUS); // setup a oneWire instance to communicate with DS18B20
DallasTemperature sensors(&oneWire); // pass oneWire reference to Dallas Temperatur

unsigned int tempSet = 200; // Initialization with 20 °C at startup
boolean heat_up = false;

// 2-dimensional array to hold the LED bit patterns
byte seven_seg_digits[10][7] =
  {{1,1,1,1,1,1,0}, // 0
  {1,0,1,0,0,0,0},  // 1
  {0,1,1,1,1,0,1},  // 2
  {1,1,1,1,0,0,1},  // 3
  {1,0,1,0,0,1,1},  // 4
  {1,1,0,1,0,1,1},  // 5
  {1,1,0,1,1,1,1},  // 6
  {1,1,1,0,0,0,0},  // 7
  {1,1,1,1,1,1,1},  // 8
  {1,1,1,1,0,1,1}}; // 9

void setup() {
  sensors.begin(); // start up the library
  pinMode(2,OUTPUT); // multiplexing transistor digit 3
  pinMode(3,OUTPUT); // multiplexing transistor digit 2
  pinMode(4,OUTPUT); // Segment c
  pinMode(5,OUTPUT); // Segment a
  pinMode(6,OUTPUT); // Segment b
  pinMode(7,OUTPUT); // Segment d
  pinMode(8,OUTPUT); // Segment e
  pinMode(9,OUTPUT); // Segment f
  pinMode(10,OUTPUT); // Segment g
  pinMode(11,OUTPUT); // multiplexing transistor digit 1
  pinMode(13,OUTPUT); // MOSFET
}

void loop() {
  if(heat_up == false) segDisplay(tempSet);
  if(heat_up == true) {
    sensors.requestTemperatures();
    int temperature = int(sensors.getTempCByIndex(0) * 10);
    if(sensors.getTempCByIndex(0) < 10.0) temperature = 100;
    if(sensors.getTempCByIndex(0) > 99.5) temperature = 995;
    segDisplay(temperature);
    float tempFloat = float(tempSet) / 10.0;
    if(sensors.getTempCByIndex(0) > 90.0) {
      digitalWrite(13, LOW);
      while(1); // for safety, max rating for heating foil is 95 °C
    }
    if(sensors.getTempCByIndex(0) < tempFloat) digitalWrite(13, HIGH);
    else digitalWrite(13, LOW);
  }
  // DOWN button pressed
  if(analogRead(7) > 1000 && tempSet > 200) {
    tempSet -= 5;
    heat_up = false;
    digitalWrite(13, LOW);
  }
  // UP button pressed
  if(analogRead(6) > 1000 && tempSet < 700) {
    tempSet += 5;
    heat_up = false;
    digitalWrite(13, LOW);
  }
  // SET button pressed
  if(analogRead(5) > 1000) heat_up = true;
}

// function to pass a 3-digit integer to 7-segment display
void segDisplay(int value) {
  // for loop is used to debounce push buttons
  for(unsigned int i = 0; i < 20; i ++) {
    byte digit_3 = value %10; // compute 3rd digit
    sevenSegWrite(digit_3);
    digitalWrite(2, HIGH); // enable 7-segment 3
    delay(5);
    digitalWrite(2, LOW); // disable 7-segment 3
    byte digit_2 = (value / 10) %10; // compute 2nd digit
    sevenSegWrite(digit_2);
    digitalWrite(3, HIGH); // enable 7-segment 2
    delay(5);
    digitalWrite(3, LOW); // disable 7-segment 2
    byte digit_1 = (value / 100) %10; // compute 1st digit
    sevenSegWrite(digit_1);
    digitalWrite(11, HIGH); // enable 7-segment 1
    delay(5);
    digitalWrite(11, LOW); // disable 7-segment 1
  }
}

// function to pass a 1-digit integer to 7-segment display
void sevenSegWrite(byte digit) {
  byte pin = 4;
  for (byte segCount = 0; segCount < 7; ++ segCount) {
    digitalWrite(pin, seven_seg_digits[digit][segCount]);
    ++ pin;
  }
}
 M. Bindhammer