DeepSOIC
-
Attempts at explaining oscillation
04/23/2016 at 23:33 • 0 commentsI had two guesses at the reasons that may cause the oscillation of light output of the laser diode, that happens at high currents.
1. excitation of next mode. At low power, the lasing will happen at the frequency where the conditions are the most favourable. However, as the power is increased, other modes of resonator may come into play. Sum of two sinusoids at close frequencies manifests as beating, which might be what I observe.
2. oscillation may be caused by the onset of catastrophic optical damage. Say, the thermal runaway starts. It causes increased absorption, which reduces light intensity in lasing cavity. Reduced intensity causes thermal runaway to abort, and then it happens over and over again.
I can relatively easily rule out possibility 1. I am observing "beating" at frequencies of a few MHz. I can easily calculate the first beat frequency.
Wavelength of emission is about 650 nm. The length of crystal is about 0.3 mm, so is the length of cavity. That means the optical path of one loop of light travel is 2*0.3mm*3.49 (3.49 is refraction index, and 2 is because a full loop is a travel back and forth). And I get that in the path length, 3200 full waves fit. So, the lowest beat frequency is the frequency of emission light divided by 3200. That yields 143 GHz. That's way higher than what I observe.
I haven't yet come up with a way to proof or disproof explanation 2....
-
Catastrophic optical damage
04/23/2016 at 23:07 • 0 commentsThere were a few people here bringing attention to a possibility to kill a laser even with a very short pulse. Suddenly, I found a Wikipedia page about it: Catastrophic optical damage. Enjoy.
The article still refers to heat as the final reason of mirror death, but the thing is about local thermal runaway. It somewhat reminded me of a secondary breakdown phenomenon in bipolar transistors (BJTs).
-
consequences
03/03/2016 at 17:31 • 1 commentWhen I was playing with the laser, I aimed my phone camera at it. The laser was operating in pulsed mode, with low average power but high peak power. I didn't notice any damage back then.
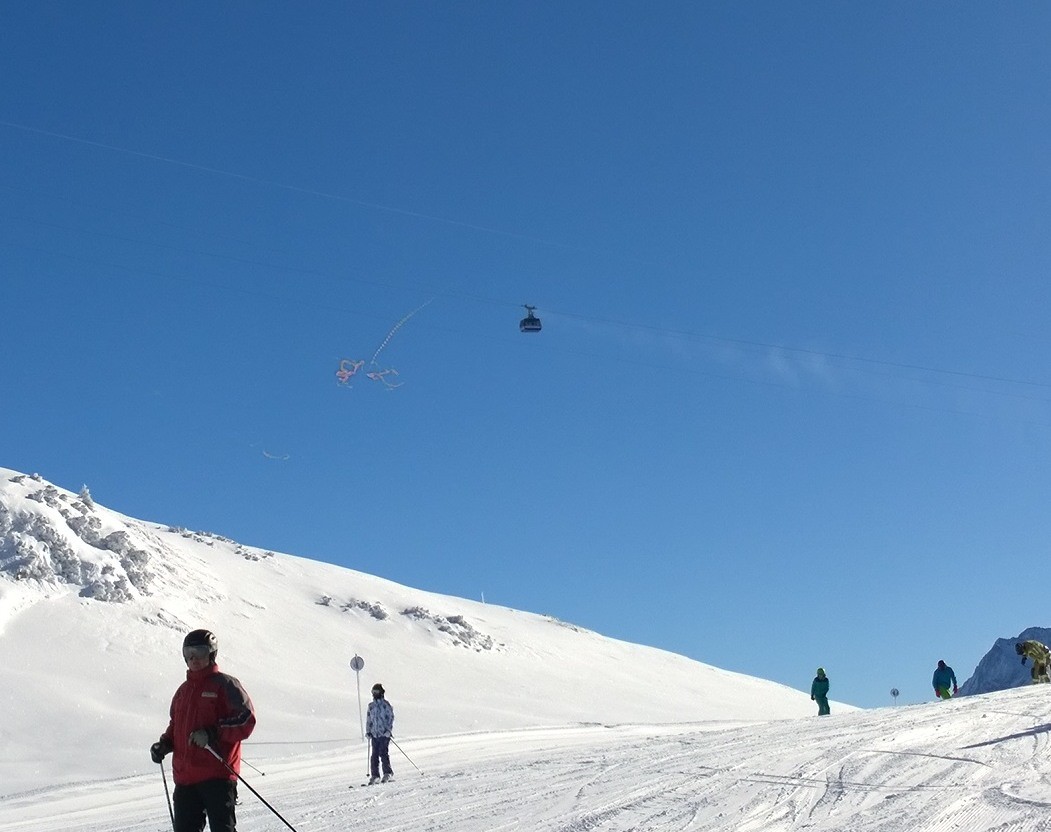
A month later I went skiing. Was taking pictures with my phone. And found some UFOs on photos!! What tha?! Look at these orange strokes in the sky (not at Valluga bahn =)
![]()
On most photos, one has to look carefully to notice, but on blue sky the damage done to sensor is very visible. Oops!
This leads to a very surprising and totally unexpected conclusion. DON'T LOOK INTO THE LASER WITH THE REMAINING EYE!! No, really, don't.
-
temperature
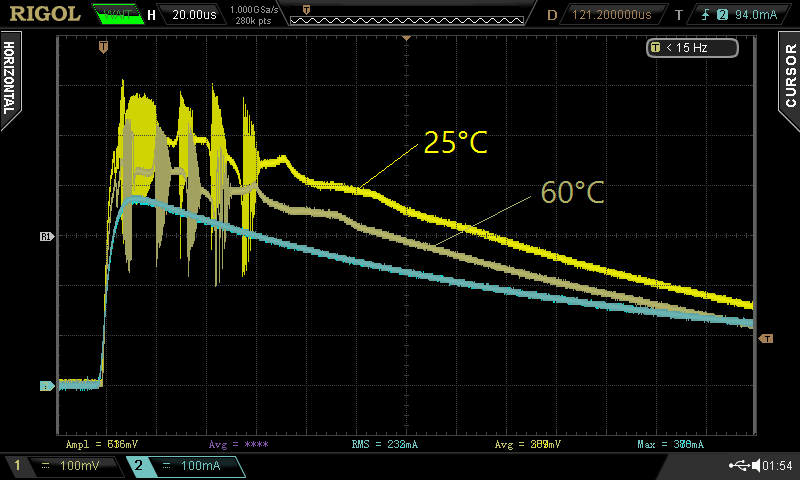
01/05/2016 at 21:56 • 0 commentsI became curious, if temperature of the diode affects the onset of the wiggles in the L/I curve. Sure it does.
I can't say it's totally unexpected. Upon heating, the wiggles start at higher currents. But the output power at the onset drops. So the wiggles are not tied to specific output power, and to specific current.
![]()
-
oscillation
01/05/2016 at 19:46 • 0 commentsThe laser doesn't stop bringing surprises.
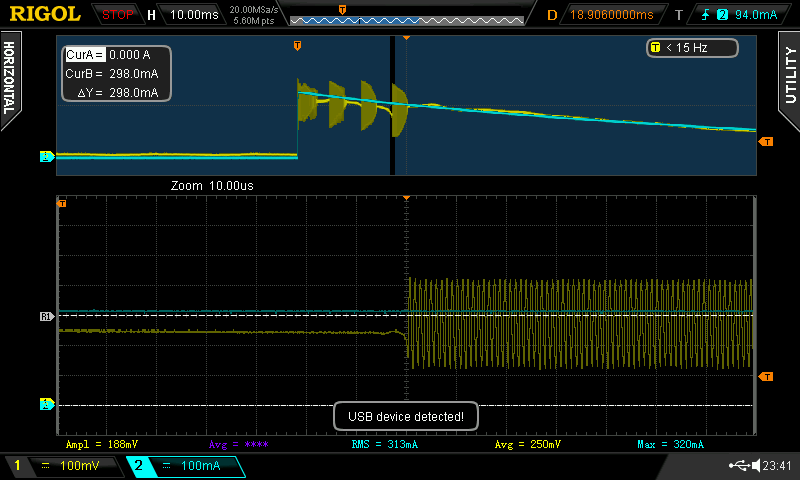
Now I've repeated the slow measurement with diverging lens, in hope of getting a video of the spatial redistribution.. And guess what happened? The laser is oscillating!!!
![]() On the top is the overall trace, slow scale. On the bottom, I've zoomed into the starting piece of that widening. There is oscillation. The frequency of this oscillation is 950 KHz.
On the top is the overall trace, slow scale. On the bottom, I've zoomed into the starting piece of that widening. There is oscillation. The frequency of this oscillation is 950 KHz. Previously, I wasn't seeing this oscillation, because my phototransducer was too slow to pick it up.
Go figure...
EDIT: the frequencies of oscillation are different in the bursts, with the bursts themselves not being simple. I see frequencies up to 8 MHz, which is probably the point where I hit the bandwidth limit again.
-
wiggles are spatial
01/05/2016 at 18:34 • 0 commentsBreaking news! Those wiggles on L/I curves I got previously were tiny, because I've set up the measurement in such a way that the total intensity is registered.
But now I switched to higher-speed measurements, and I had to upgrade my photodiode transducer to become faster. Before, its settling time was about 10 us. Now I wanted to measure at microsecond scales, so I lowered the resistor from 100k to 1k, boosting the bandwidth by two orders of magnitude. This is at a cost of losing sensitivity by same two orders of magnitude, but I wasn't concerned about it, because the laser outputs quite insane amount of light.
Because the sensitivity dropped, I could no longer measure light by just aiming the photodiode at the spot on white surface. So I've put it directly into the beam.
The transducer was overwhelmed by looking directly into the beam, so I decided to diverge the beam with a lens. And then! Woooow!
And then I saw that my tiny wiggles have become insane! Look!
![]()
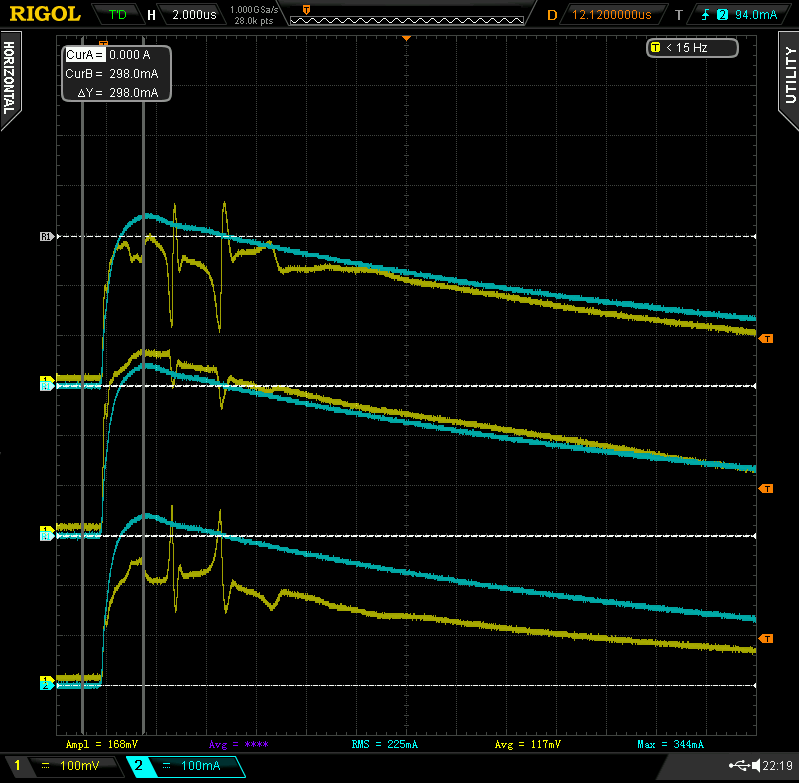
And that insanity is changing, as I move the detector inside the beam:
![]()
On this pic, I've overlaid screenshots from three different points of the beam. It can be clearly seen, that wiggles are almost exactly inverted on top and bottom plots, which are on the opposite sides of the beam.
So, the wiggles are mostly redistribution of light in the beam, the while the total light output is relatively unchanged. Fascinating, isn't it!
-
some info
01/05/2016 at 14:55 • 0 commentsThanks to comment by @Brian, who mentioned a very googlable term, "kink current", I was able to find some info on laser diodes in general, that sheds some light on what is going on.
http://assets.newport.com/webDocuments-EN/images/AN05_Laser_Diode_Overview_IX.PDF
If the link goes dead, try googling for "laser diode kink current", or for the title: #5 An Overview of Laser Diode Characteristics - ILX Lightwave.
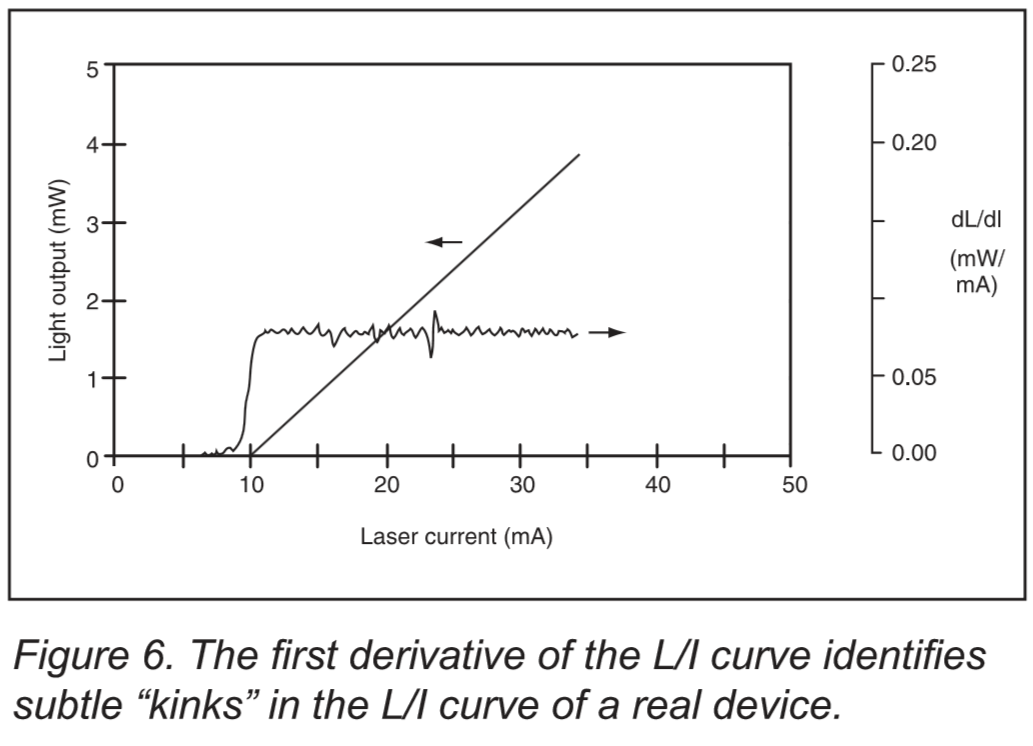
It does not include Brian's definition of kink current, but rather refers to kinks (that is, wiggles, noise, irregularities) on L/I curve.
![]()
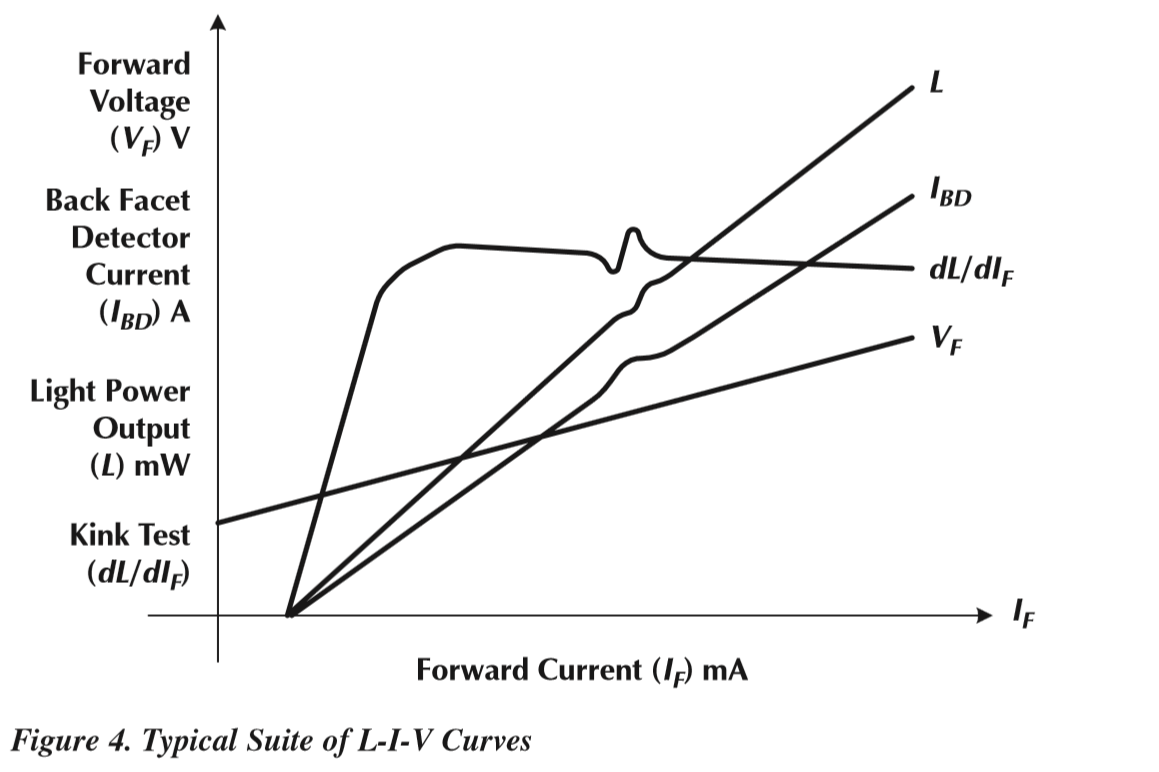
And below is another graph from the internet, which shows more obvious wiggles on L/I curve.
![]()
This came from Keithley Application Note "High-Throughput DC Production Testing of Telecommunications Laser Diode Modules".
There, it's also noted that devices with kinks in their working current range should be rejected from production line, which gives me a good reason to state: nominal current of my laser diode is very likely less than 300 mA.
-
now getting data from oscilloscope
01/05/2016 at 14:30 • 0 commentsFor the first measurement, I read out the data from the captured screenshot of the oscillogram. It's good enough, but after repeating the process for a slower decay, I felt like it's too much trouble, so I started experimenting on extracting the data directly off oscilloscope. So I captured a waveform, and exported it into each and every format the oscilloscope can write.
Some of the files were binary, with sizes ranging from large (1MB) to very large(10MB). Export of full data into a csv made me play with a whopping 111 MB csv file. And it looks like it contains only one channel, I want two.
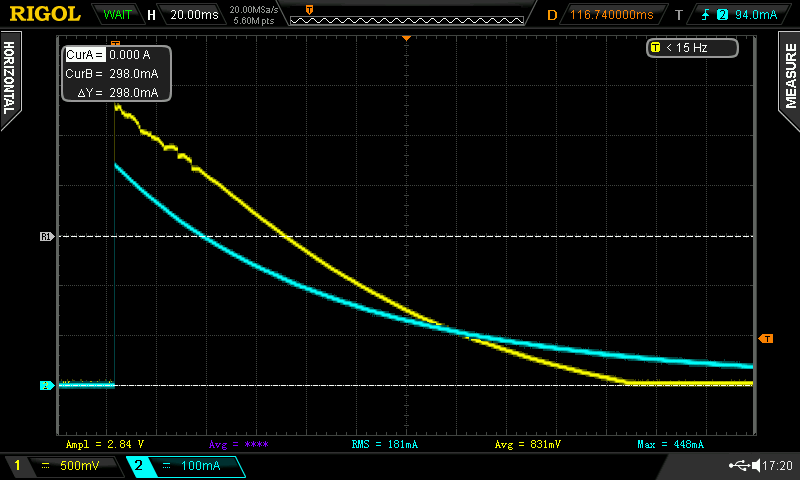
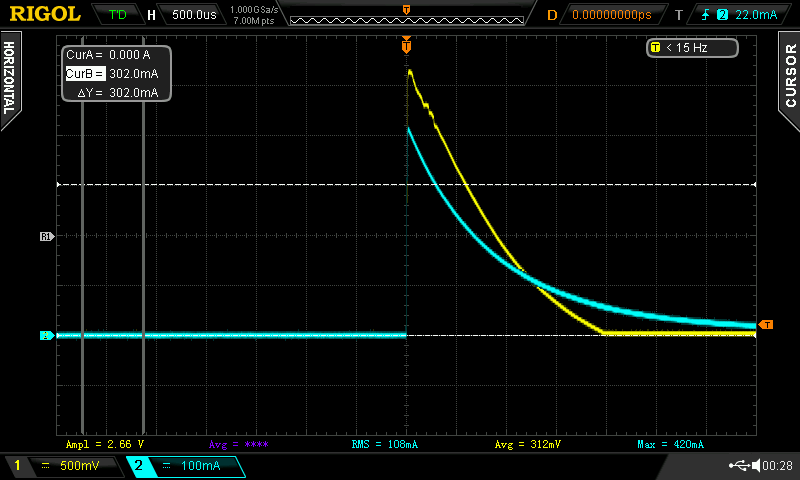
The best way so far is to export displayed data. It puts out reasonable amount of data, but with lots of noise. So the only thing I have to do to plot them is to boxcar-average it. The results follow.
![]()
![]()
This time, the L/I curve was measured much slower, with total length of the light pulse of about half a second. As you can see, the behavior isn't much different form the previous one, acquired in about 10 ms.
-
photodiode transducer
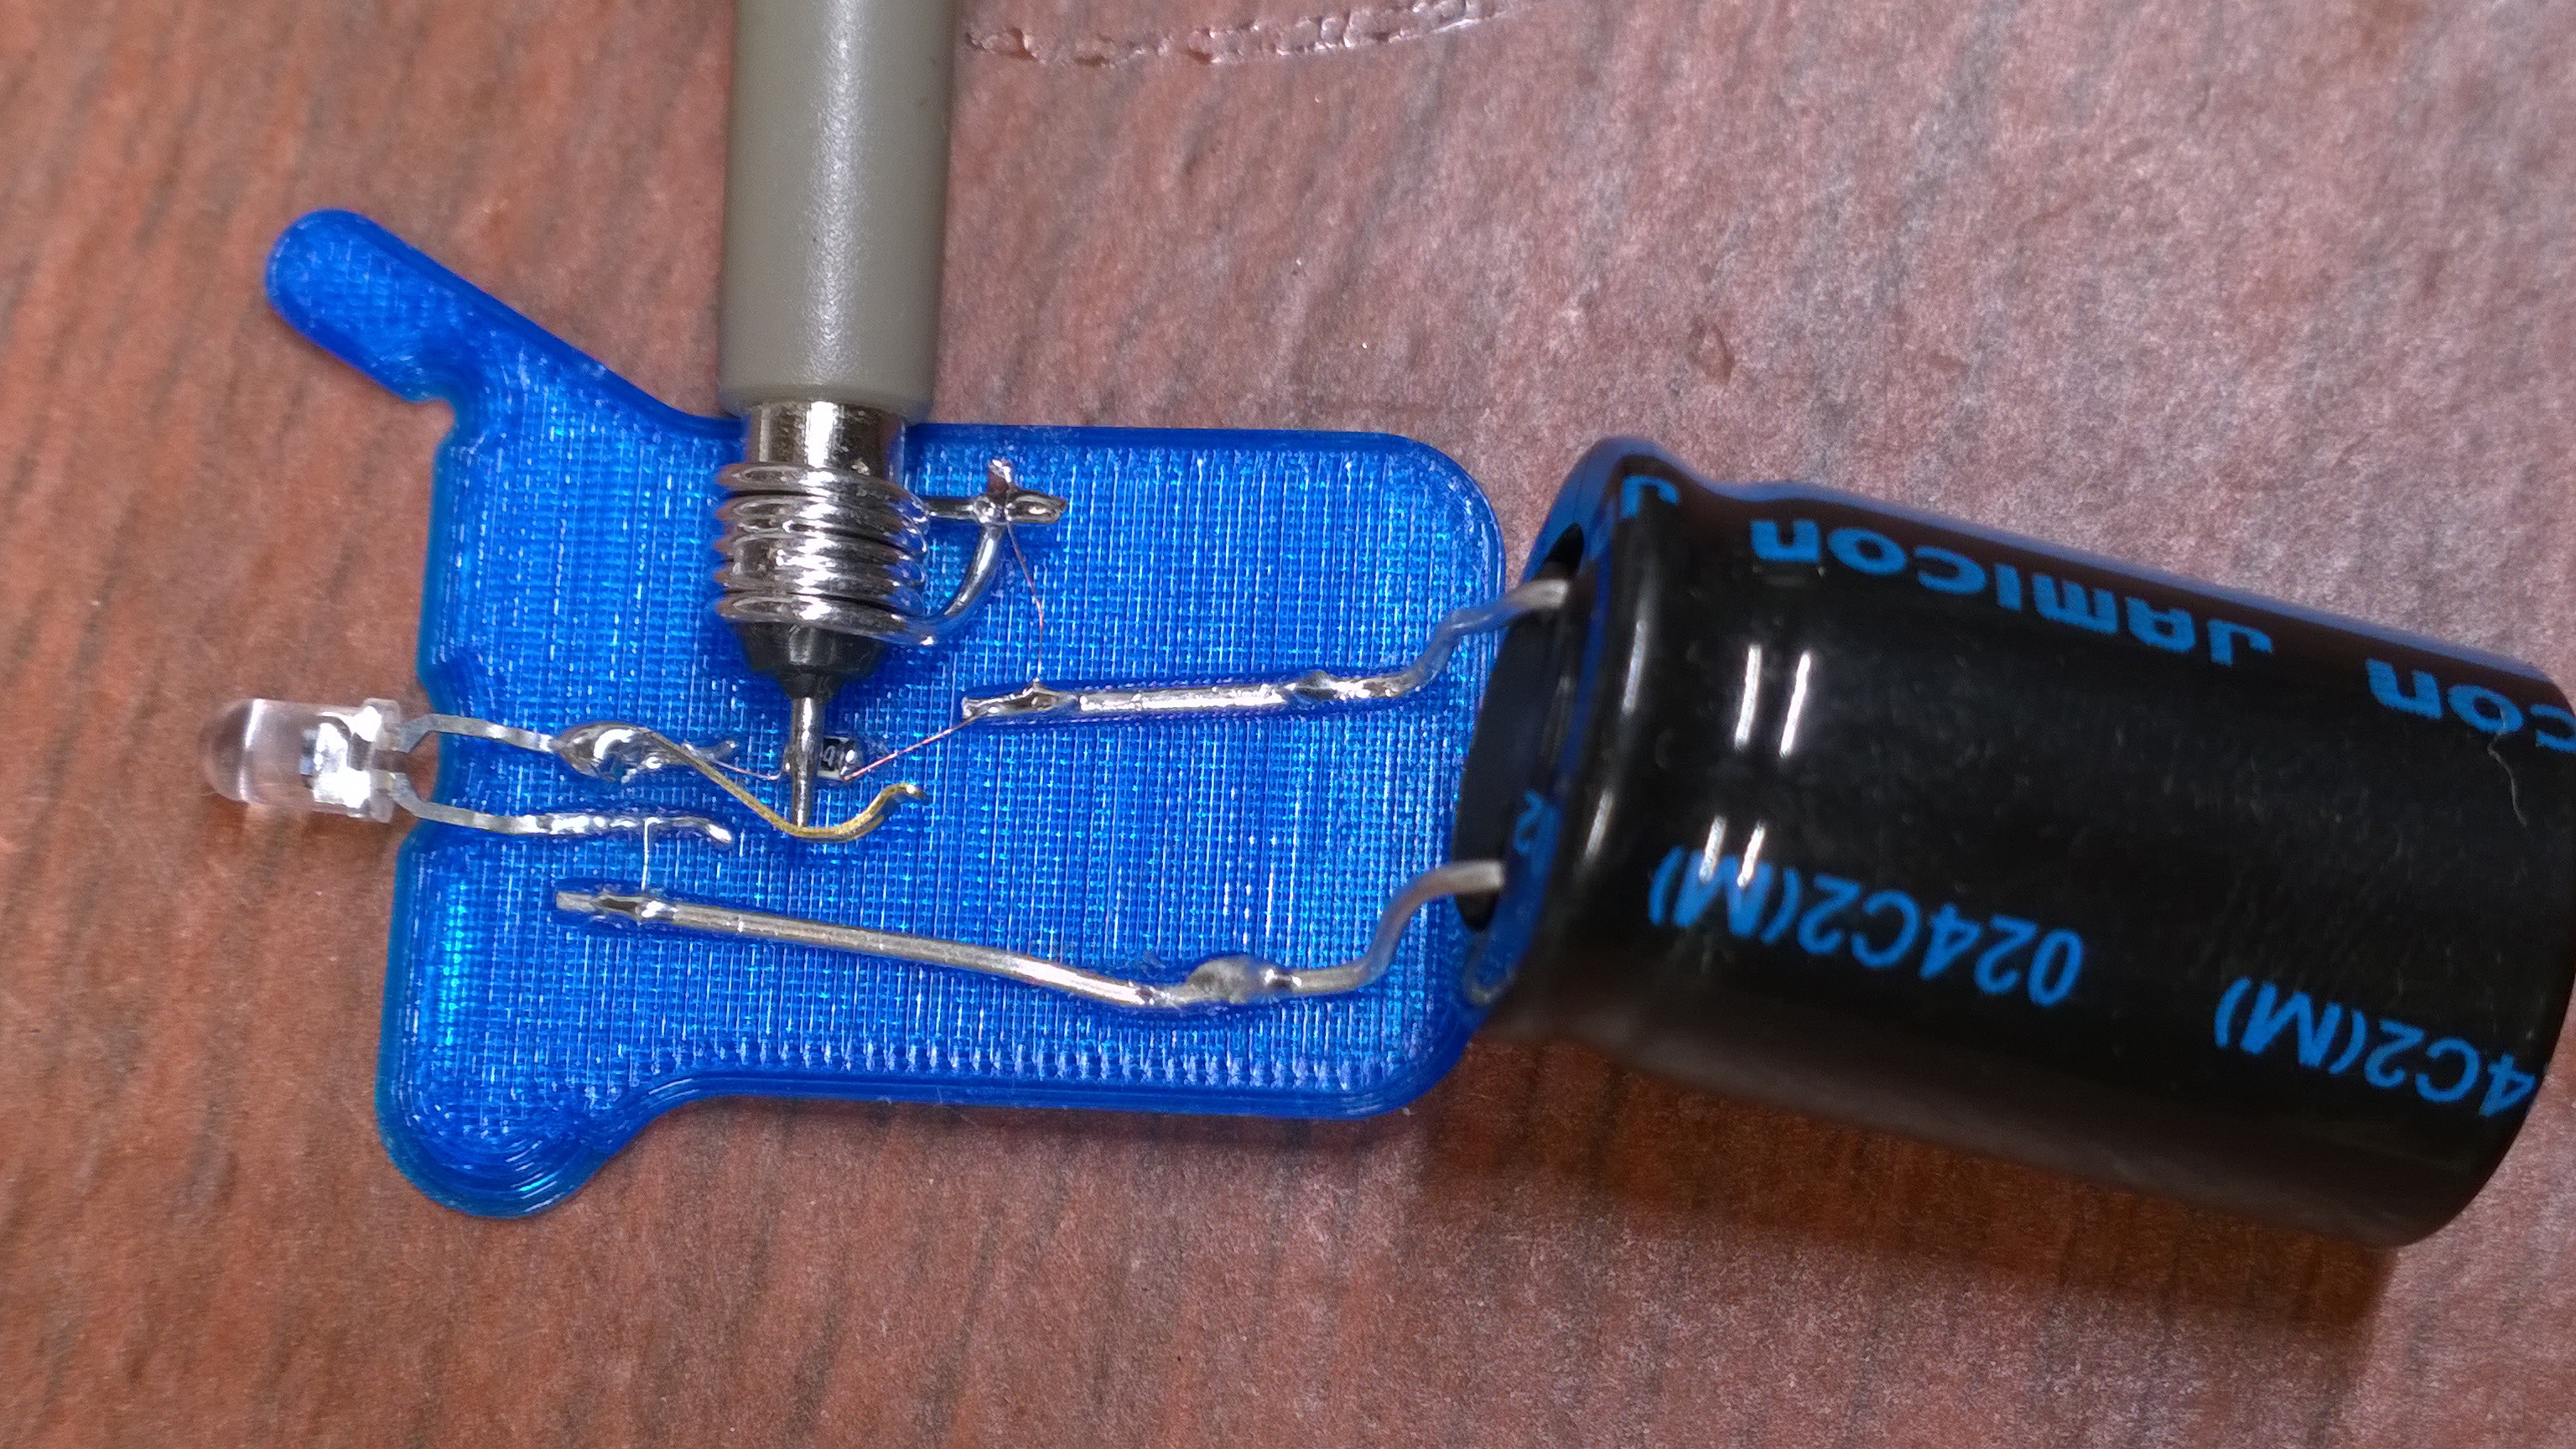
01/04/2016 at 21:47 • 0 commentsAs simple as it possibly can be. A big 4700uF 25V cap (instead of a battery - lasts days!), a photodiode, a 100k resistor, and that's it! Held together by a piece of scrap PLA 3d-print.
![]()
-
Weird noisy intensity-vs-current curve
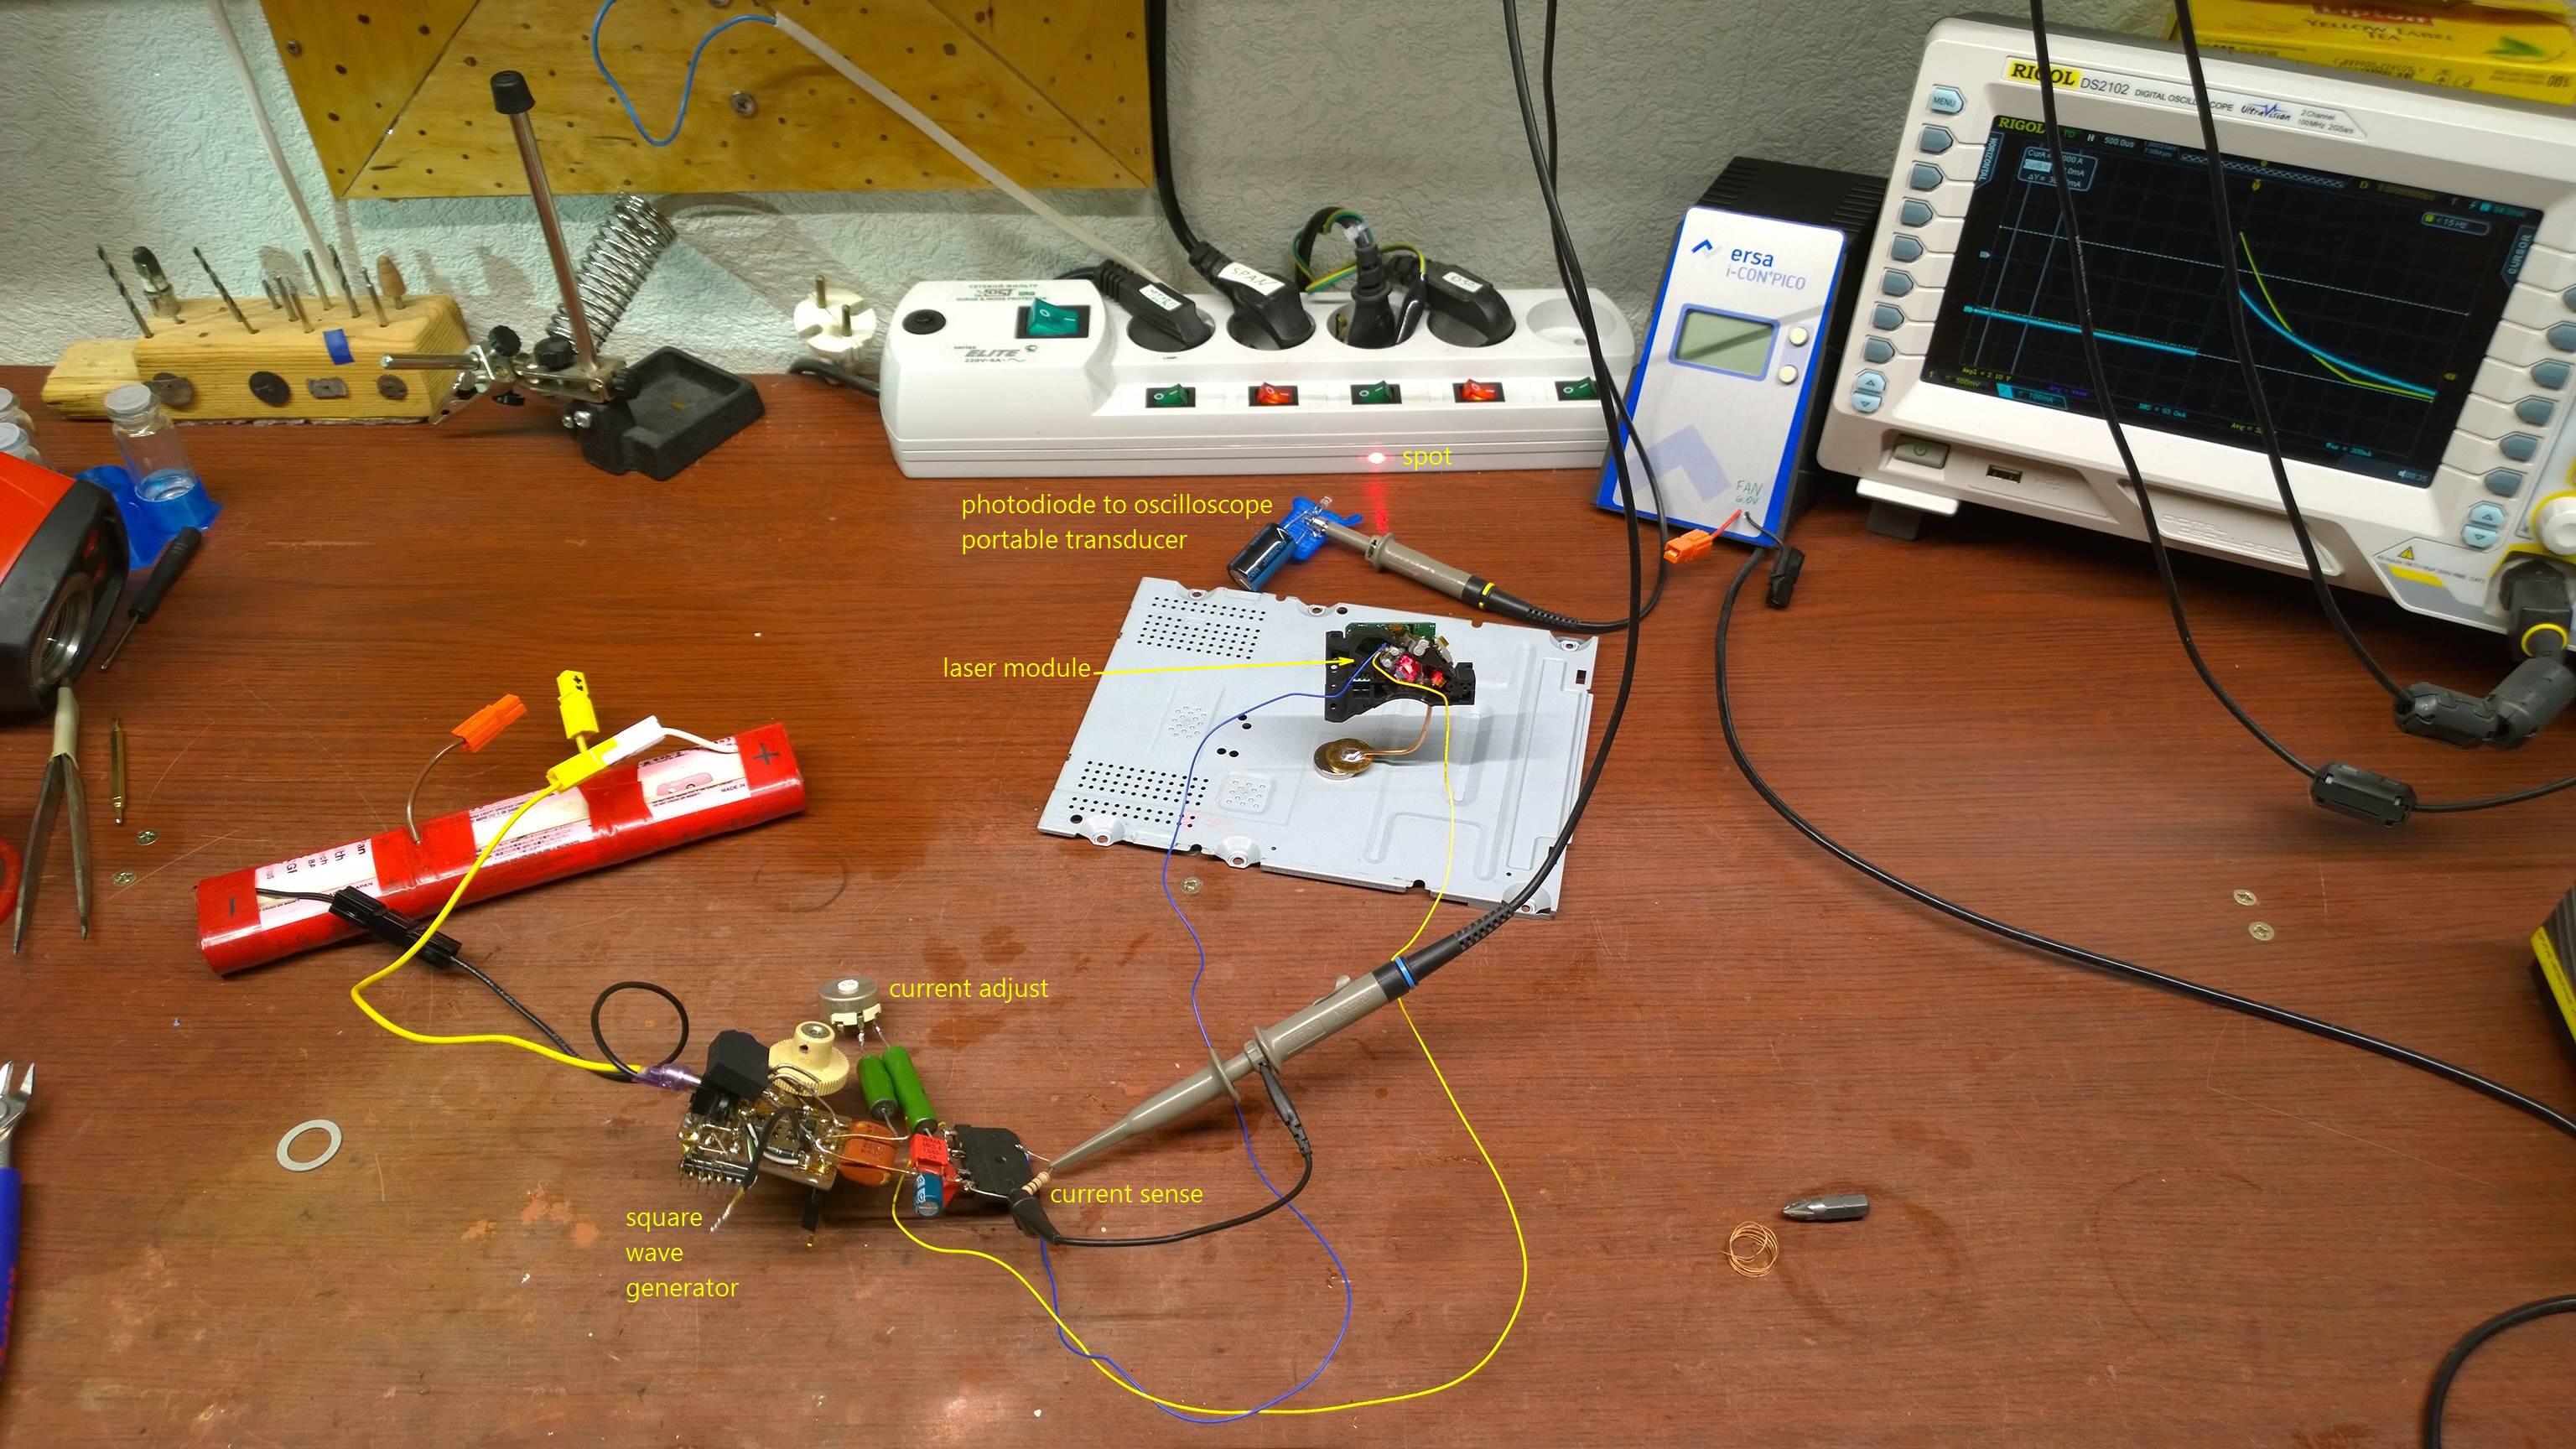
01/04/2016 at 21:11 • 2 commentsI've set up a rig to measure intensity vs current relationship for the diode.
Why? Because I'm expecting to see a saturating curve similar to those of LEDs. From that, I can guess max drive current - the one of LEDs is often around the point where the drop becomes apparent, but not seriously close to saturation.
I assume, that if I do pulse testing, I can probably seriously overdrive the laser diode, without causing serious damage. So off we go.
I've set up a simple circuit, where a capacitor (47uF) is discharged starting from 12 V through a 20-150 ohm resistor (adjustable) in series with the laser diode. This is done periodically, with an adjustable frequency of about 5 Hz.
The current and brightness waveforms are captured by 2-ch oscilloscope, and from these captured curves I can plot intensity vs current characteristic of the diode.
![]()
Once this was set up, it didn't take long to measure the curve.
![]()
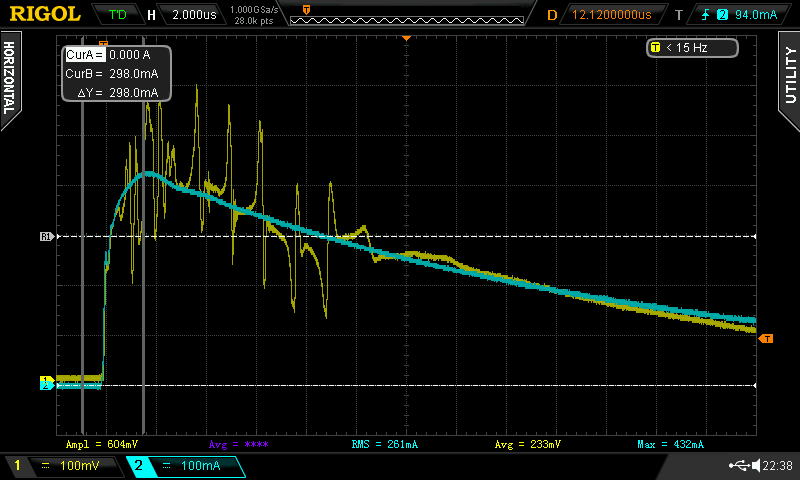
This is what I get on the scope. Note that noisy part in the intensity plot (yellow) at highest currents! That is not noise! It perfectly reproduces at each pulse, and it is tied to diode current (if I adjust it, the noisy patch moves, and completely disappears if current does not exceed 300 mA). Interesing.
What's going on? I have no idea, but I'm sure it is the laser! Well, at least, I certainly excluded photodiode transducer, and the current waveform is also clean, so it's not something in the low-ohmic trimpot...
If you have any ideas, on why laser diode intensity vs current curve can have irregularities, or if anything else can be happening due to my setup... let me know in the comments!
Another thing to note is that the intensity drops to almost zero abruptly at about 50 mA. This, I think, is due to lasing threshold. It still glows at lower currents, but that can only be seen in the dark.
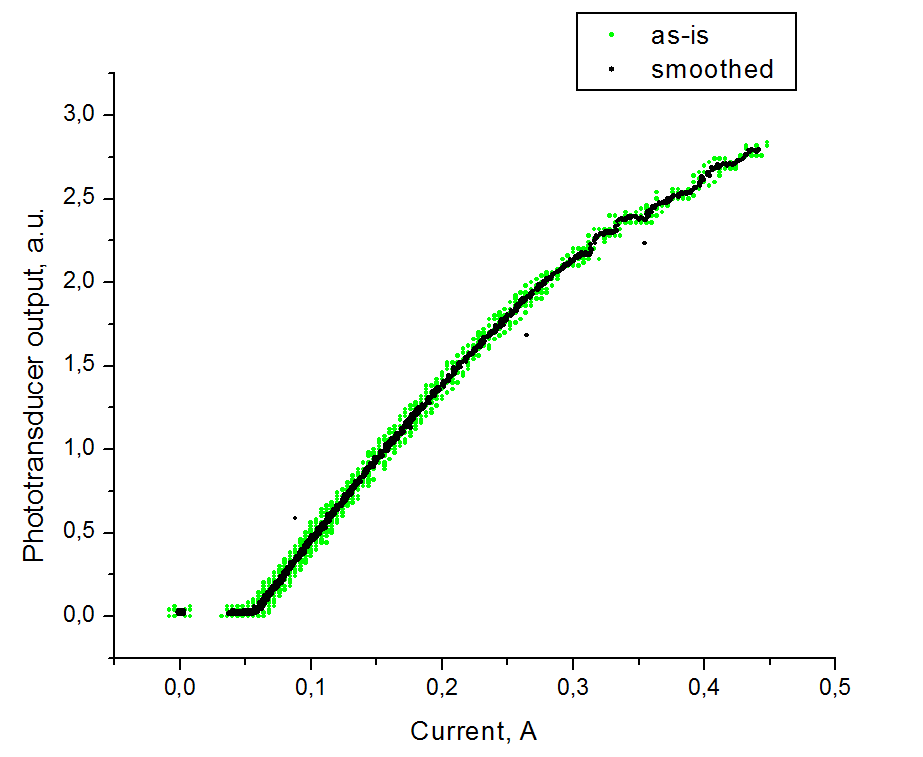
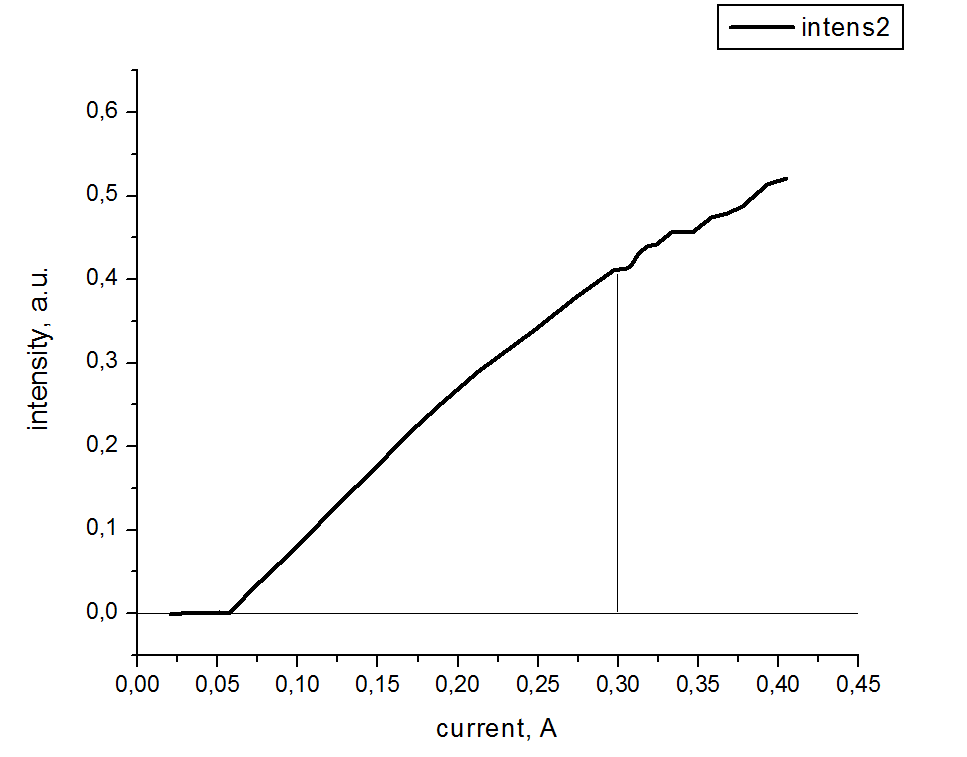
Finally, here's the intensity-vs-current plot!
![]()
Measuring DVD-RW laser
Scientific approach to figuring out max drive current
 On the top is the overall trace, slow scale. On the bottom, I've zoomed into the starting piece of that widening. There is oscillation. The frequency of this oscillation is 950 KHz.