 Kyle Gabriel
-
Guest on HackaDay TV's Show & Tell
10/23/2016 at 02:40 • 0 commentsI recently appeared as a guest on HackaDay TV's Show & Tell with Sophi Kravitz of HackaDay and Limor “Ladayada” Fried of Adafruit, with a bunch of other talented guests who showed off their Raspberry Pi projects. Check out the hour segment below. I appear at 46:30.
-
Sprout Time-Lapse
10/22/2016 at 04:12 • 0 commentsI wanted to share a time-lapse I created of the past two weeks that Mycodo has been caring for seedlings in Georgia while I've been traveling in California. After a week of germinating under the soil, this is their first two weeks above ground.
-
Video and RAMC
10/10/2016 at 01:16 • 0 commentsI had planned a grand video demonstrating both the hardware and software of Mycodo, for the final round of the Hackaday Prize. However, my PhD dissertation (related to microbial control and wildlife disease management), traveling, and the conference I'm currently atrending in San Diego, California (Recent Advances in Microbial Control), has impacted my productivity more than expected.
Edit: Video removed
-
Sous Vide PID Tuning and the Unexpected Electrical Fire
09/19/2016 at 00:00 • 0 commentsNever underestimate the potential for the human element to cause catastrophic devastation, or at least cause you to find yourself with a flaming pool of molten metal burning through your tabletop.
I had spent a good part of this weekend tuning a PID controller to heat an open pot of water to 50°C. This will be used for a cooking method known as sous vide, which translates to "under vacuum." This refers to the traditional vacuum bag that the food (which is commonly meat) is put into to increase heat transfer from the water to the food. It relies on using a temperature-controlled water bath to cook the food to a precise temperature. This method also makes it virtually impossible to overcook (which is easy to do on a stovetop or grill) and enables cooking a rare or medium-rare steak as easy as setting the temperature and letting Mycodo do the rest. Because the temperature is regulated, foods can be cooked for extended times, such as hours or days, to attain your desired tenderness. Some of the most delicious foods I've tasted have been made with sous vide, and I'm excited to be demonstrating the tuning I went through to get my sous vide system up and running.
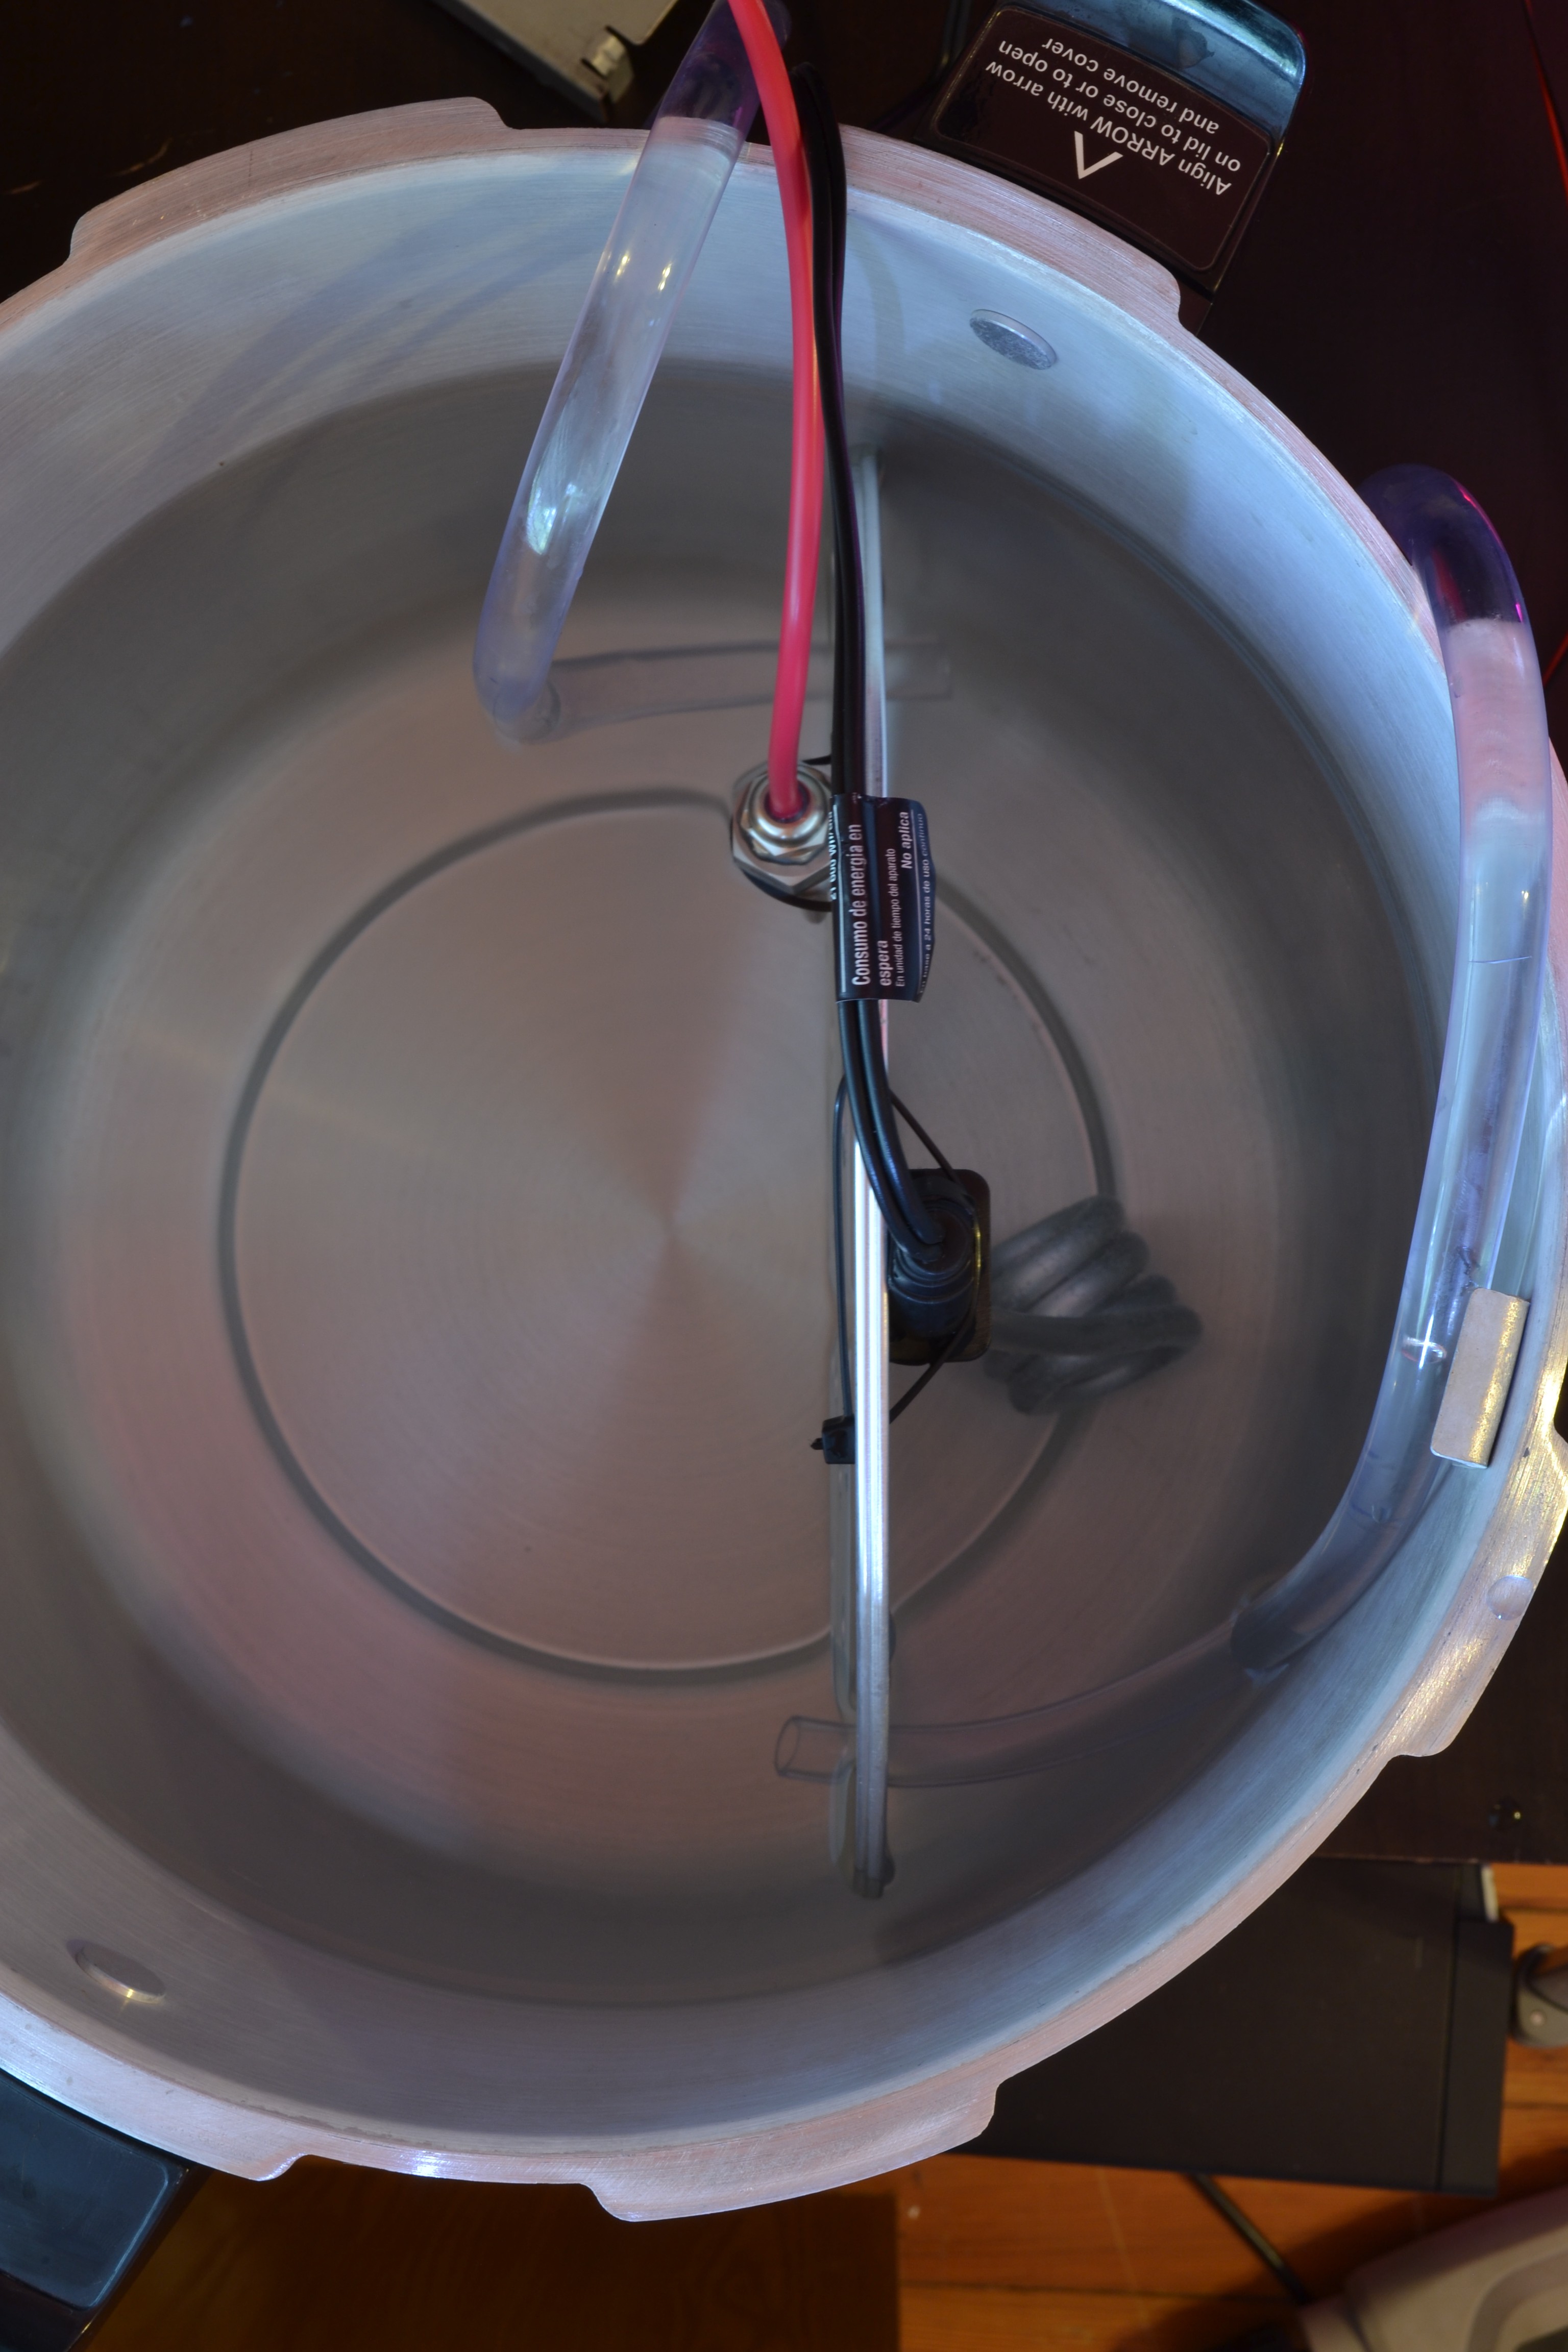
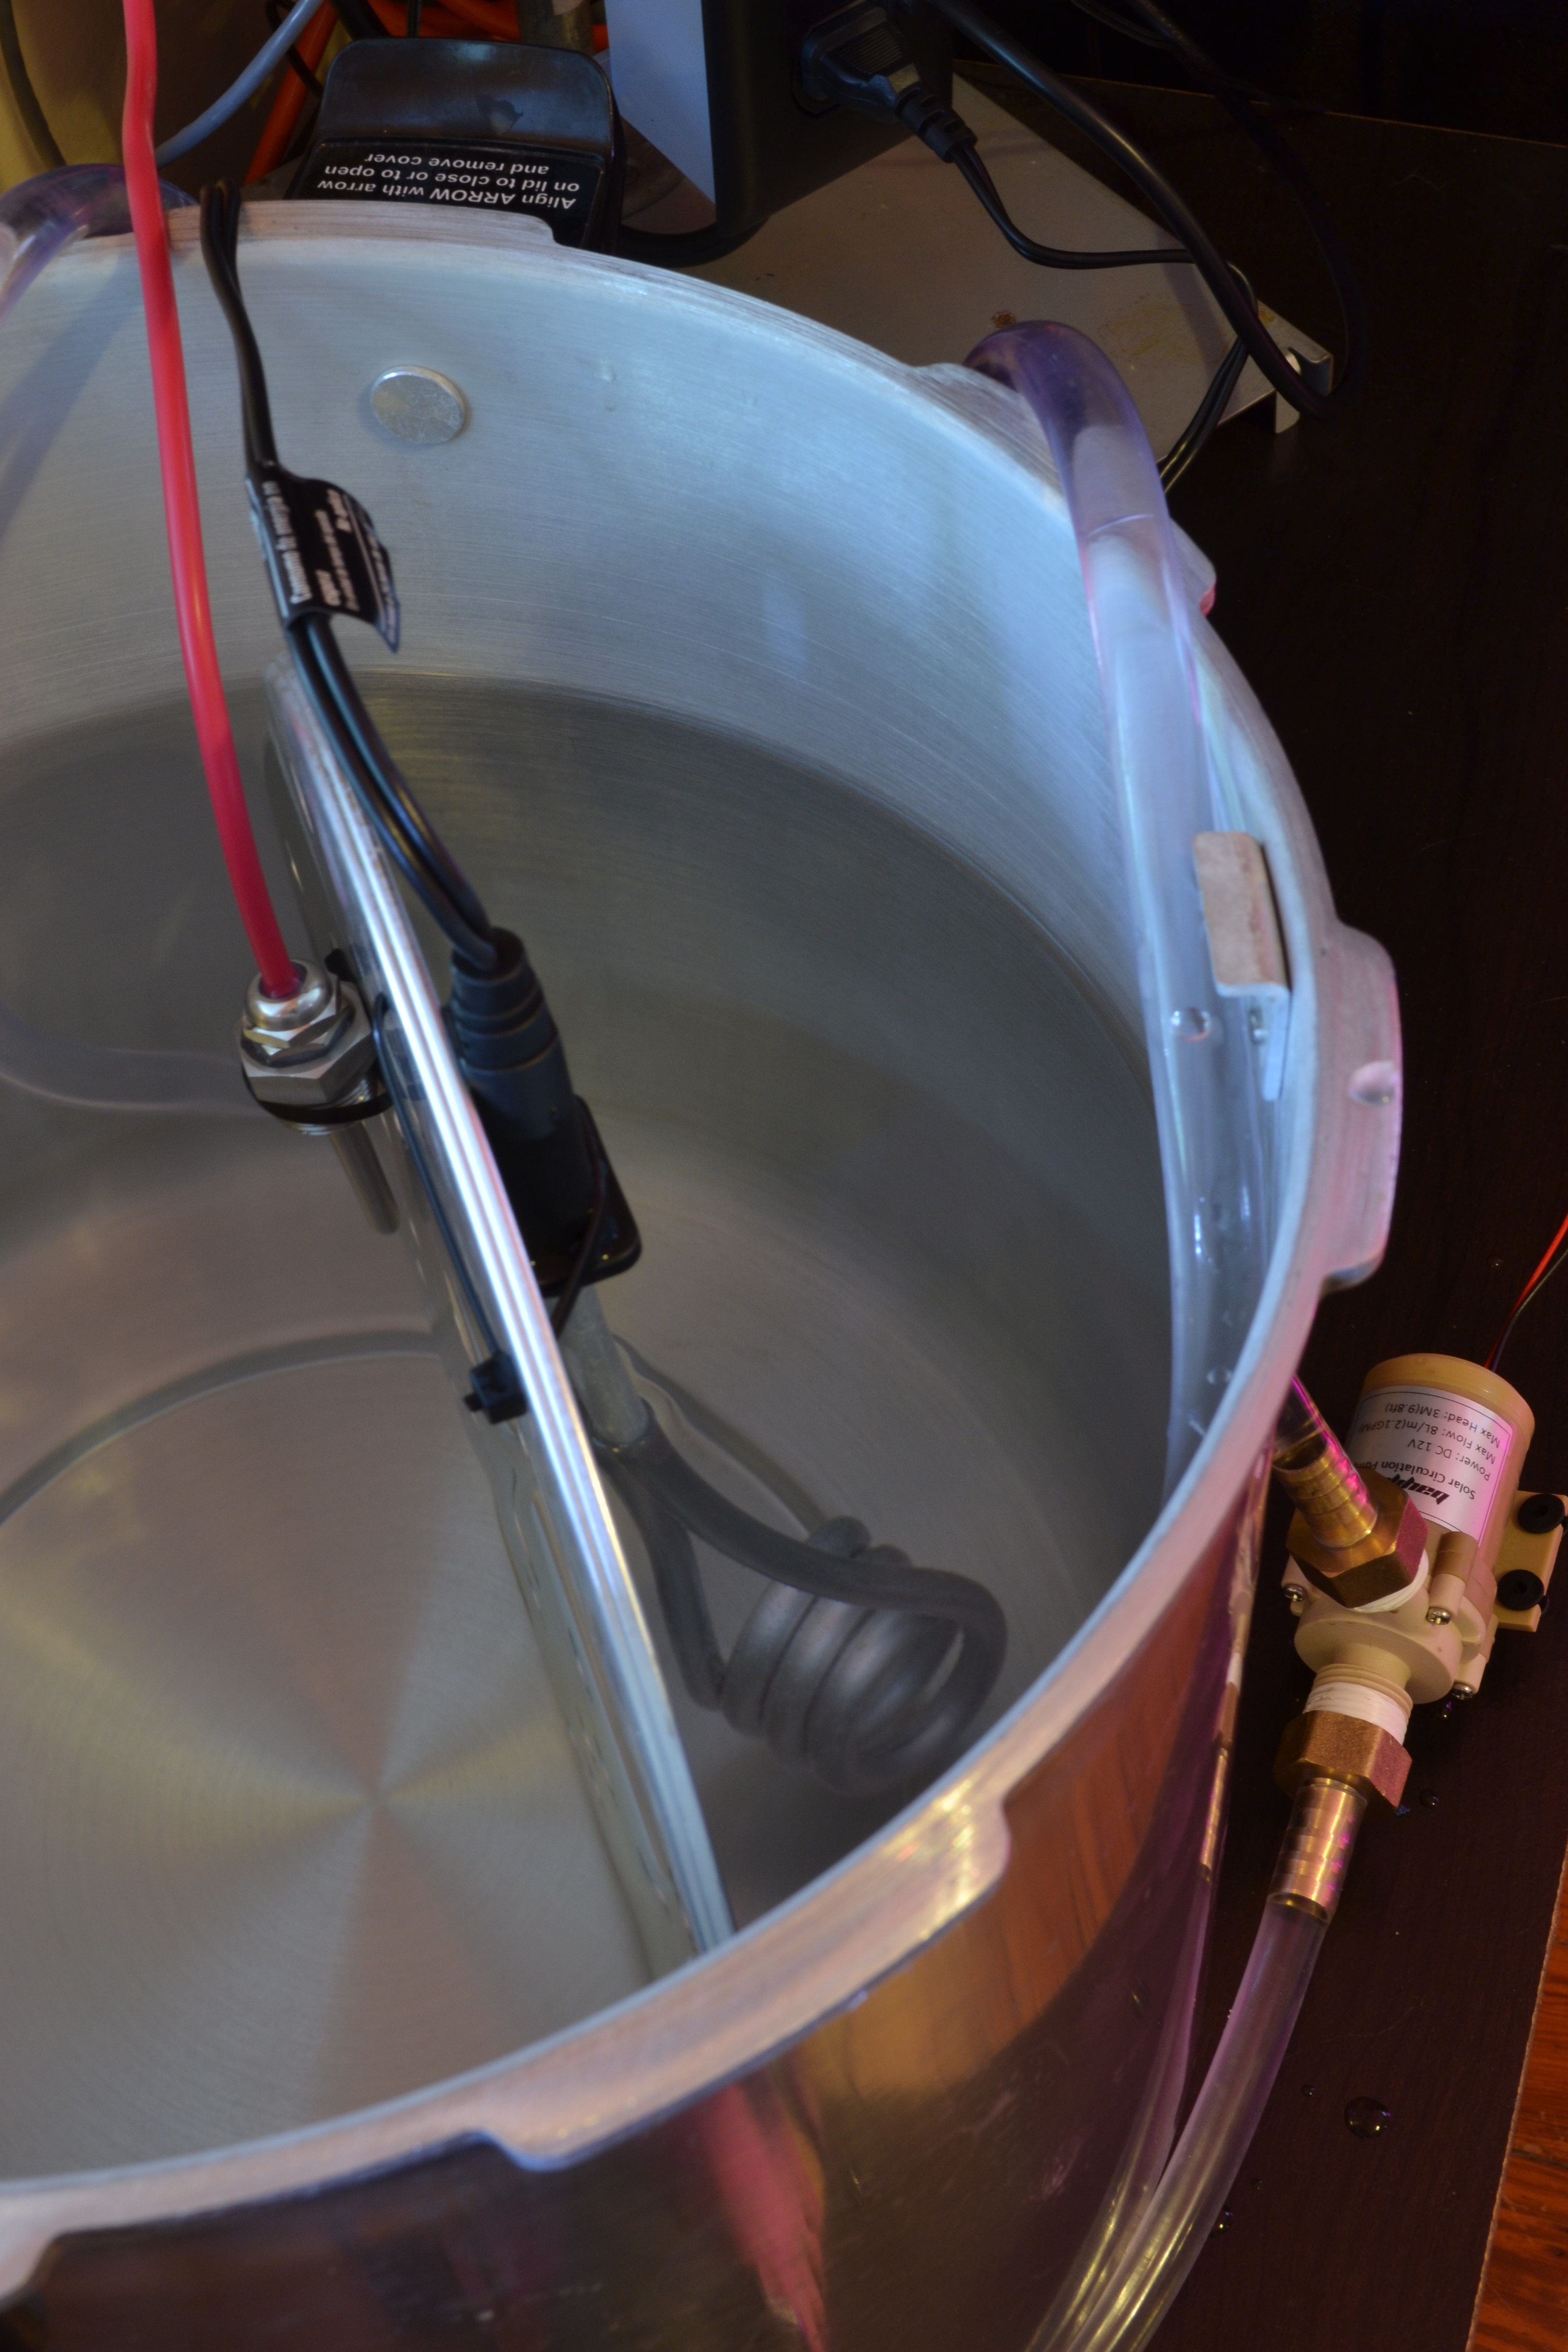
I had a submersible 120-volt AC heating element, my new Atlas Scientific PT-1000 temperature probe, and a hot water pump. I secured them all to a metal screen and began my long journey of tuning.
![]()
![]()
To begin tuning a PID, you have to understand some PID theory. I've covered this in the Mycodo manual and other things I've written in the past, so hopefully this explanation can improve upon my previous works by illustrating what I'm talking about with actual data and graphs I obtained from tuning this PID over the past two days.
First, lets discuss some terminology. PID stands for Proportional Integral Derivative. Each word describes a variable that contributes to processing an output value, called the manipulated variable (MV), from an input value, called the process variable (PV). All three P, I, and D variables are summed to produce the MV (P + I + D = MV). The duty of a PID controller is to affect the PV to move to a desired position, called the Setpoint (SP). The difference between the current position and the setpoint is the error (e).
Using water heating as an example, the process variable will be the measurement from a temperature sensor submerged in the water, which at room temperature is 28°C. The manipulated variable will be the number of seconds a heating element submerged in the water will turn on for. Our setpoint will be 50°C, making our initial error = 50-28 = 22. Therefore, at a measurement period of 35 seconds (an output is created from the input every 35 seconds), the heater would be turned on for 22 seconds and off for 13 seconds. This can be referred to as the duty cycle, and in this case would be 22/35 = 62.8%. Over the period of time where this on/off cycle persists with these durations, the heater is energized 68.2% of the time. By increasing the duty cycle, more energy would be put into the system.
The minimum options for Mycodo's PID controller are period (which determines how often a measurement is taken and the heater powered), a relay to power the heater, a sensor to obtain a measurement from, Kp, Ki, Kd, and a setpoint. Kp, Ki, and Kd are three main gains that determine how much each of the P, I, and D variables contribute to the MV. The expanded equation to produce the MV now looks like this: (Kp * P) + (Ki * I) + (Kd * D) = MV. Since P, I, and D are calculated by the controller (we're going to get into this shortly), the gains determine the degree to which each variable contributes to the final MV. So, if all gains are set to 0, the output will of course be 0, meaning the heating element will not turn on at all. And if the Kp is set to 0.1 it will produce a smaller MV than if Kp was set to 1.0.
This makes it simple to use the gains to tune the controller and to enable or disable the contribution of each part of the MV calculation. If you wanted a P controller, set the Kp gain to a non-zero number and keep Ki and Kd at 0, If you want a PI controller, set the Kp and Ki gains to a non-zero number and set Kd to 0, and if you wanted a full PID controller, set each gain to a non-zero number. PI controllers are the most common controller found in industry, as they're proven to be very simple to tune and work well in a broad range of situations (and most industrial regulation systems are simple by design).
Proportional
The proportional accounts for present error in the system. If the error is 22, the output will be 22. If we turned the PID controller with Kp=1, Ki=0, and Kd=0, the output will be 22 (and if Kp is doubled so Kp=2, then the output will be 44). In this scenario, MV will be turning a heating element on and heating the water for this duration. At the next sensor measurement, the temperature will most likely be higher. If the new temperature is 30, the new error would be 50-30 = 20. That's 2 seconds less than the first duration. You can see that the output is proportional to the input, and as the measured temperature rises closer to the setpoint, the heating element turns on for shorter periods of time. Eventually, if the measured temperature reaches the setpoint, P will be 0, and the heater will not turn on at all. Using P alone can cause problems in some systems, by not being able to put enough energy into the system to bring the PV to the setpoint or causing wild oscillations of the PV to rise above and below the setpoint instead of a steady regulation. To alleviate these issues, the I and D can be introduced to the equation.
Integral
The integral accounts for past values of error. If an error is no longer decreasing after the PID has been running for a while (meaning the temperature is never reaching the setpoint), the I will begin to increase, causing the output to increase. This can occur when the P value alone does not output enough to cause the PV to reach the setpoint and is due to the nature of the proportional variable approaching 0 as the error approaches 0. If little or no energy is going into the system, the temperature will begin to drop as the energy is dissipating from the system faster than it's being put in.
Derivative
The derivative accounts for future values of error based on the current rate of change. If our P value alone is not enough to cause the PV to reach the setpoint and the Ki gain must be turned up, this will cause the MV to increase over time until there's enough energy being put into the system to cause the temperature to begin rising again (as long as the duty cycle is not already at 100%). As the MV approaches the setpoint, the the P value may be set too high or the I value may not react quickly enough to lower the MV to prevent pushing the temperature above the setpoint, overshooting our target temperature. The D value takes into account the projected PV and compensates when it predicts it may overshoot the setpoint. Often an D value is negative in order to counteract the effects of P and I.
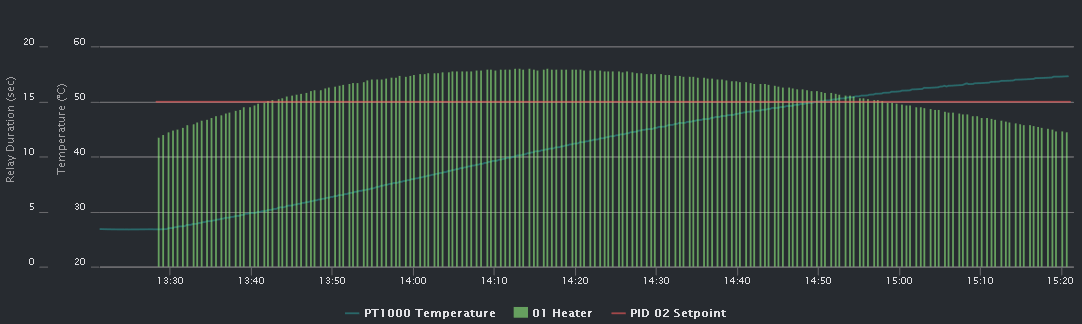
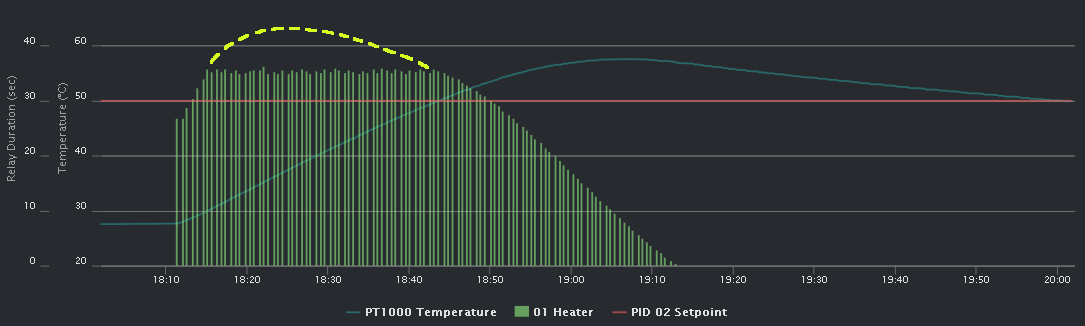
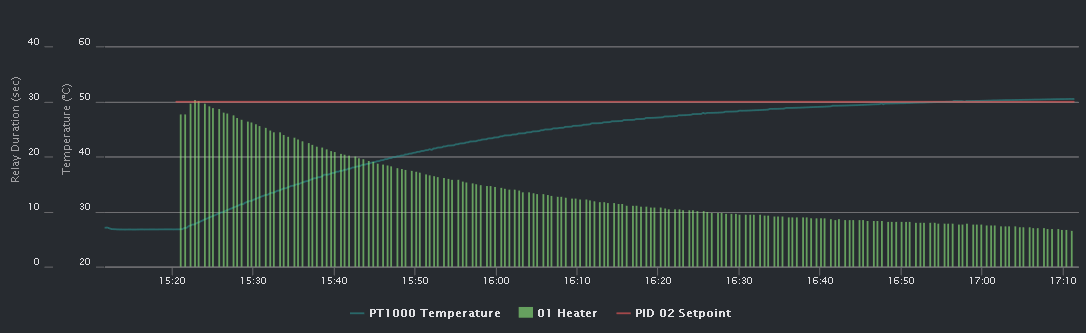
For this specific setup, a temperature measurement (PV) will be taken and the PID output (MV) will be calculated every 35 seconds. I will show a series of graphs showing a segment of 2 hours, with the water temperature as a teal line, the setpoint as a red line, and the duration the relay turns on every 35 seconds as green vertical bars.
Initial Tuning
Kp: 0.5, Ki: 0.01, Kd: 0
![]()
You can see that there is considerable overshoot of the setpoint, as the temperature continues to rise well past our desired temperature. I want more power initially into the system to rise the temperature faster (more Ki) and I want a faster decrease when it's projected to overshoot the setpoint (add Kd).
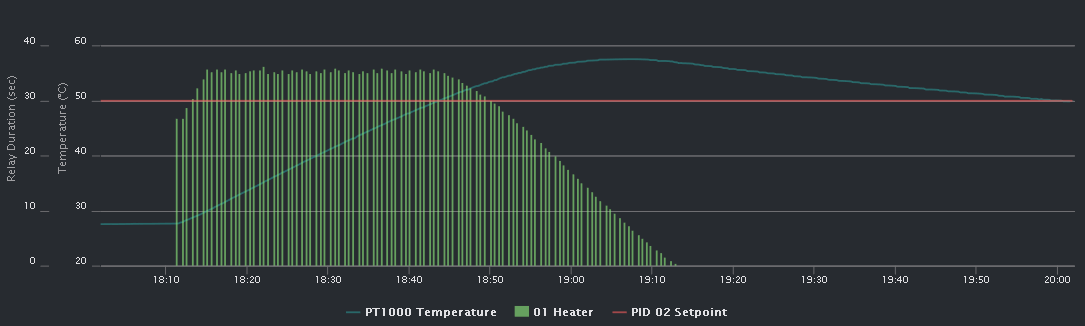
Tuning 2
Kp: 1.0, Ki: 0.1, Kd: 0.01
![]()
There's now considerably more energy going into the system at the beginning but the increased Kd did not adequately counter the sheer amount of Ki that's being applied. Let's increase the Kd.
Tuning 3
Kp: 1.0, Ki: 0.1, Kd: 0.1
![]()
Adding Kd had virtually no effect. I was about to increase Kd more and test again, but in my intermediate research, I came across a part of my PID code that needed review, known in my code as the integrator. This is the I in the above MV equation, and changes in response to the past rate of change. If left unchecked, this value can grow extremely large (as seen by the yellow line in the figure below), and make counteractions difficult. The yellow dotted line represents the hidden actual PID output, caused by an unchecked rise of I.
![]()
Let me note that you don't see the relay duration reaching this actual number in the graph because we are working with periods of 35 seconds and are at a maximum duty cycle of 100% when the output duration is 35 seconds. Essentially, if the next period comes around and the relay is set to be on for 90 seconds, it will stop it, log how long the relay was actually on for, (35 seconds), then start it on again for 90 seconds. In 35 seconds, this cycle repeats. That's why you will can only see a maximum duration which is less than or equal to your period. You just simply cannot go higher than a 100% duty cycle.
The solution this issue was to add limiters to the I value. That means setting a maximum I value of 100 and a Ki of 0.1, our maximum contribution to the total PID output from I can be = 100 * 0.1 = 10. After changing the code, I set the initial maximum I value to 100 and let the next test fly.
Tuning 4Update Mycodo, add integrator min and max options
Kp: 1.0, Ki: 0.1, Kd: 0.1, Integrator max: 100![]()
Now it's starting to look really good. We're still slightly overshooting our setpoint, so I'll drop the Integrator max to 60.
Tuning 5
Kp: 1.0, Ki: 0.1, Kd: 0.1, Integrator max: 60
![]()
It's at this time there was an incident that could have burned down my house, if I didn't notice and take immediate action to prevent it.
To carry out my experiments quickly, at the end of each run, I would turn off the PID and replace the hot water with cold water in order to immediately begin the next test. After the water was hot and the experiment had ended, I turned the PID off, took the heating element out of the water, and took the pot into my kitchen to refill it with cold water, as I've done several times prior.
When I returned with the pot of cold water I immediately knew something was awry, because when I left the room there most definitely was not a pool of red-hot molten metal on my cheap Ikea table, with black smoke billowing toward my ceiling.
I unplugged the heater and looked around for something to put out the flame. Not immediately seeing anything and needing to act quickly, I decided it was small enough to just blow it out with my breath. Who would have known I had actually been preparing for this moment my whole life, with each new childhood birthday party and having to blow out an ever-growing number of lit candles.
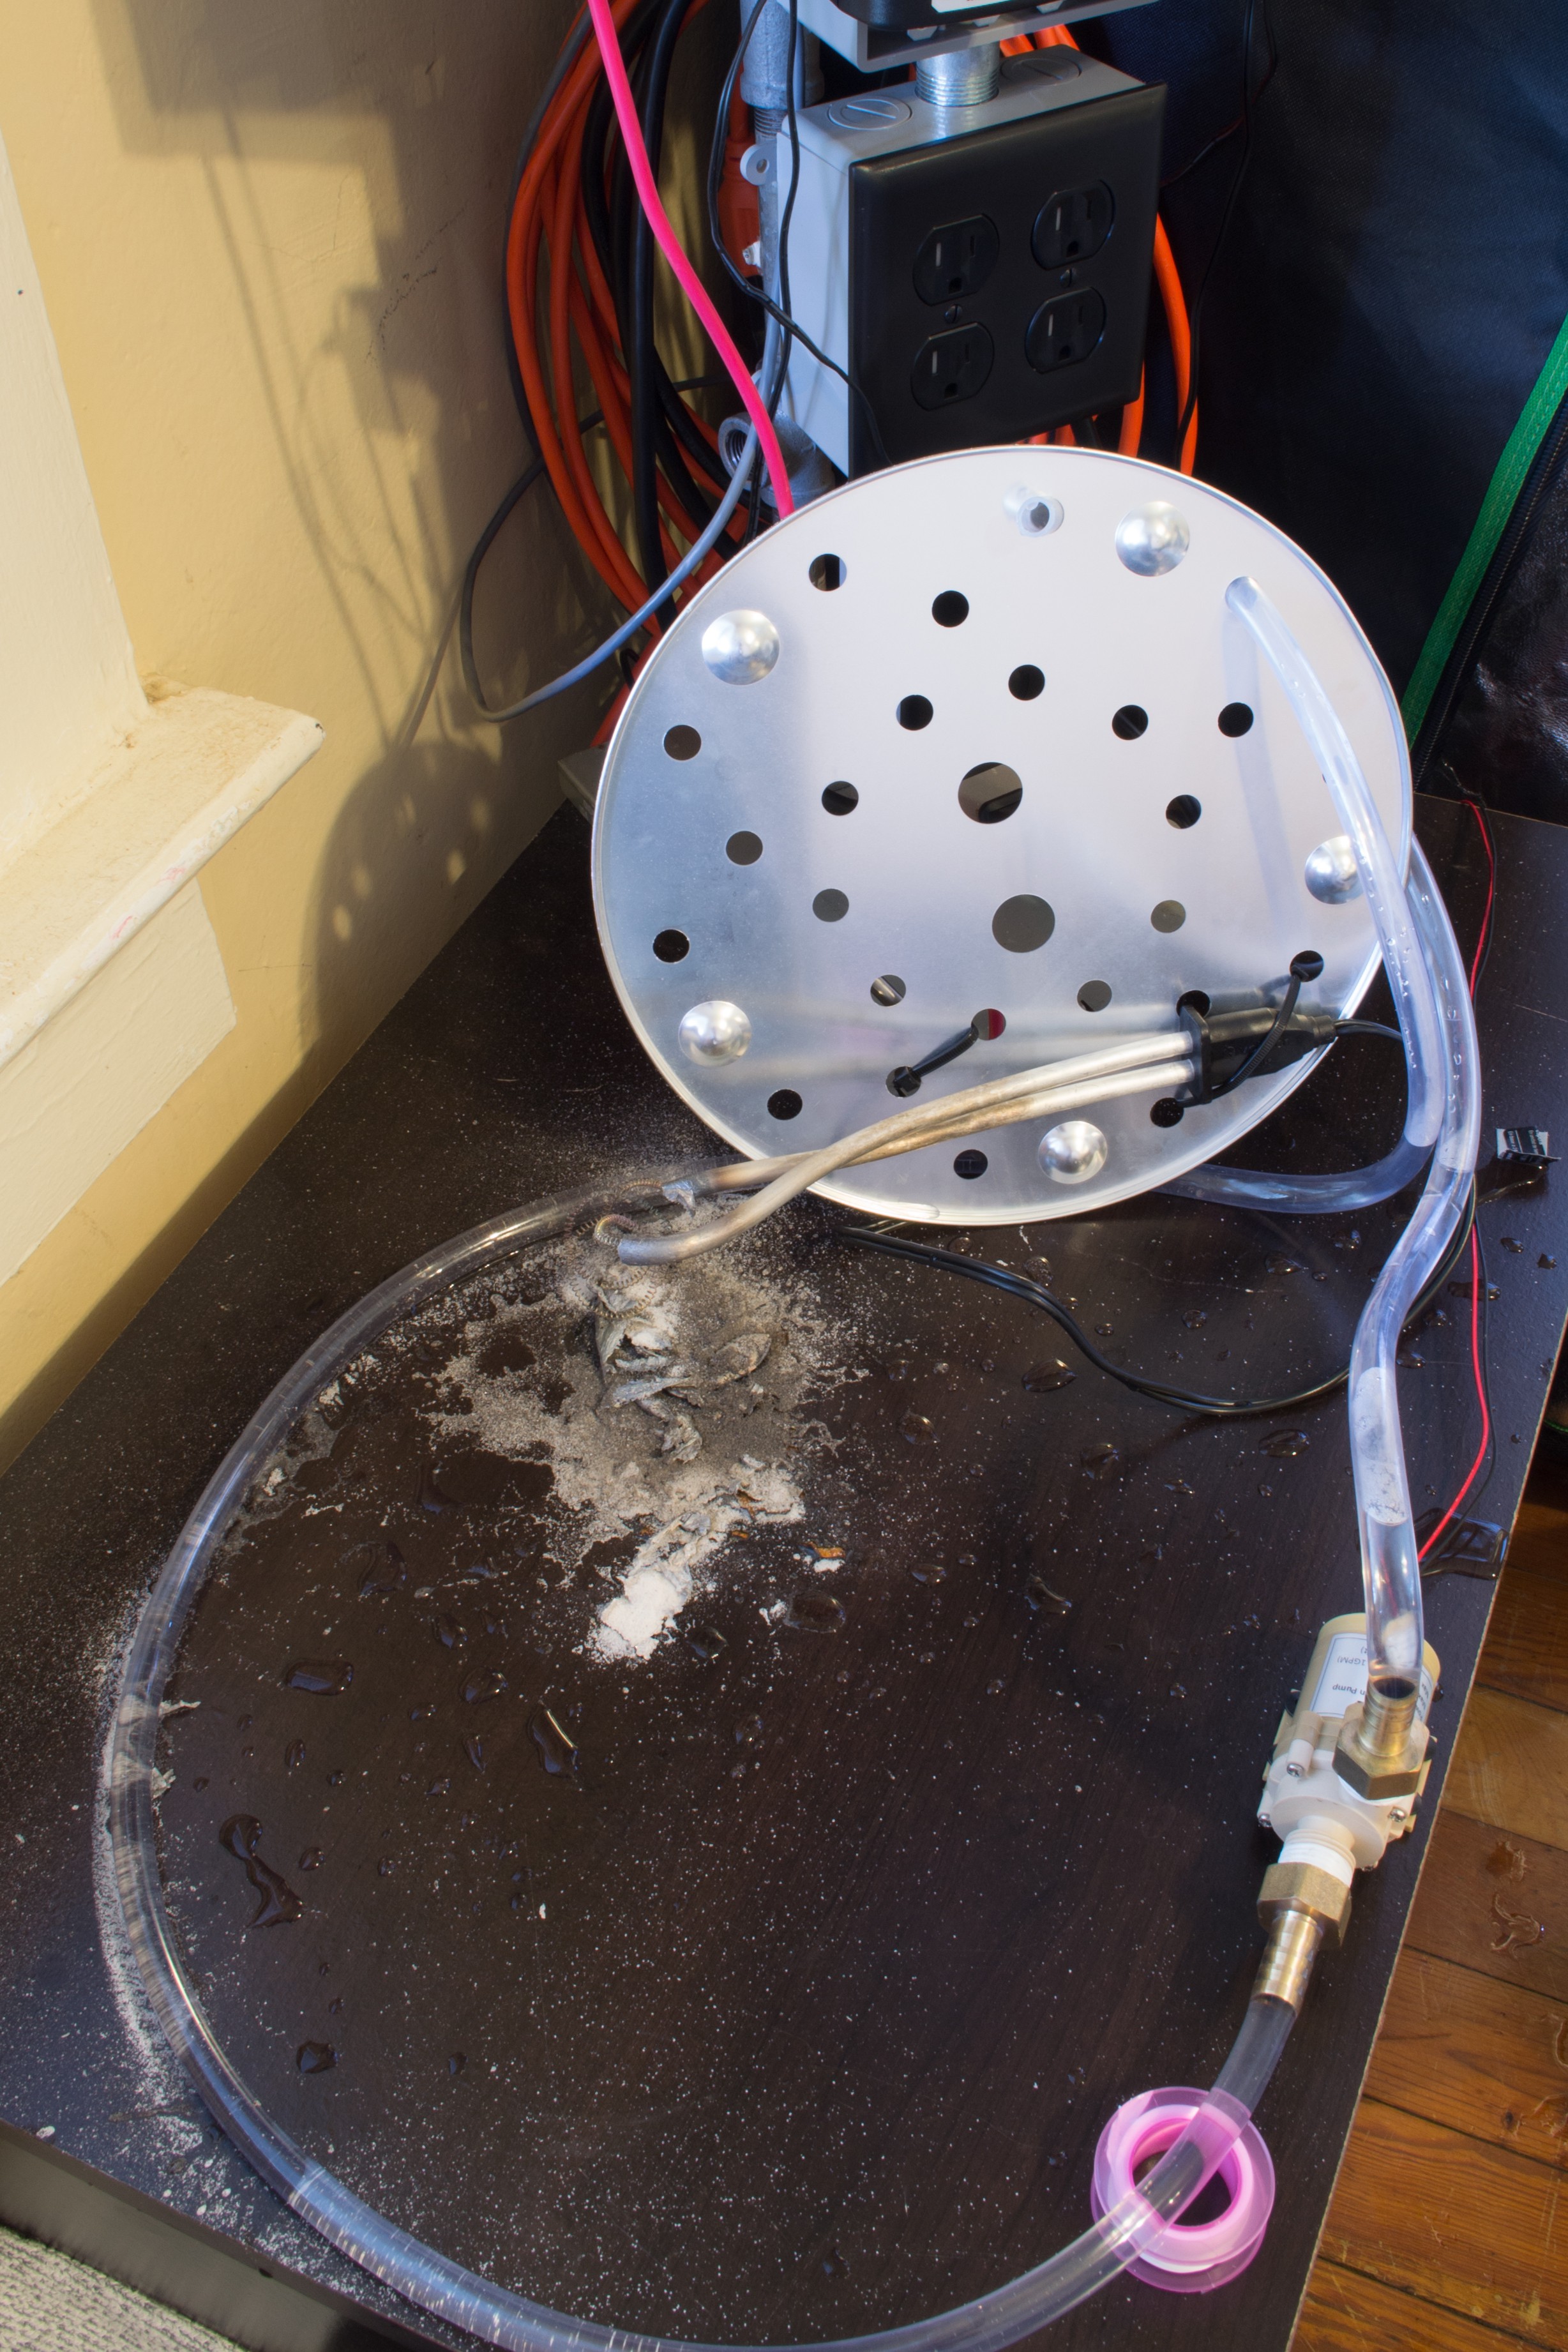
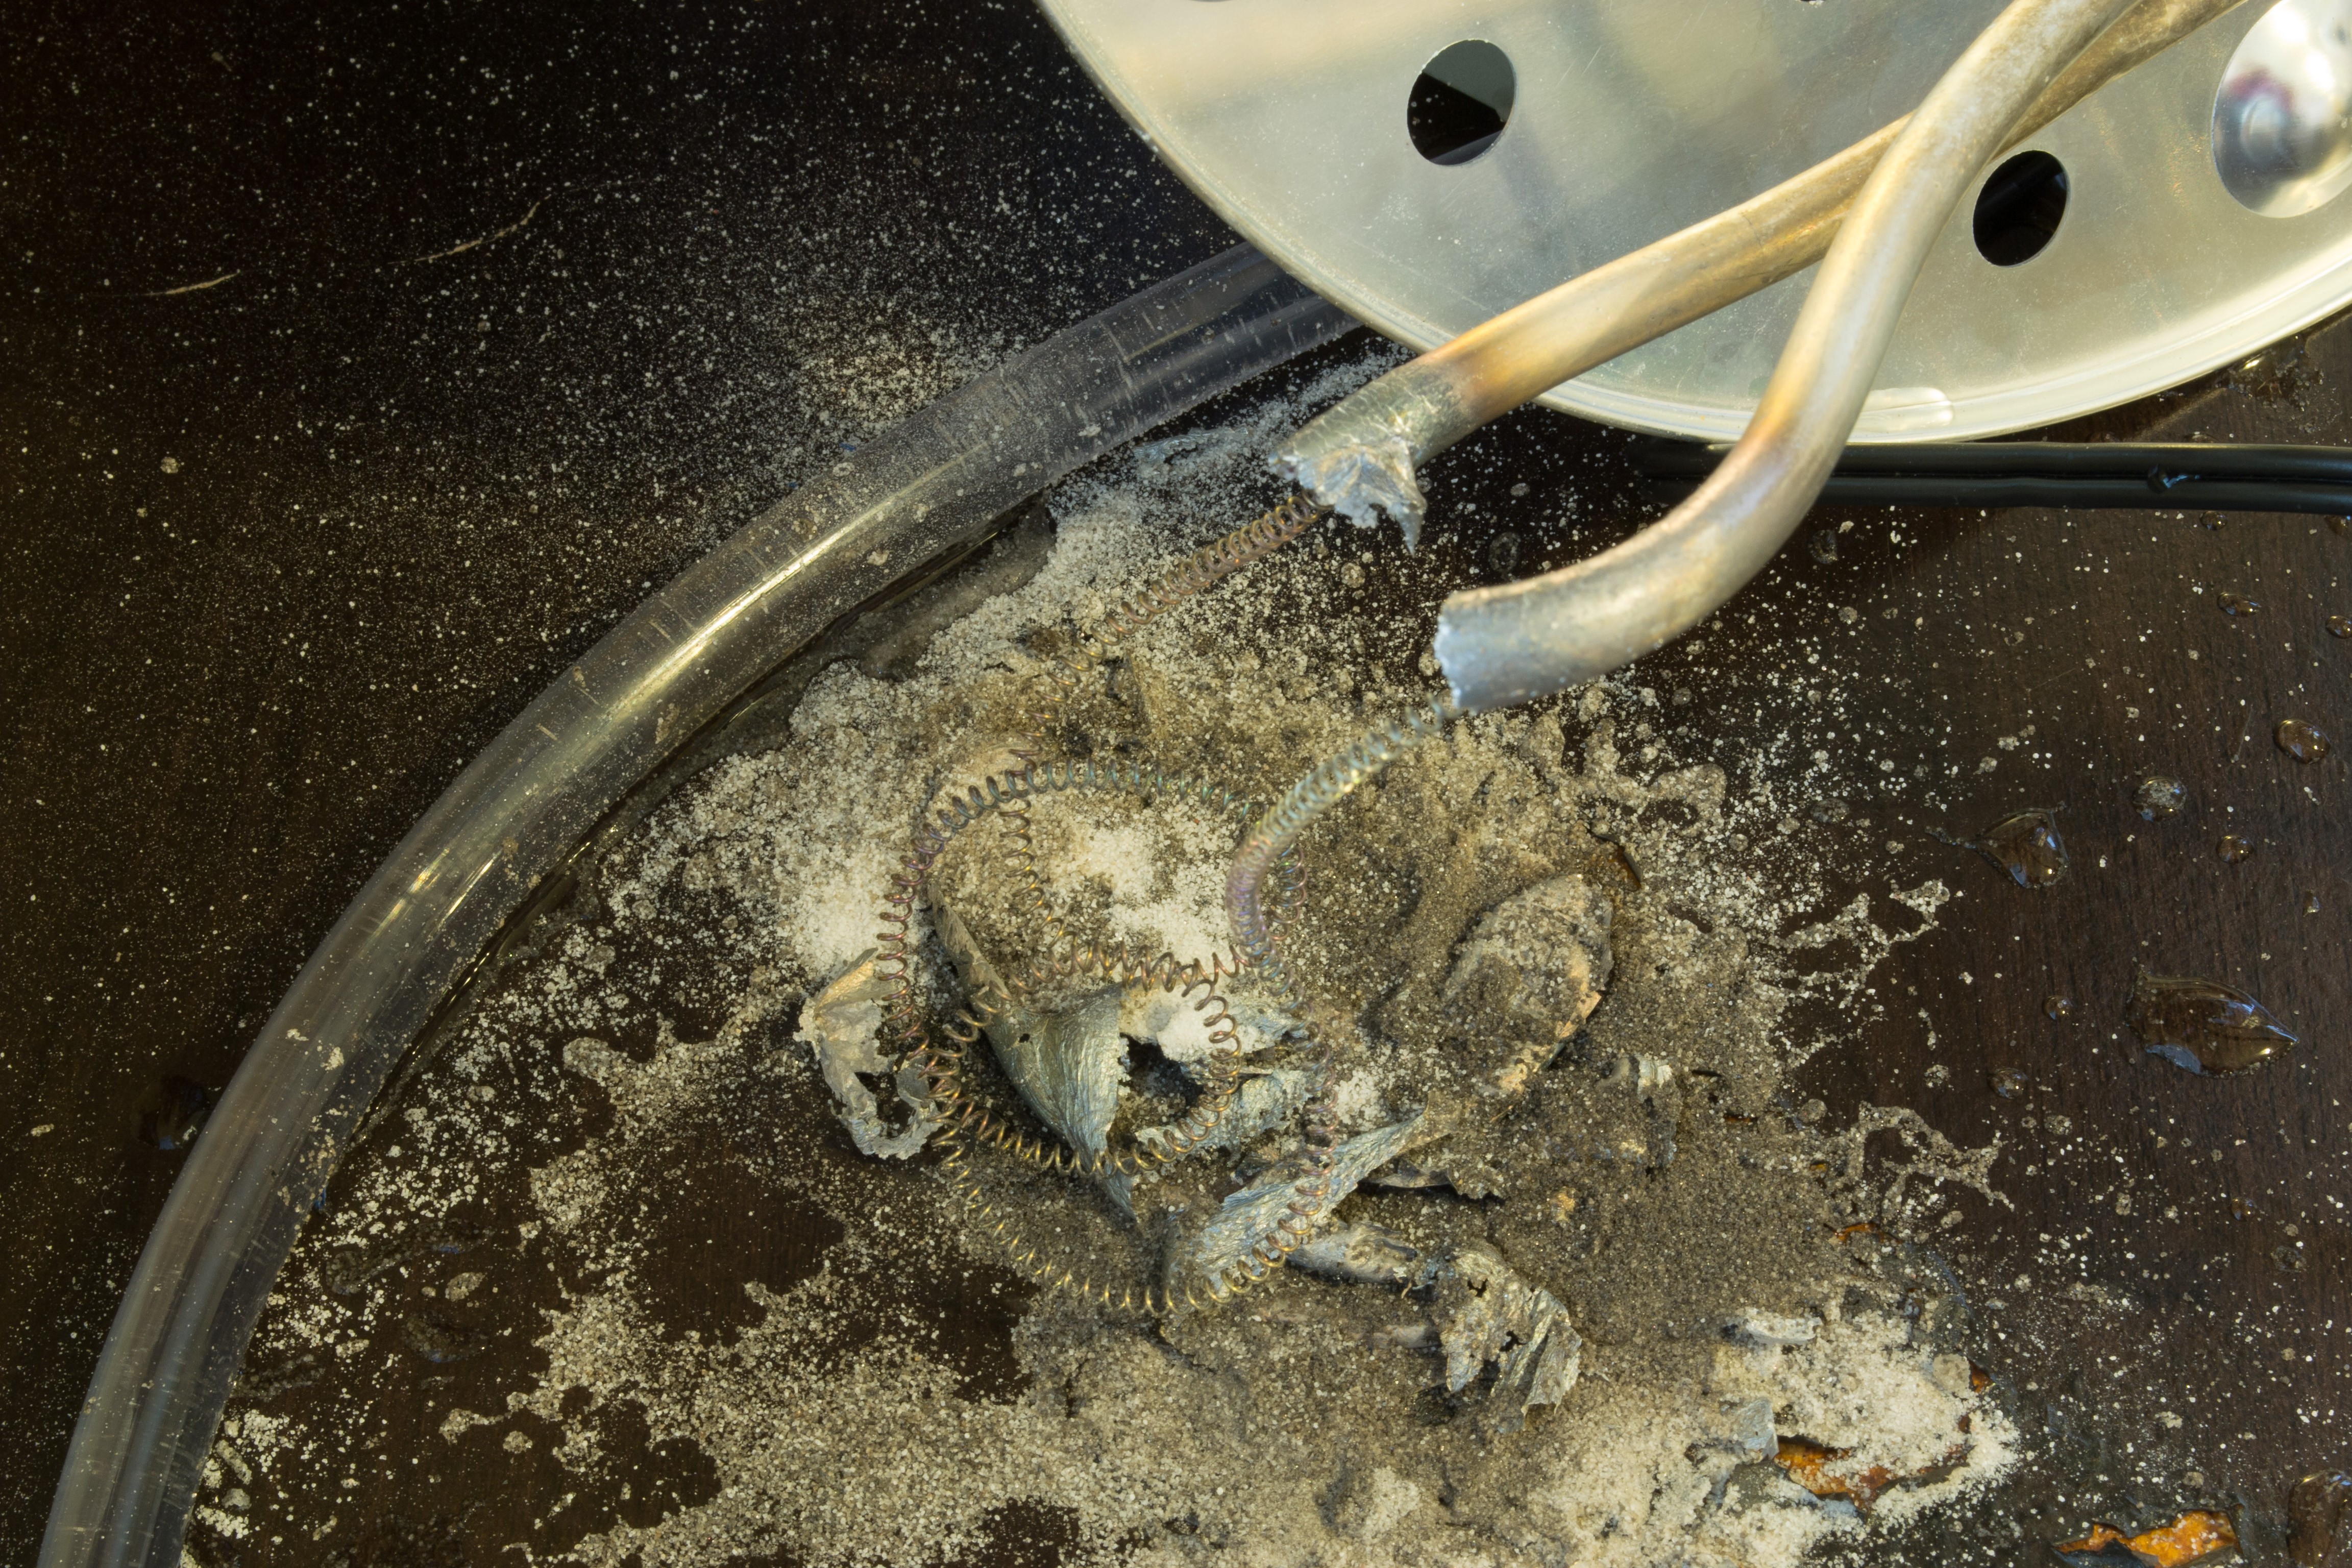
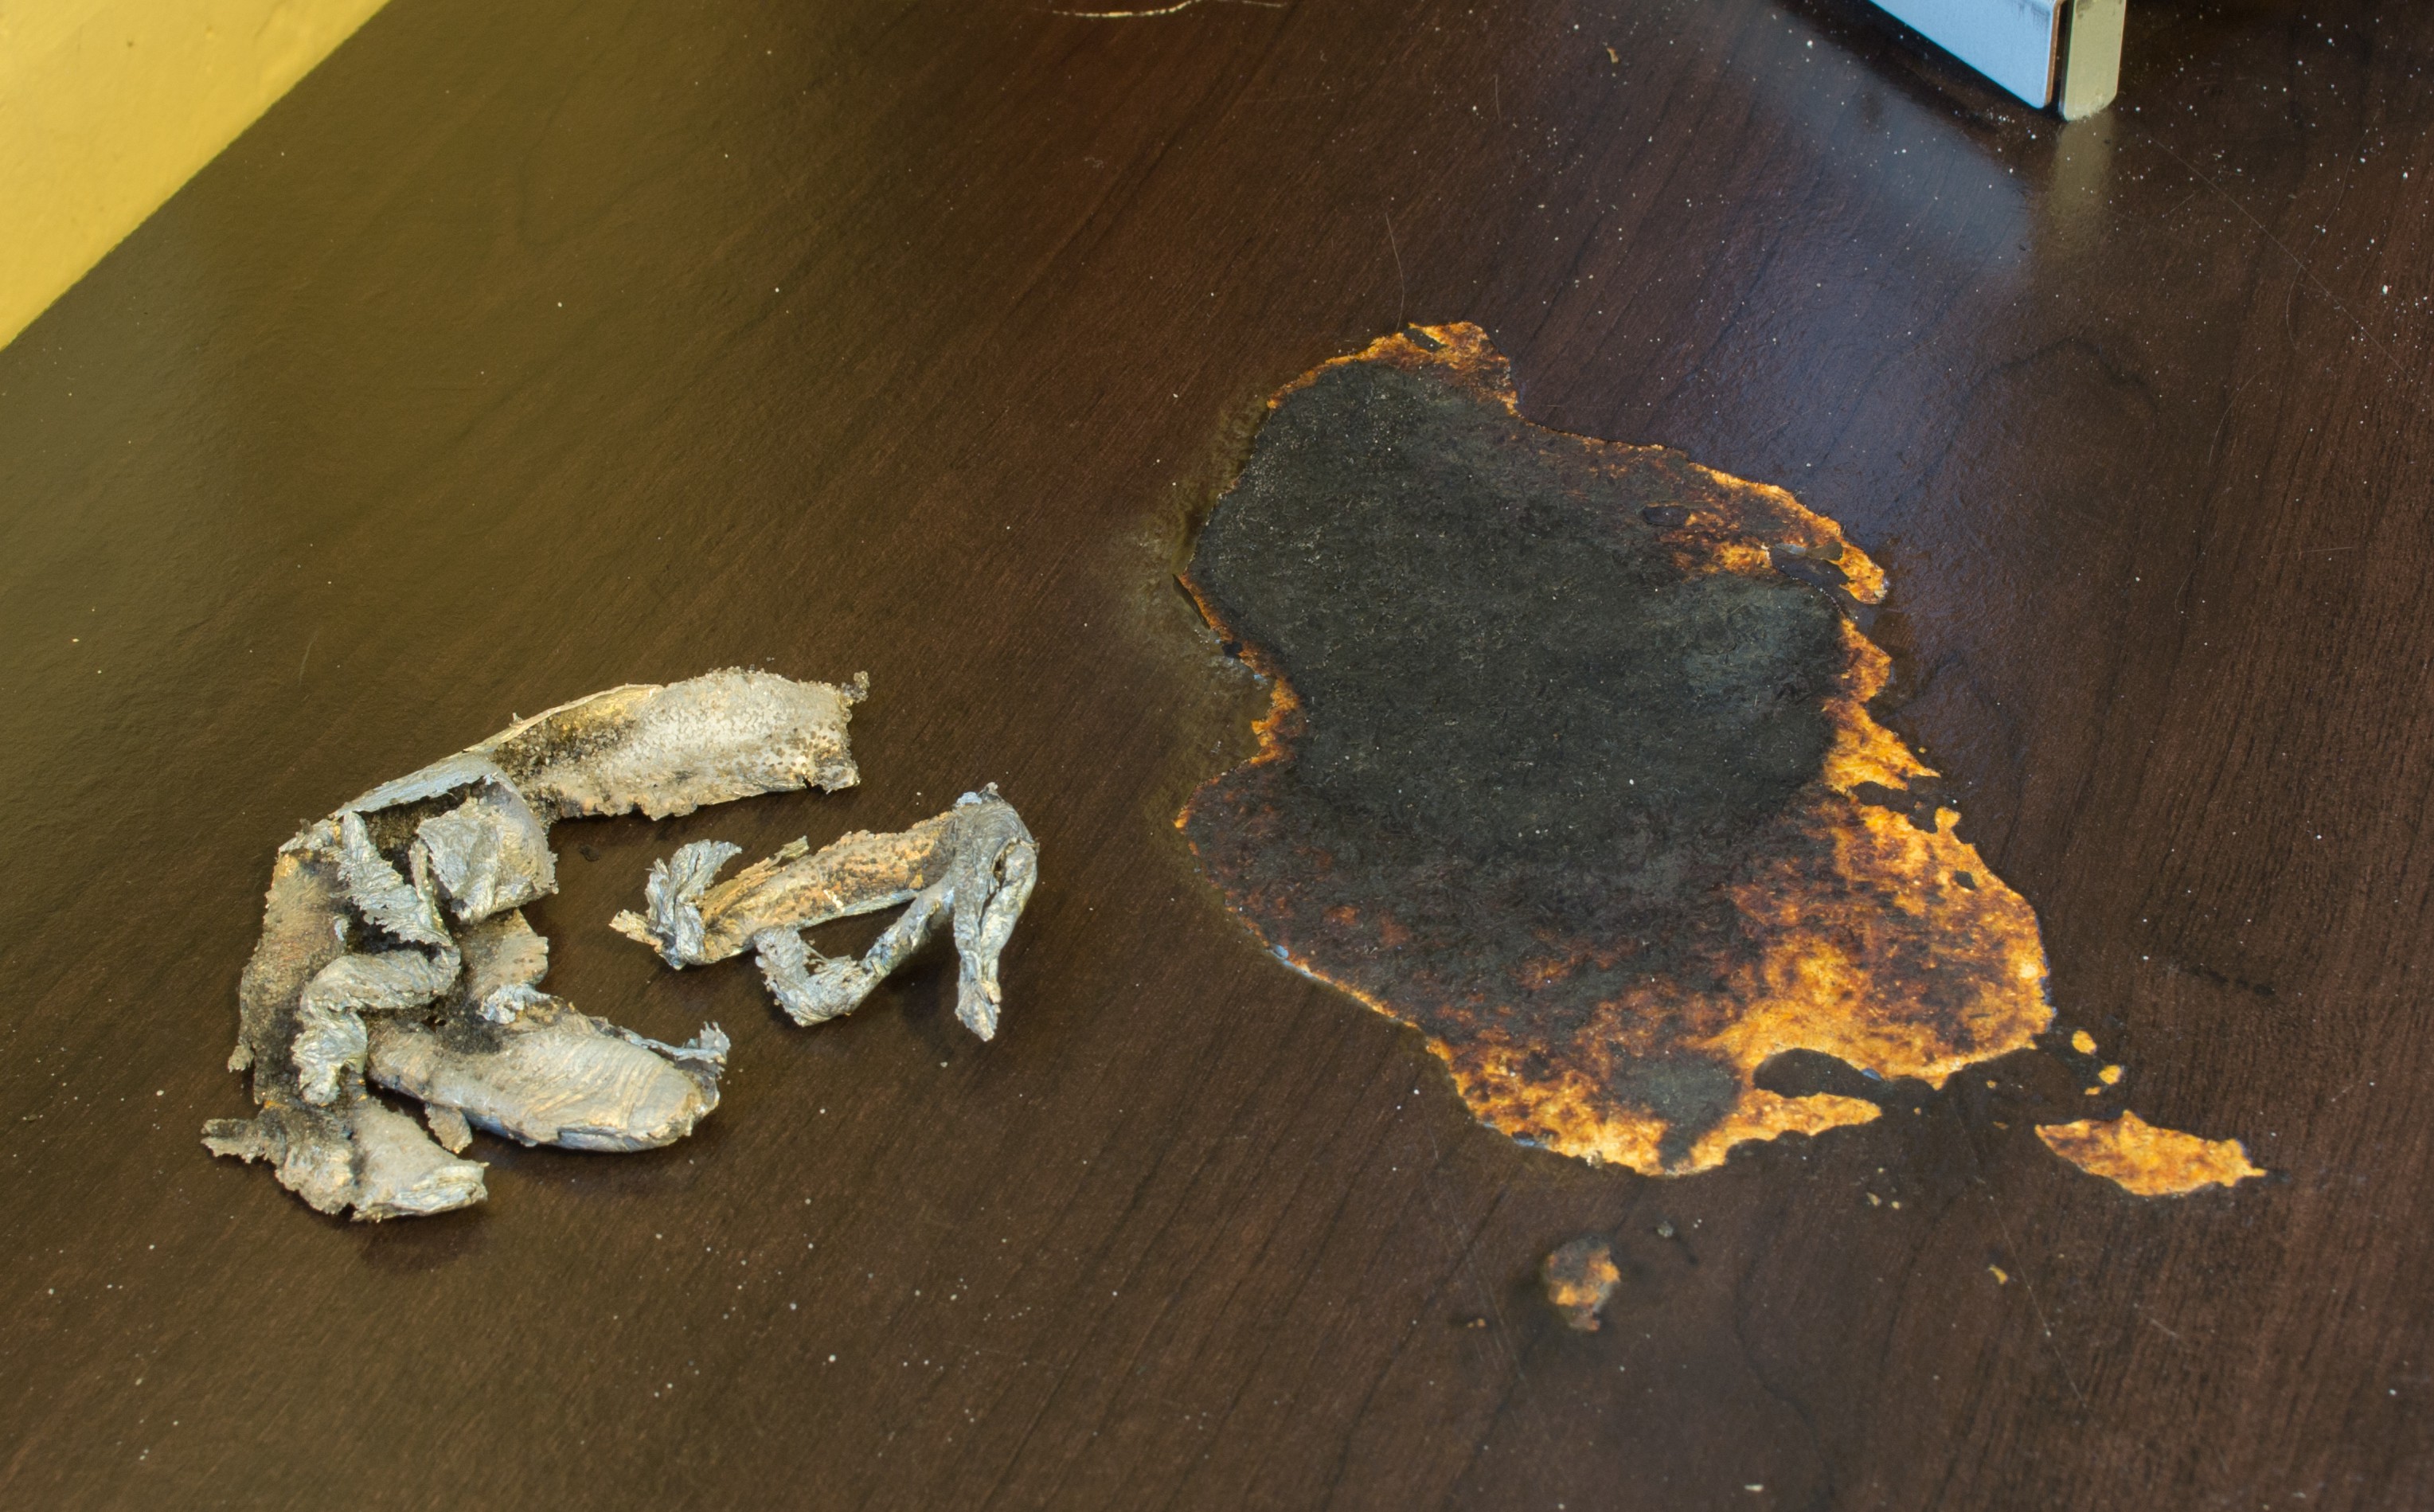
After a few hardy lung-fulls, the flame was out, and I could almost breathe a sigh of relief. However, there was still the threat from the liquid magma still burning through my cheap fiber board and plastic-topped table that was releasing a huge plume of noxious smoke. I remembered I had carried in gallons of cold water that was at my feet. Pouring this amount of water would have been overkill and difficult to control. It only needed a few dunkings of my hand into the water and letting it drip over the metal to cool it down sufficiently. Here's the aftermath.
![]()
![]()
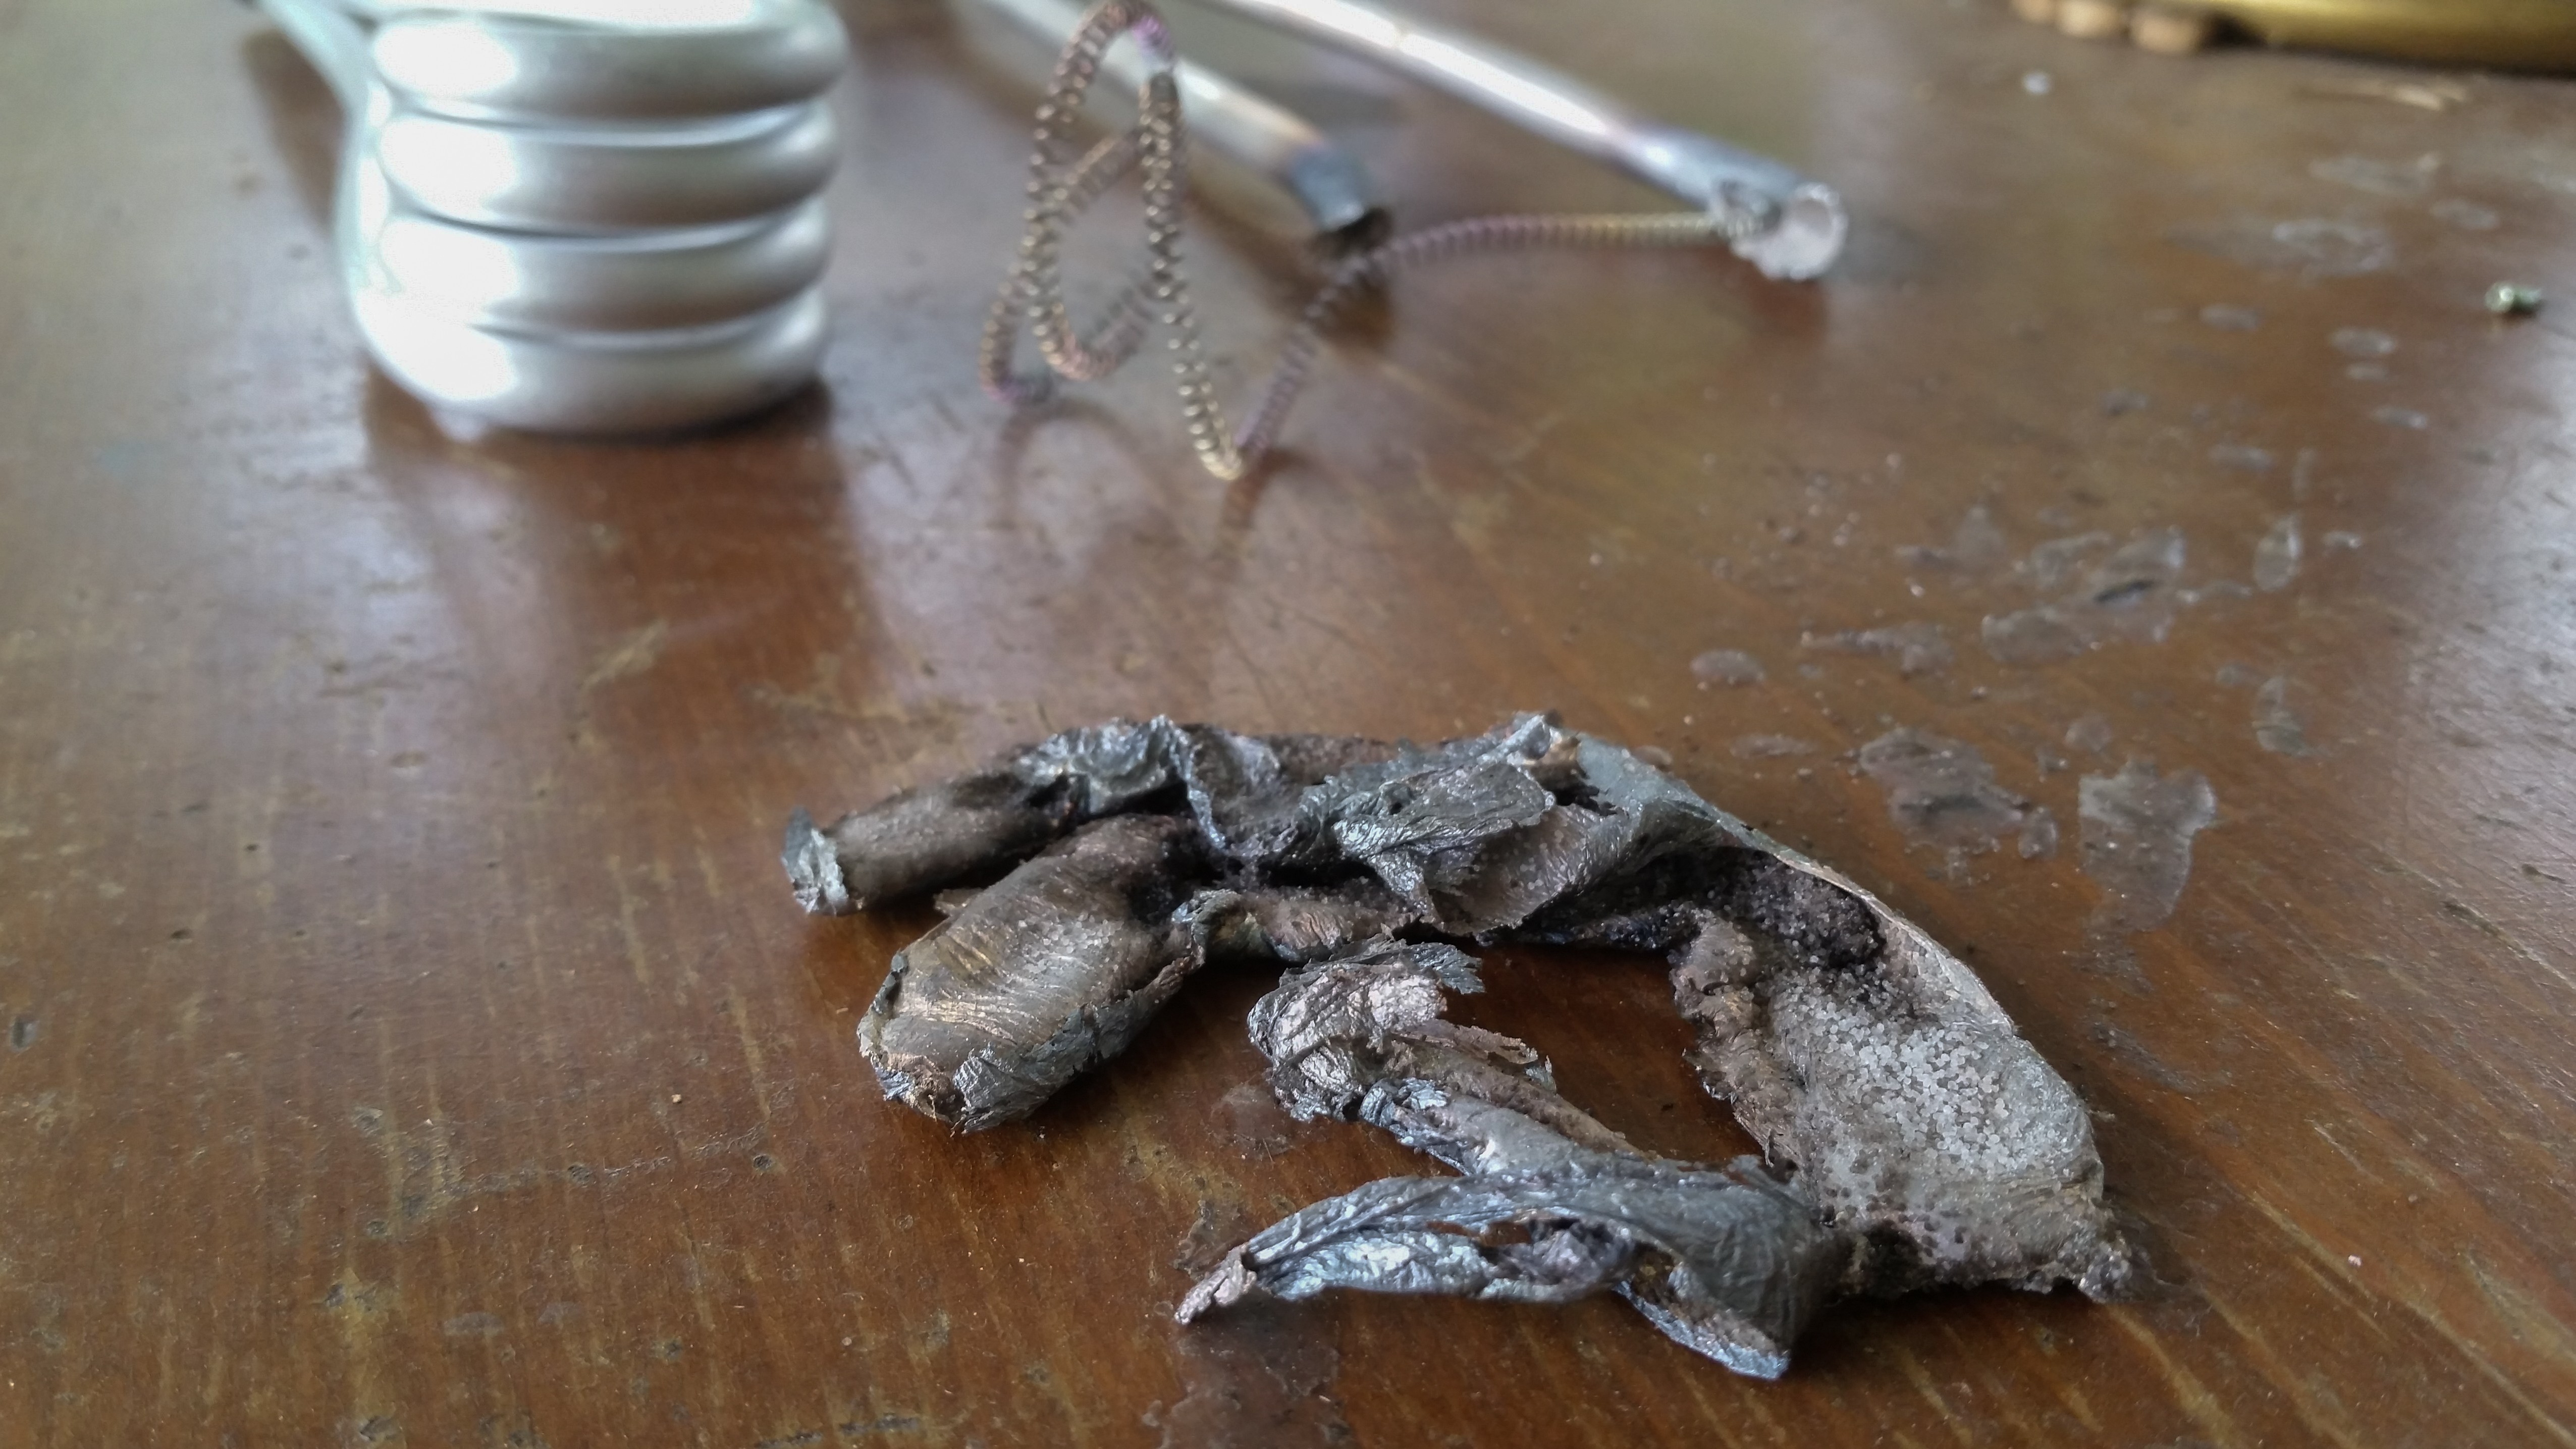
Here's the pile of melted metal and sand that was packed around the inner coil. Sand is everywhere from blowing out the flame.
![]()
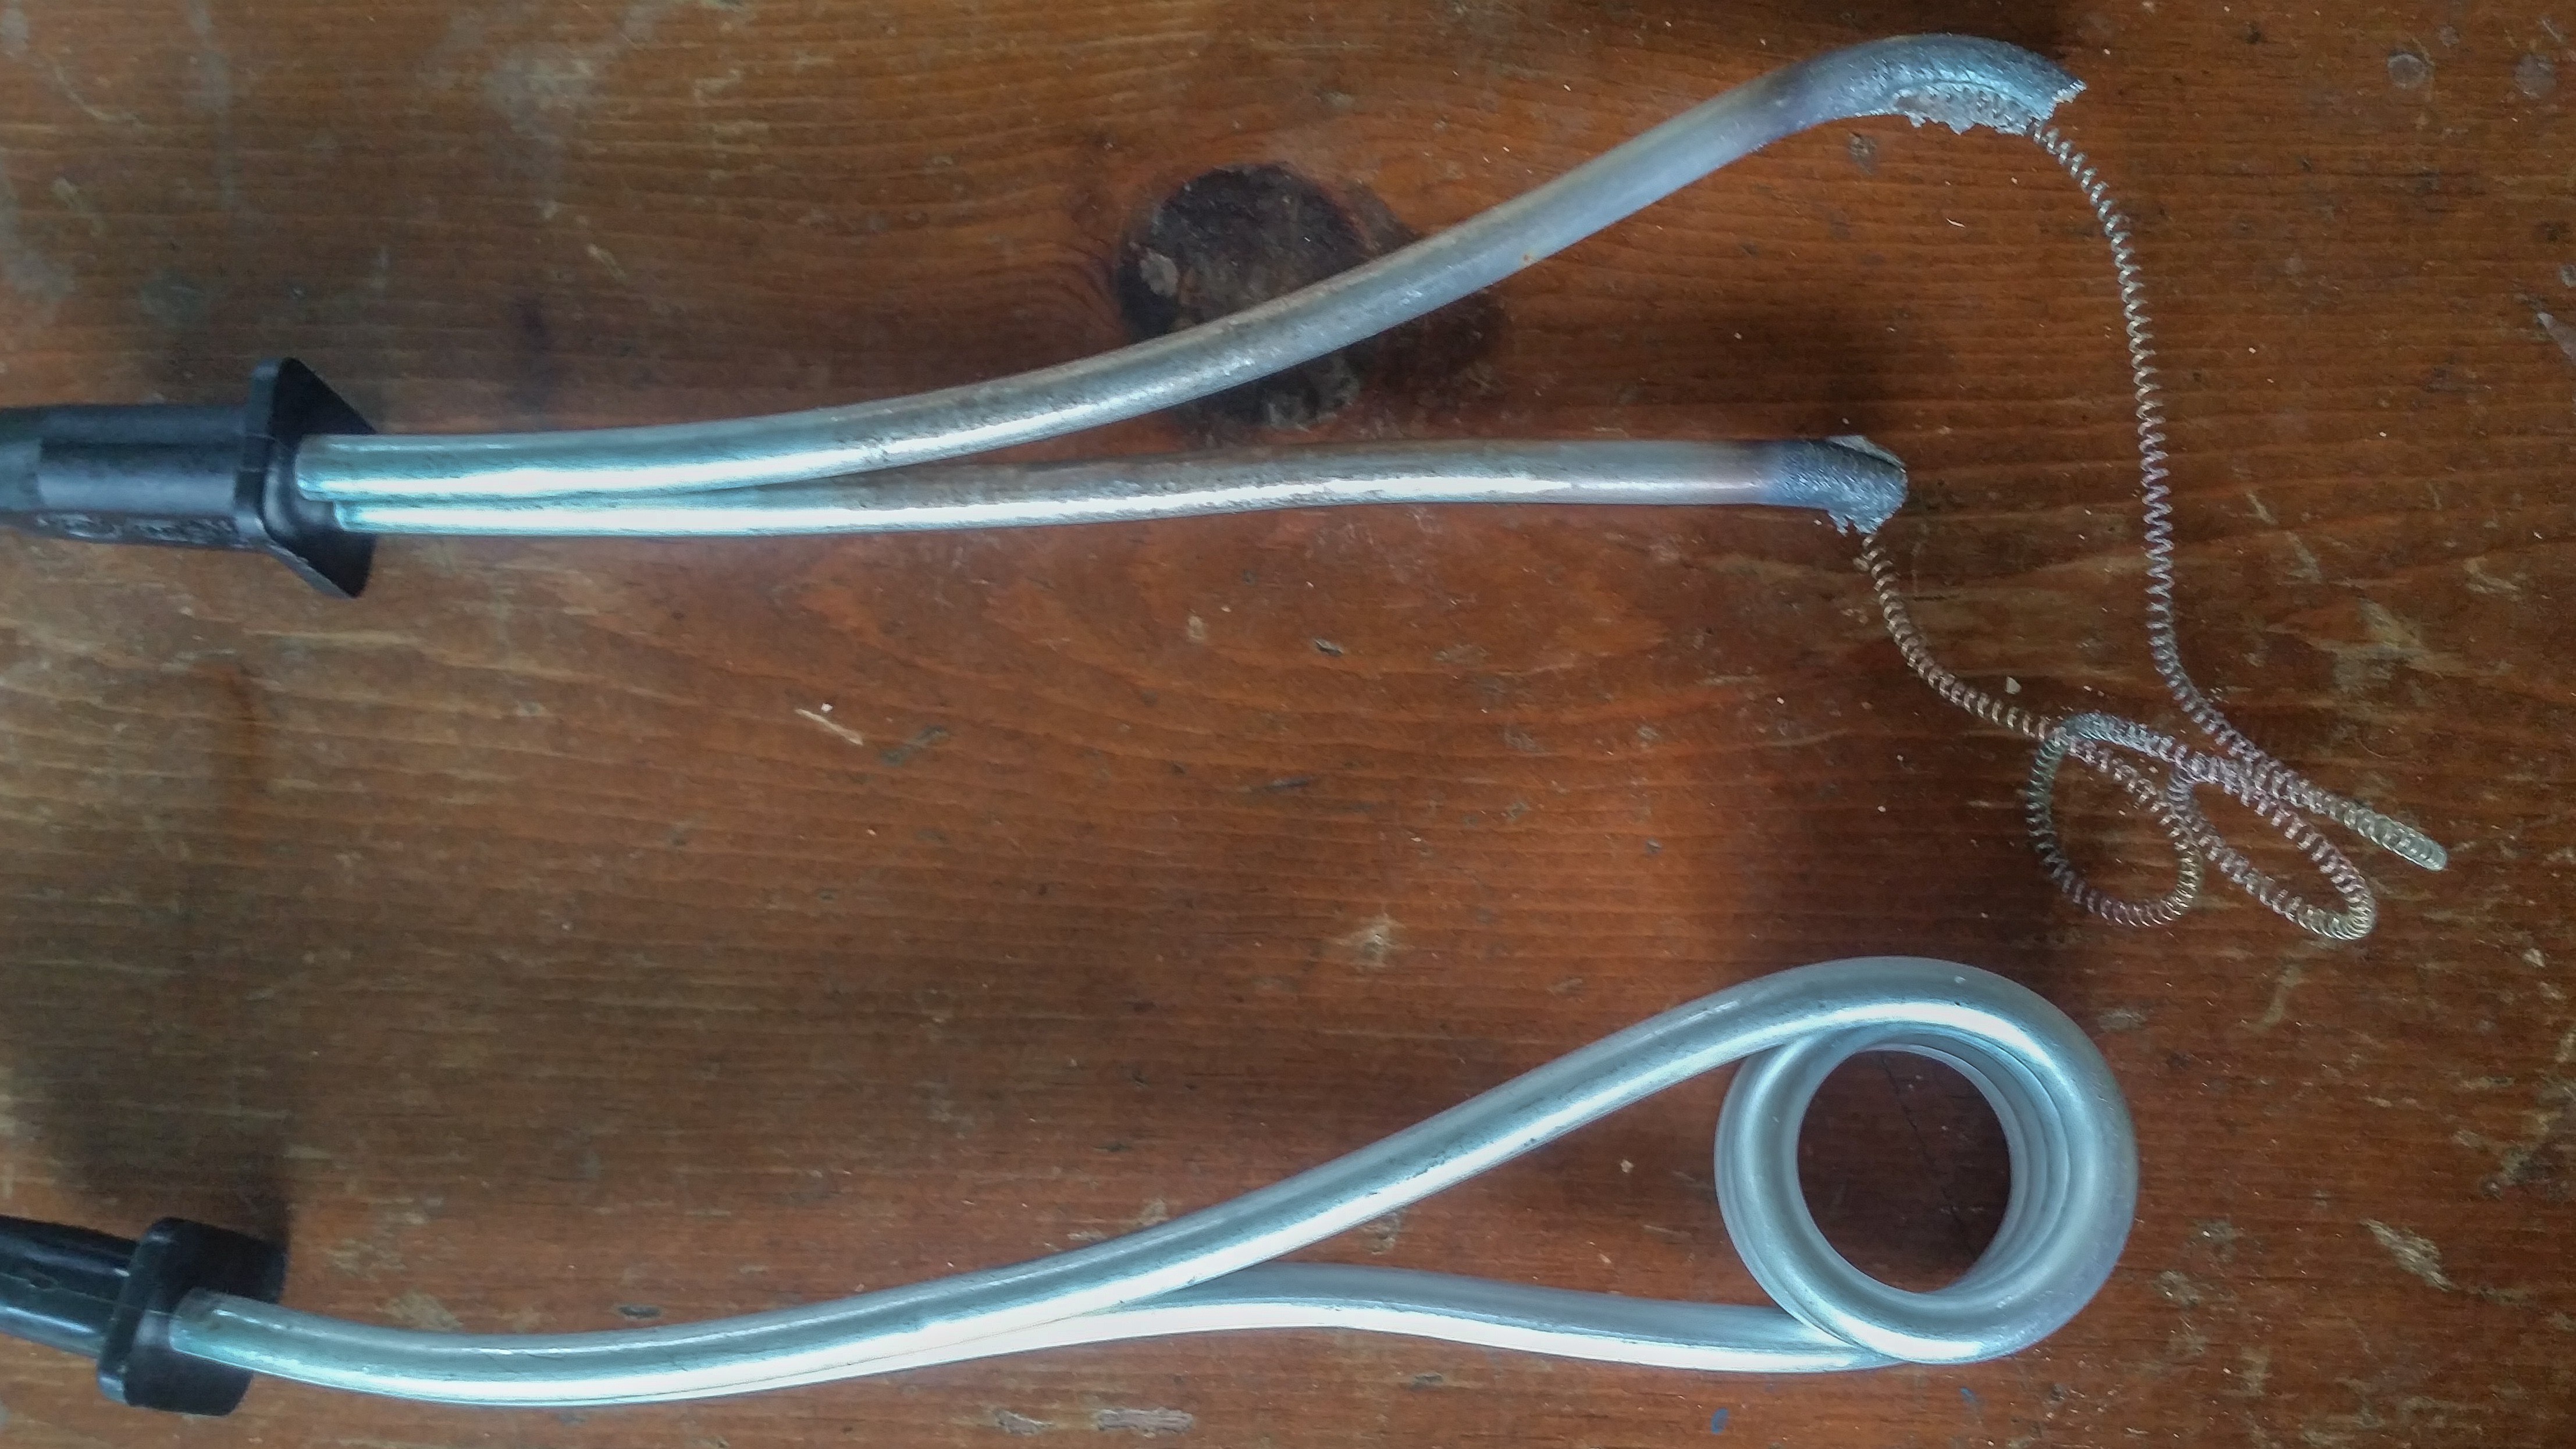
And here are some images to give you an idea of what the coil looked like originally.
![]()
![]()
So, what was to blame? Only myself.
Out of habit, after changing the PID settings, I mistakenly turned the PID controller back on, instead of waiting until I returned with the cold water! I pulled the element out to rest on the table and left the room with the pot of water.
Luckily I was in the house and found out a few minutes after it happened. The element was suspended in the air, so it wasn't going to cause any more harm after the metal surrounding it melted, but the molten metal that had fallen from it had started a small fire that could have grown larger.
If there's anything that can be learned from this incident, it's 1) be careful when using devices that have the potential to burn down your house or cause injury, and 2) invest in a higher quality heating element- one that would have just glowed red instead of causing a meltdown. I was fortunate this time but my cheap wooden table was not.
I took some photos and cleaned up my mess. Either because of similar past experiences or premonition, I had purchased two of these heating elements. Therefore, my experimenting could continue.
The setpoint wasn't quite being reached as quickly as I wanted, so I increased the Integrator max to 80.
Tuning 6
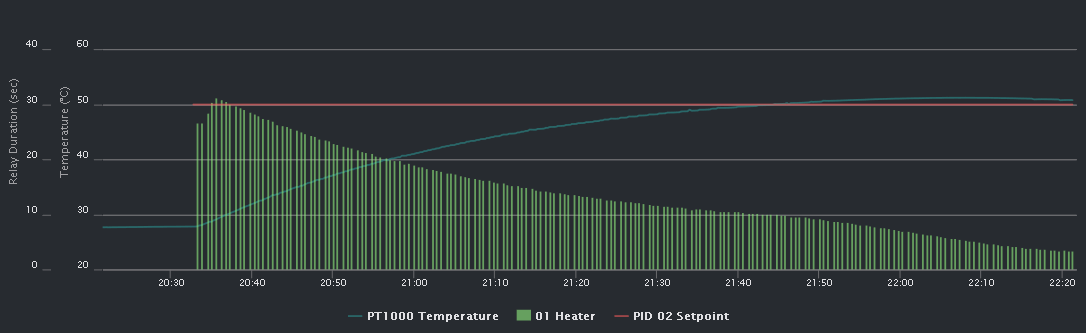
Kp: 1.0, Ki: 0.1, Kd: 0.1, Integrator max: 80
![]()
Finally, after the 6th 2-hour run, I was able to achieve a quick rise to the setpoint, with no overshoot and very little oscillation in order to maintain the temperature.
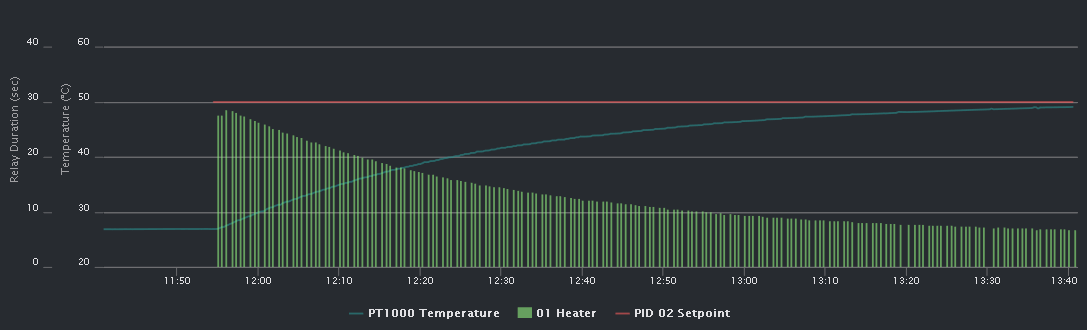
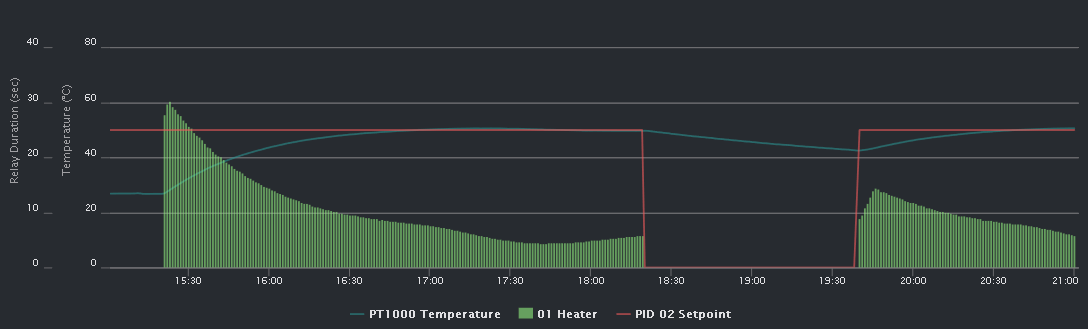
This last graph demonstrates how this PID tuning is efficient at regulating from another starting temperature. I turned off the PID to let the temperature fall, then turned it back on. See the results for yourself.
![]()
Besides from the minor setback, the sous vide PID tuning was a success, and I'll hopefully be enjoying a perfectly medium-rare ribeye steak tonight.
-
Software Updates: New Sensors and Methods
09/12/2016 at 15:29 • 0 commentsWhile eagerly waiting all my components for my [secret mycodo] project to arrive in the mail, I took the opportunity to update the mycodo software. Here are the highlights for each minor version update since the last software update log that covered the new Method feature:
v4.0.18: Add sensor: Atlas Scientific PT-1000 I2C temperature sensor.
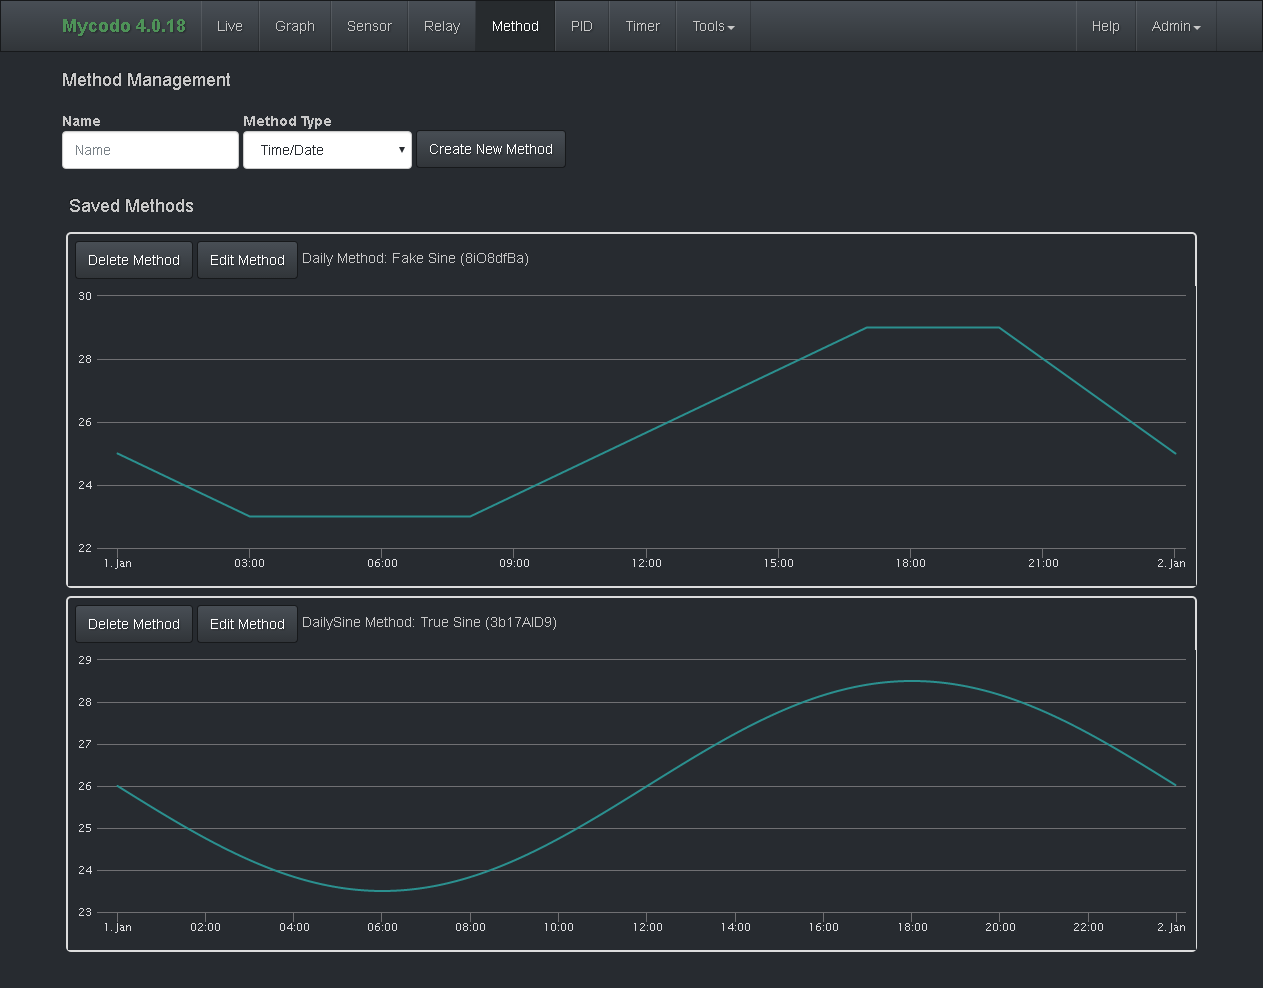
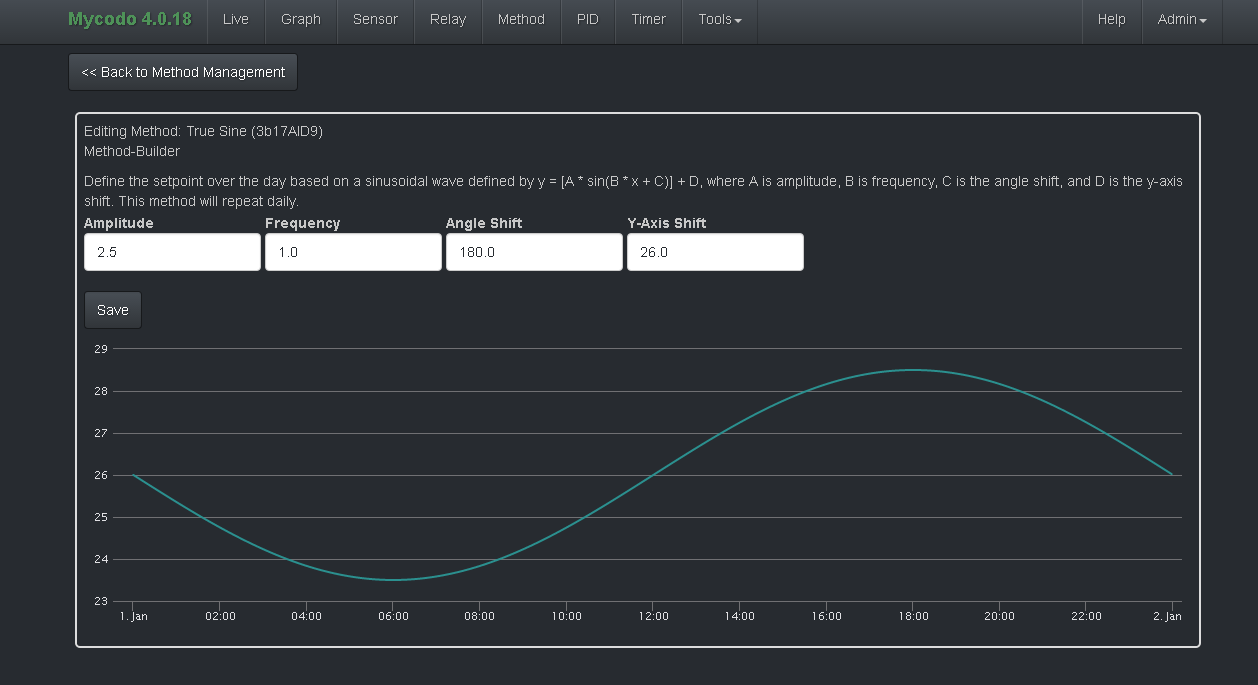
v4.0.17: Add new method type: Setpoint tracking of a sinusoidal wave that repeats daily.
v4.0.16: Add option to force browser to use SSL/HTTPS.
v4.0.15: Add sensor: HTU21D I2C temperature and humidity sensor.
v4.0.14: Add new method type: Setpoint tracking that repeats daily.
v4.0.13: Modify time-lapse method so it can resume if there is a power failure or reboot.
v4.0.12: Add ability to select I2C bus for all I2C devices, for TCA9545A I2C Bus Multiplexer.
v4.0.11: Add Pi camera streaming and time-lapse functionality; fix still image capture.
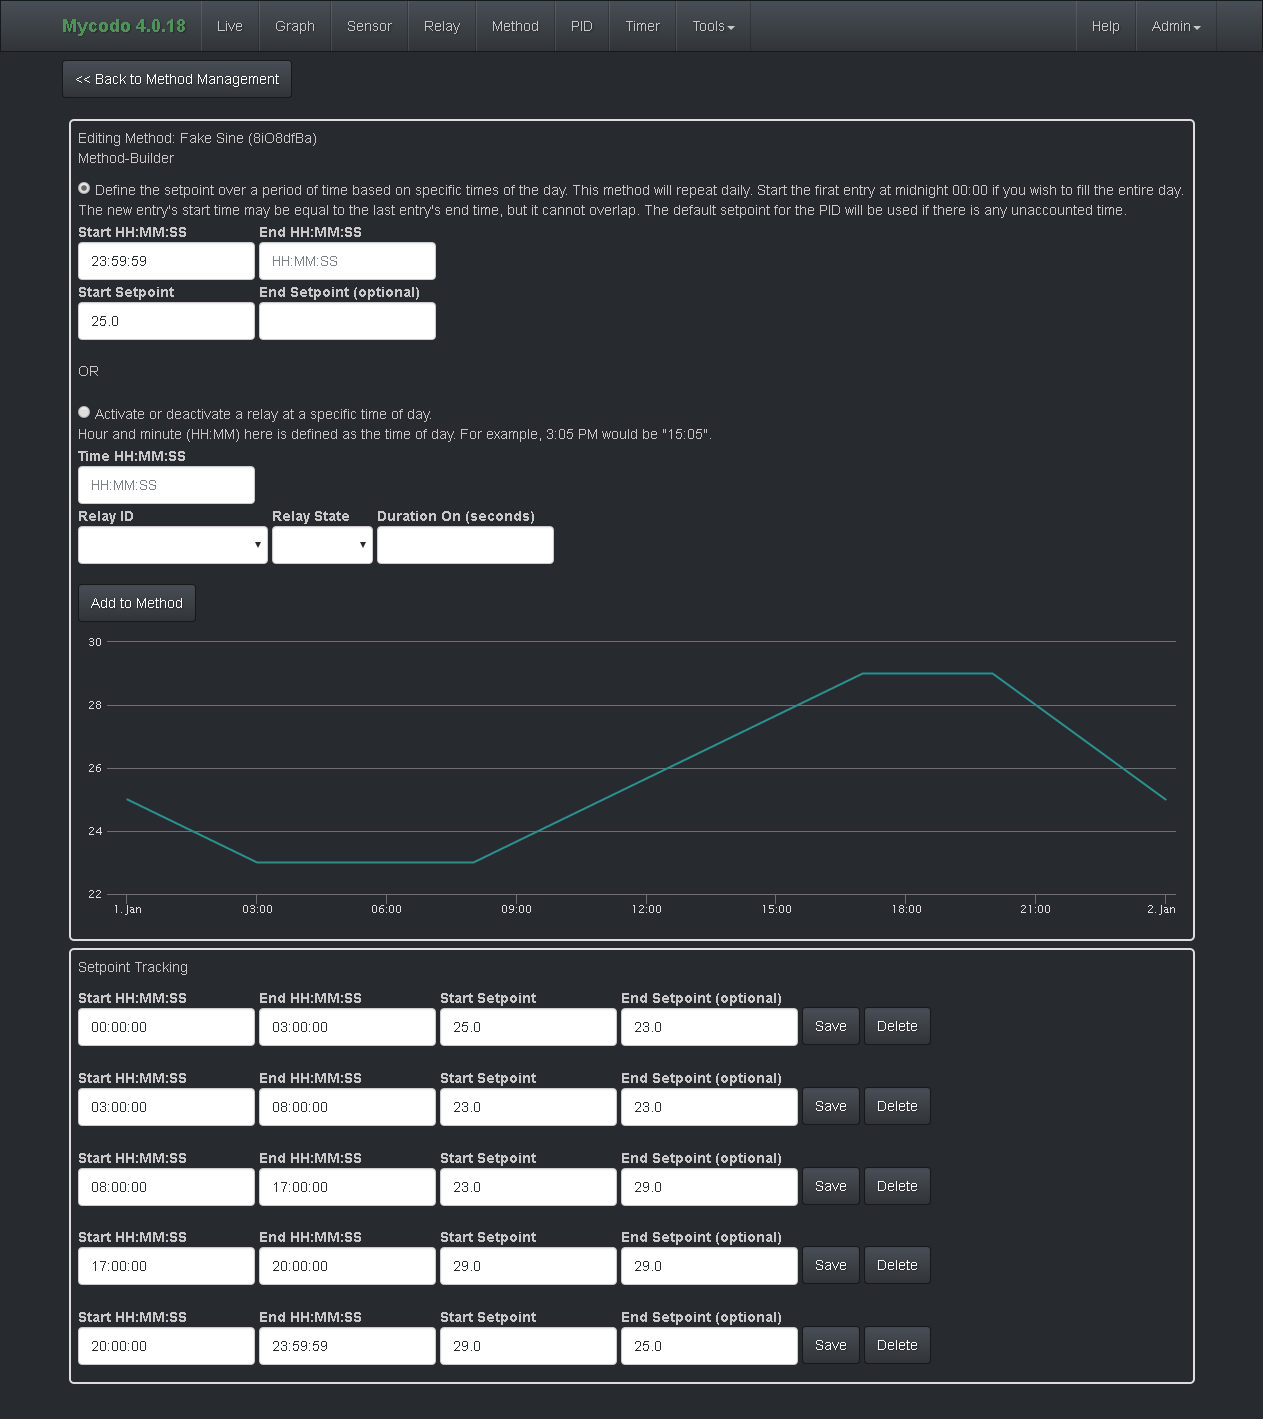
With the addition of two new method types to track a setpoint over the day and repeat each day, there are a lot of new possible uses for mycodo. These two types allow the user to exactly define what the regulation setpoint should be at any point of the day. For instance, if you want to raise the temperature mid-day and lower it at night every day, this is now possible. The new sine wave daily repeating method allows the user to define a sine wave based on amplitude, frequency, angle shift, and y-axis shift, to enable smooth setpoint tracking, so you can do things such as create a setpoint change across the day to mimic the swing you commonly see with temperature or humidity.![]()
![]()
![]()
For new sensors, we have the HTU21D temperature and humidity sensor and the Atlas Scientific PT-1000 industrial temperature sensor. The HTU21D is an affordable (breakout boards are $4 on ebay) I2C temperature sensor. It lacks the filter membrane of its sister chip, the HTU21D-F, but this is something you can create yourself and save $15. Next, the Atlas Scientific PT-1000 is a high-range industrial temperature probe and I2C-enabled (also UART) circuit board to process the signal. Encased in a waterproof cable and with the removable thermowell, temperatures can be measured indefinitely from a submerged environment, from -200°C to 850°C.
-
Full Electrical Connectivity
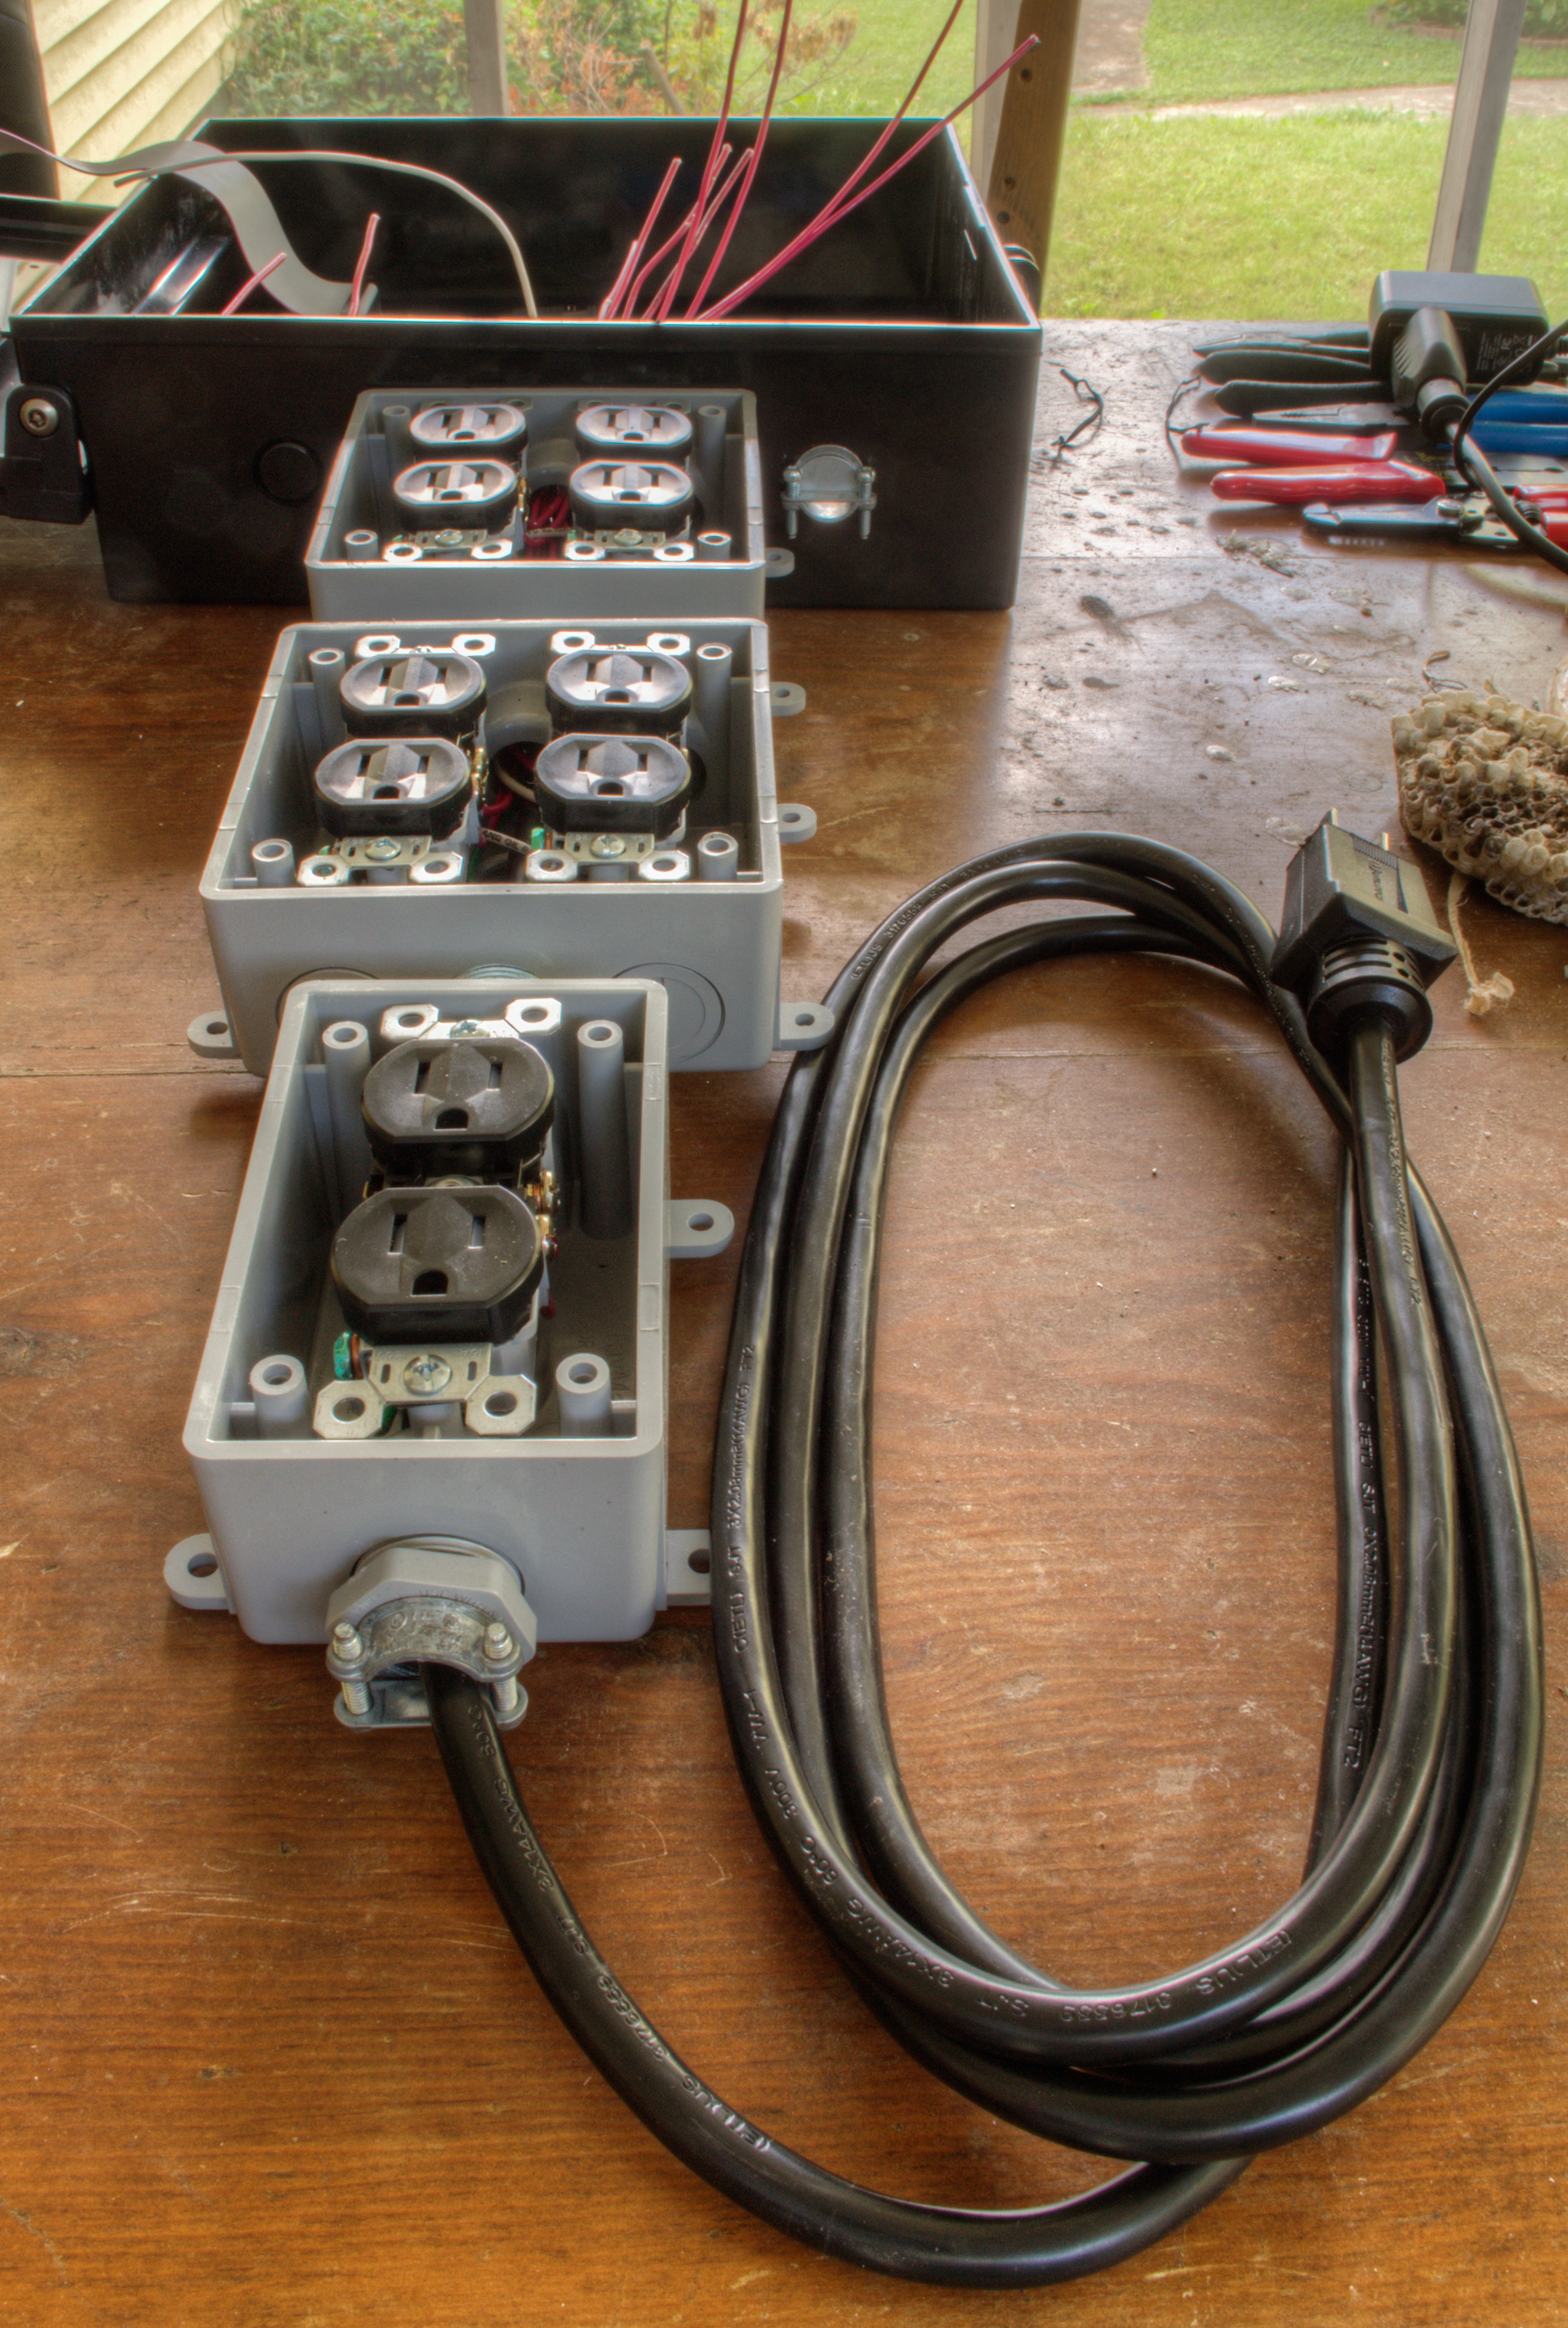
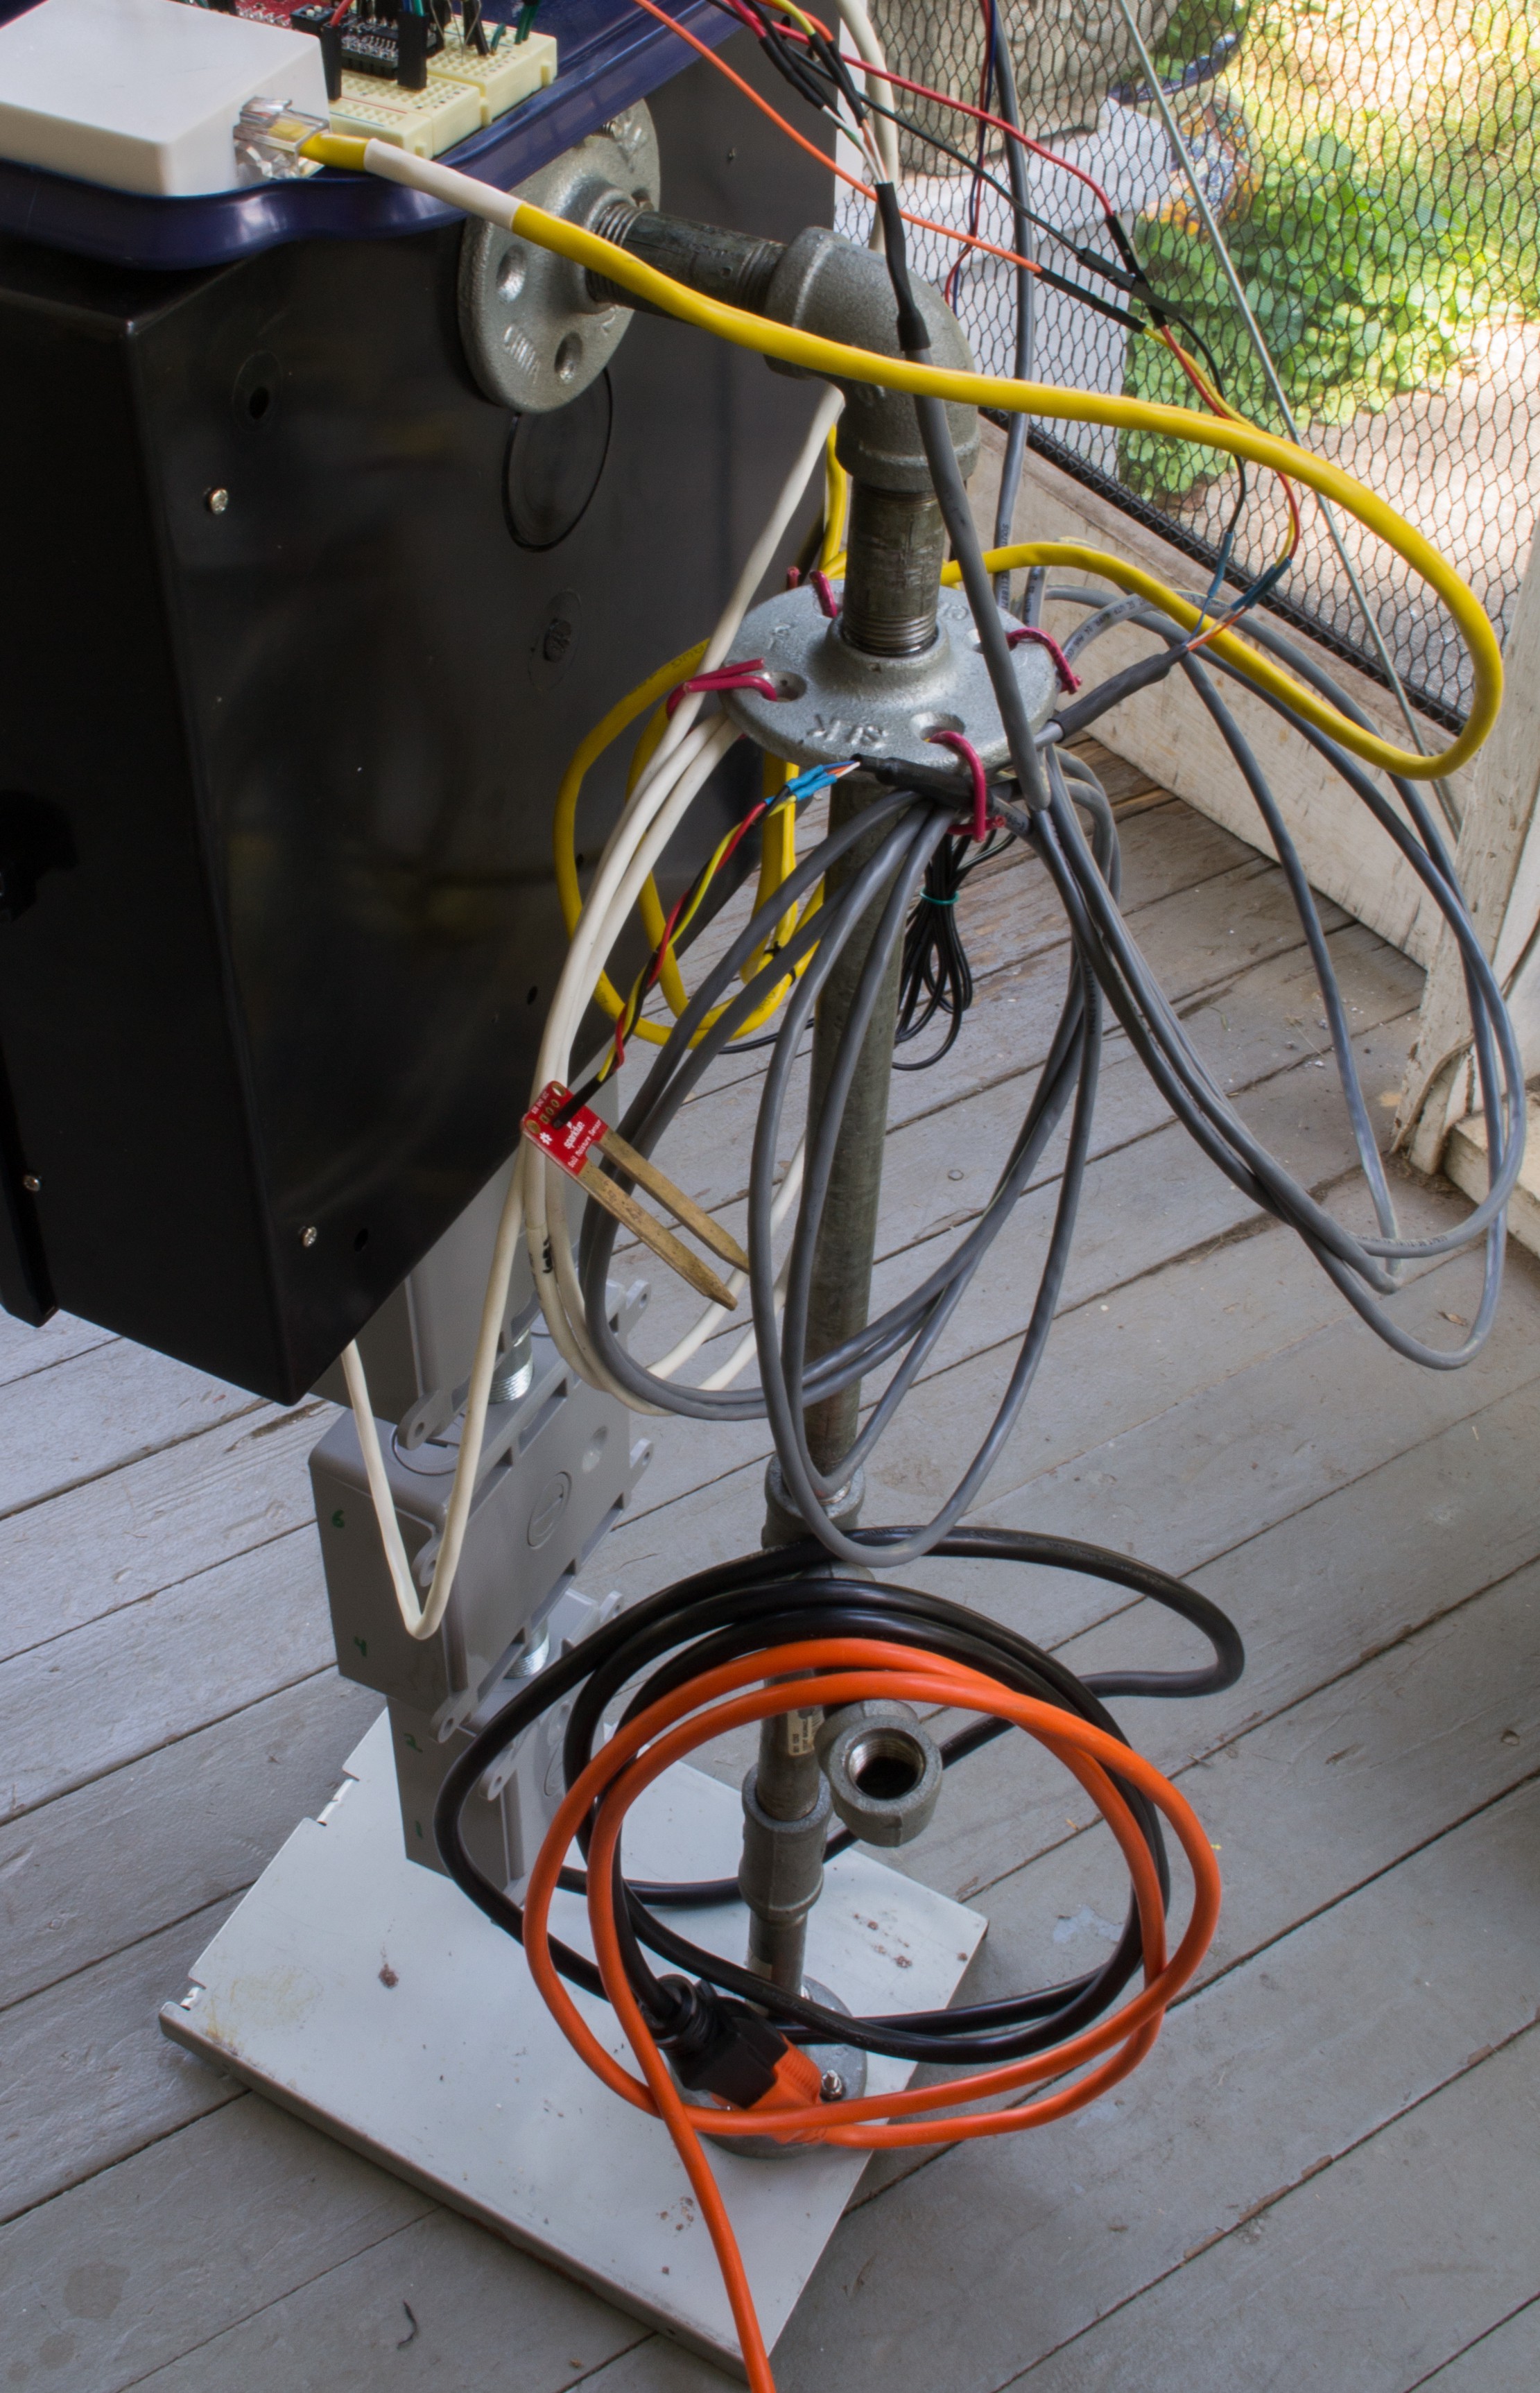
09/05/2016 at 19:53 • 0 commentsIt was time for all the components to finally come together and to fully power the system. Power was fed through the bottom and passed through all outlet boxes.
![]()
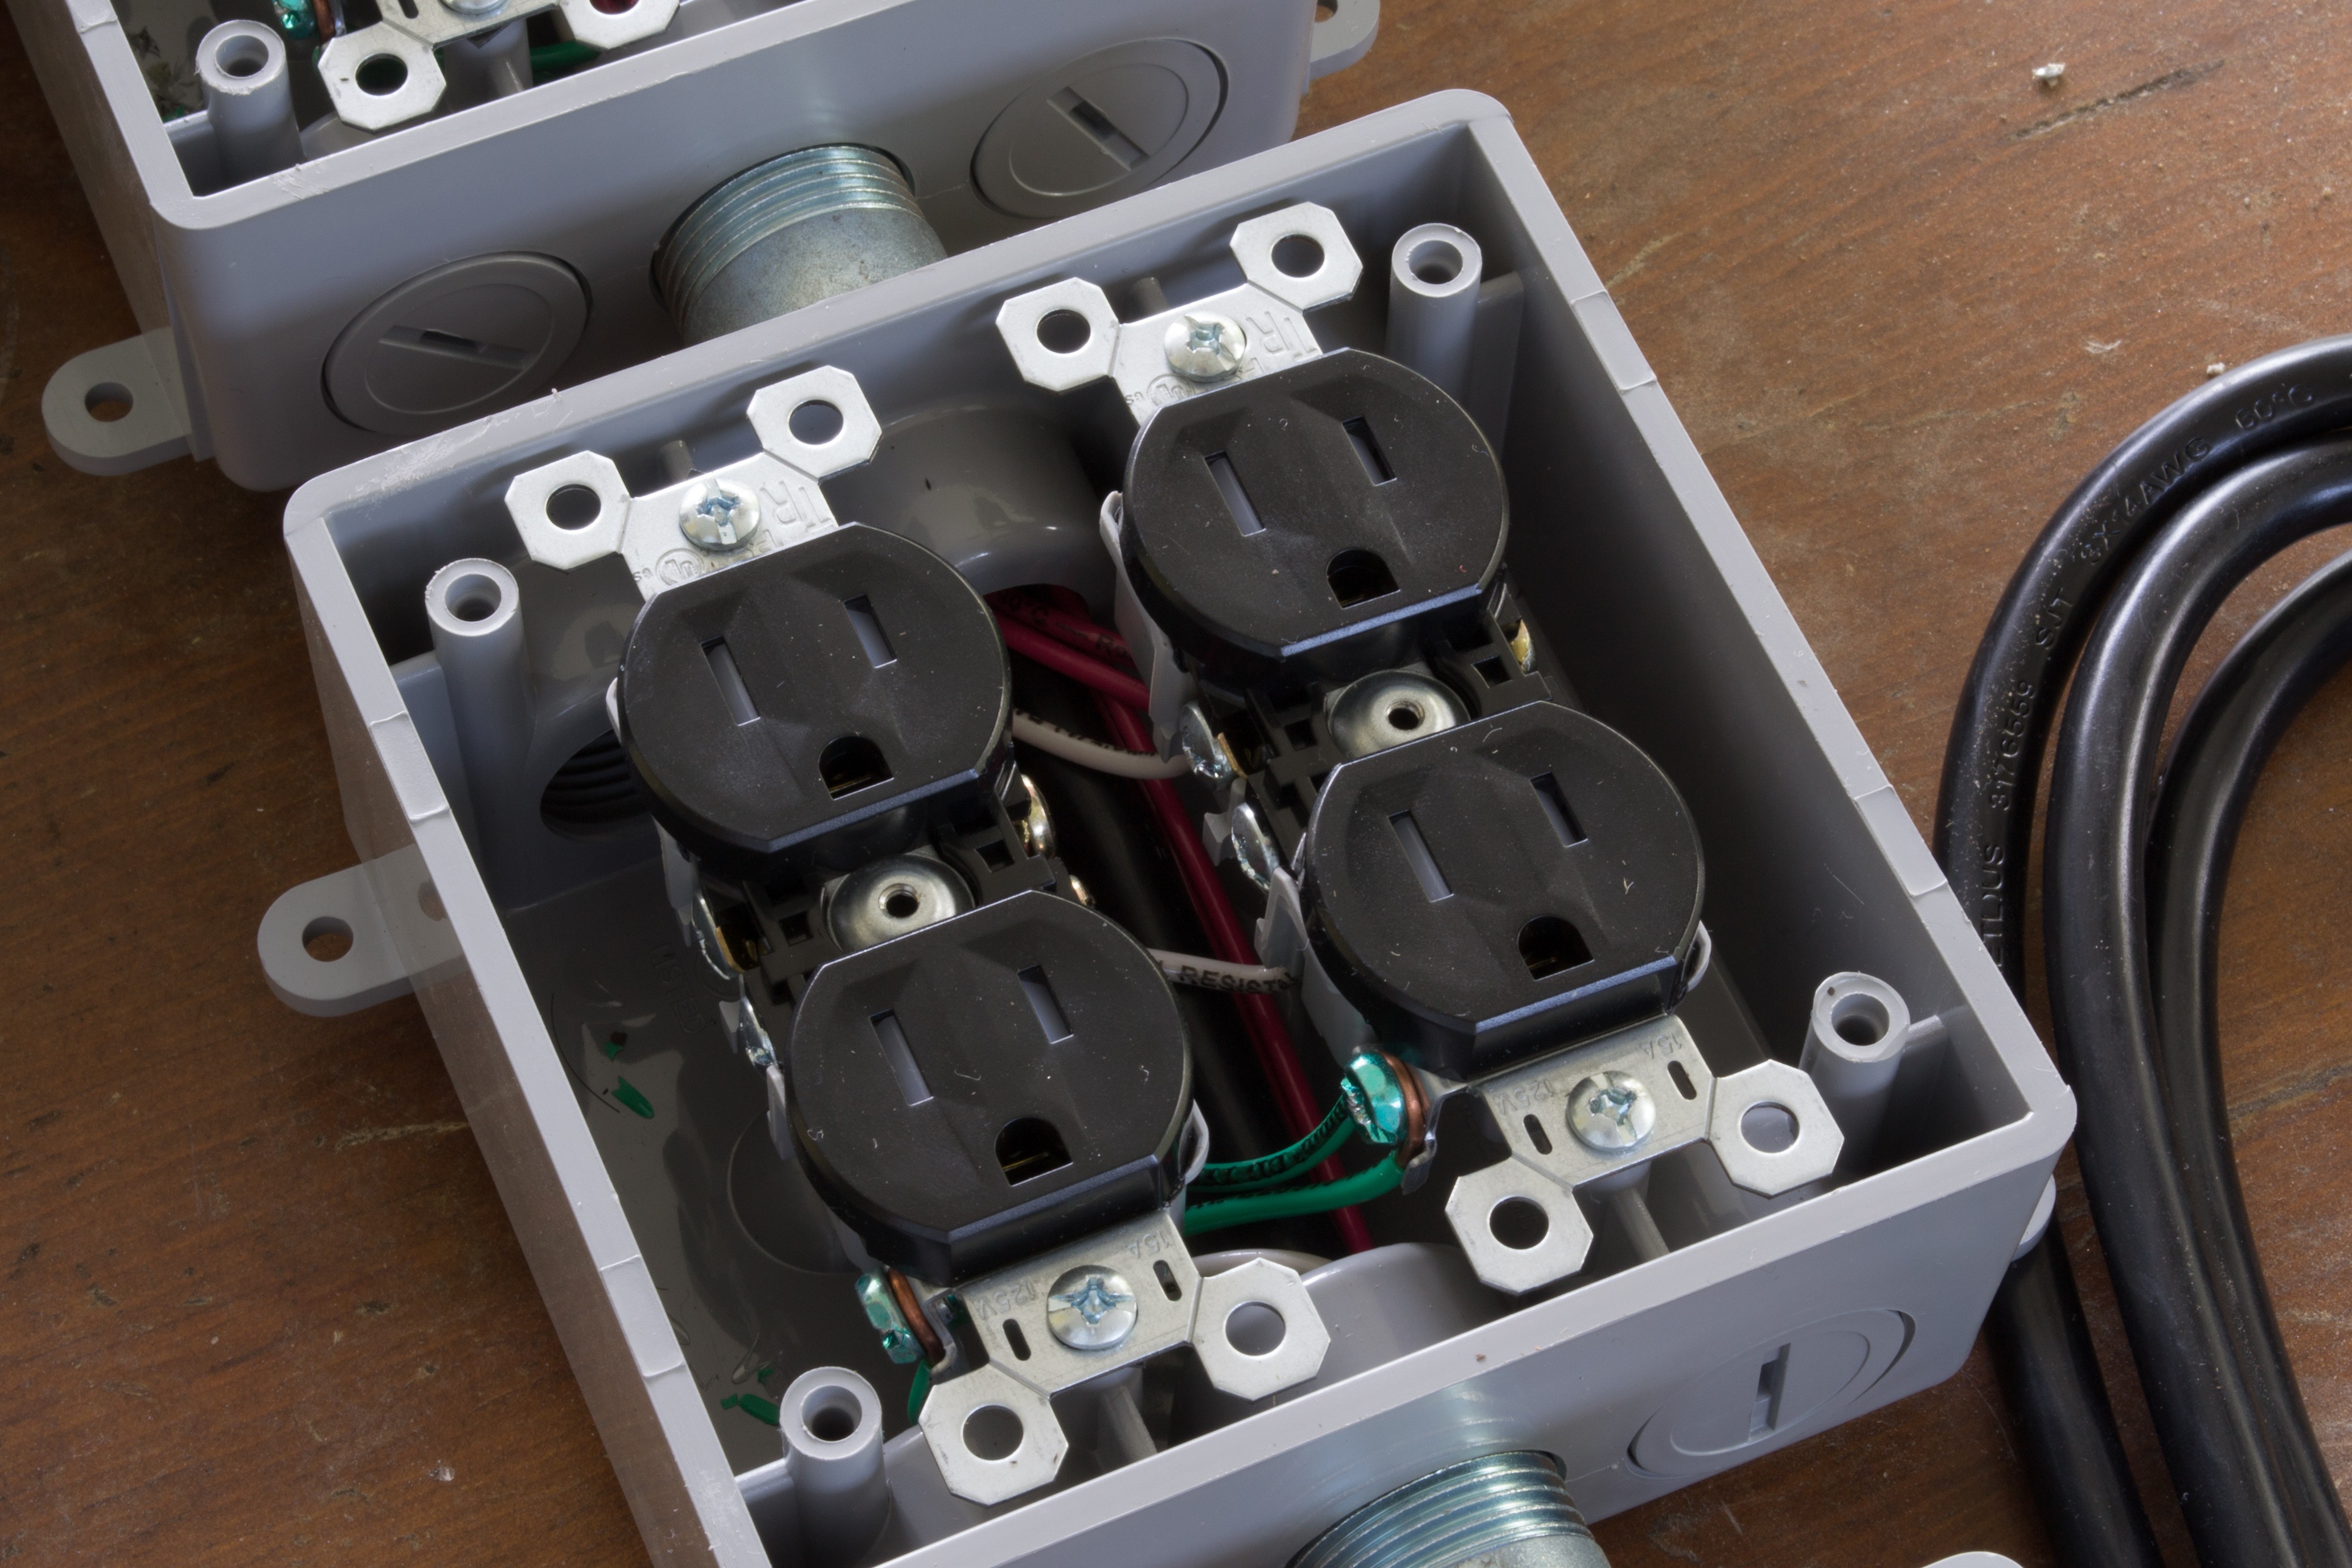
It's pretty tight at the very top, where all the wires must pass.
![]()
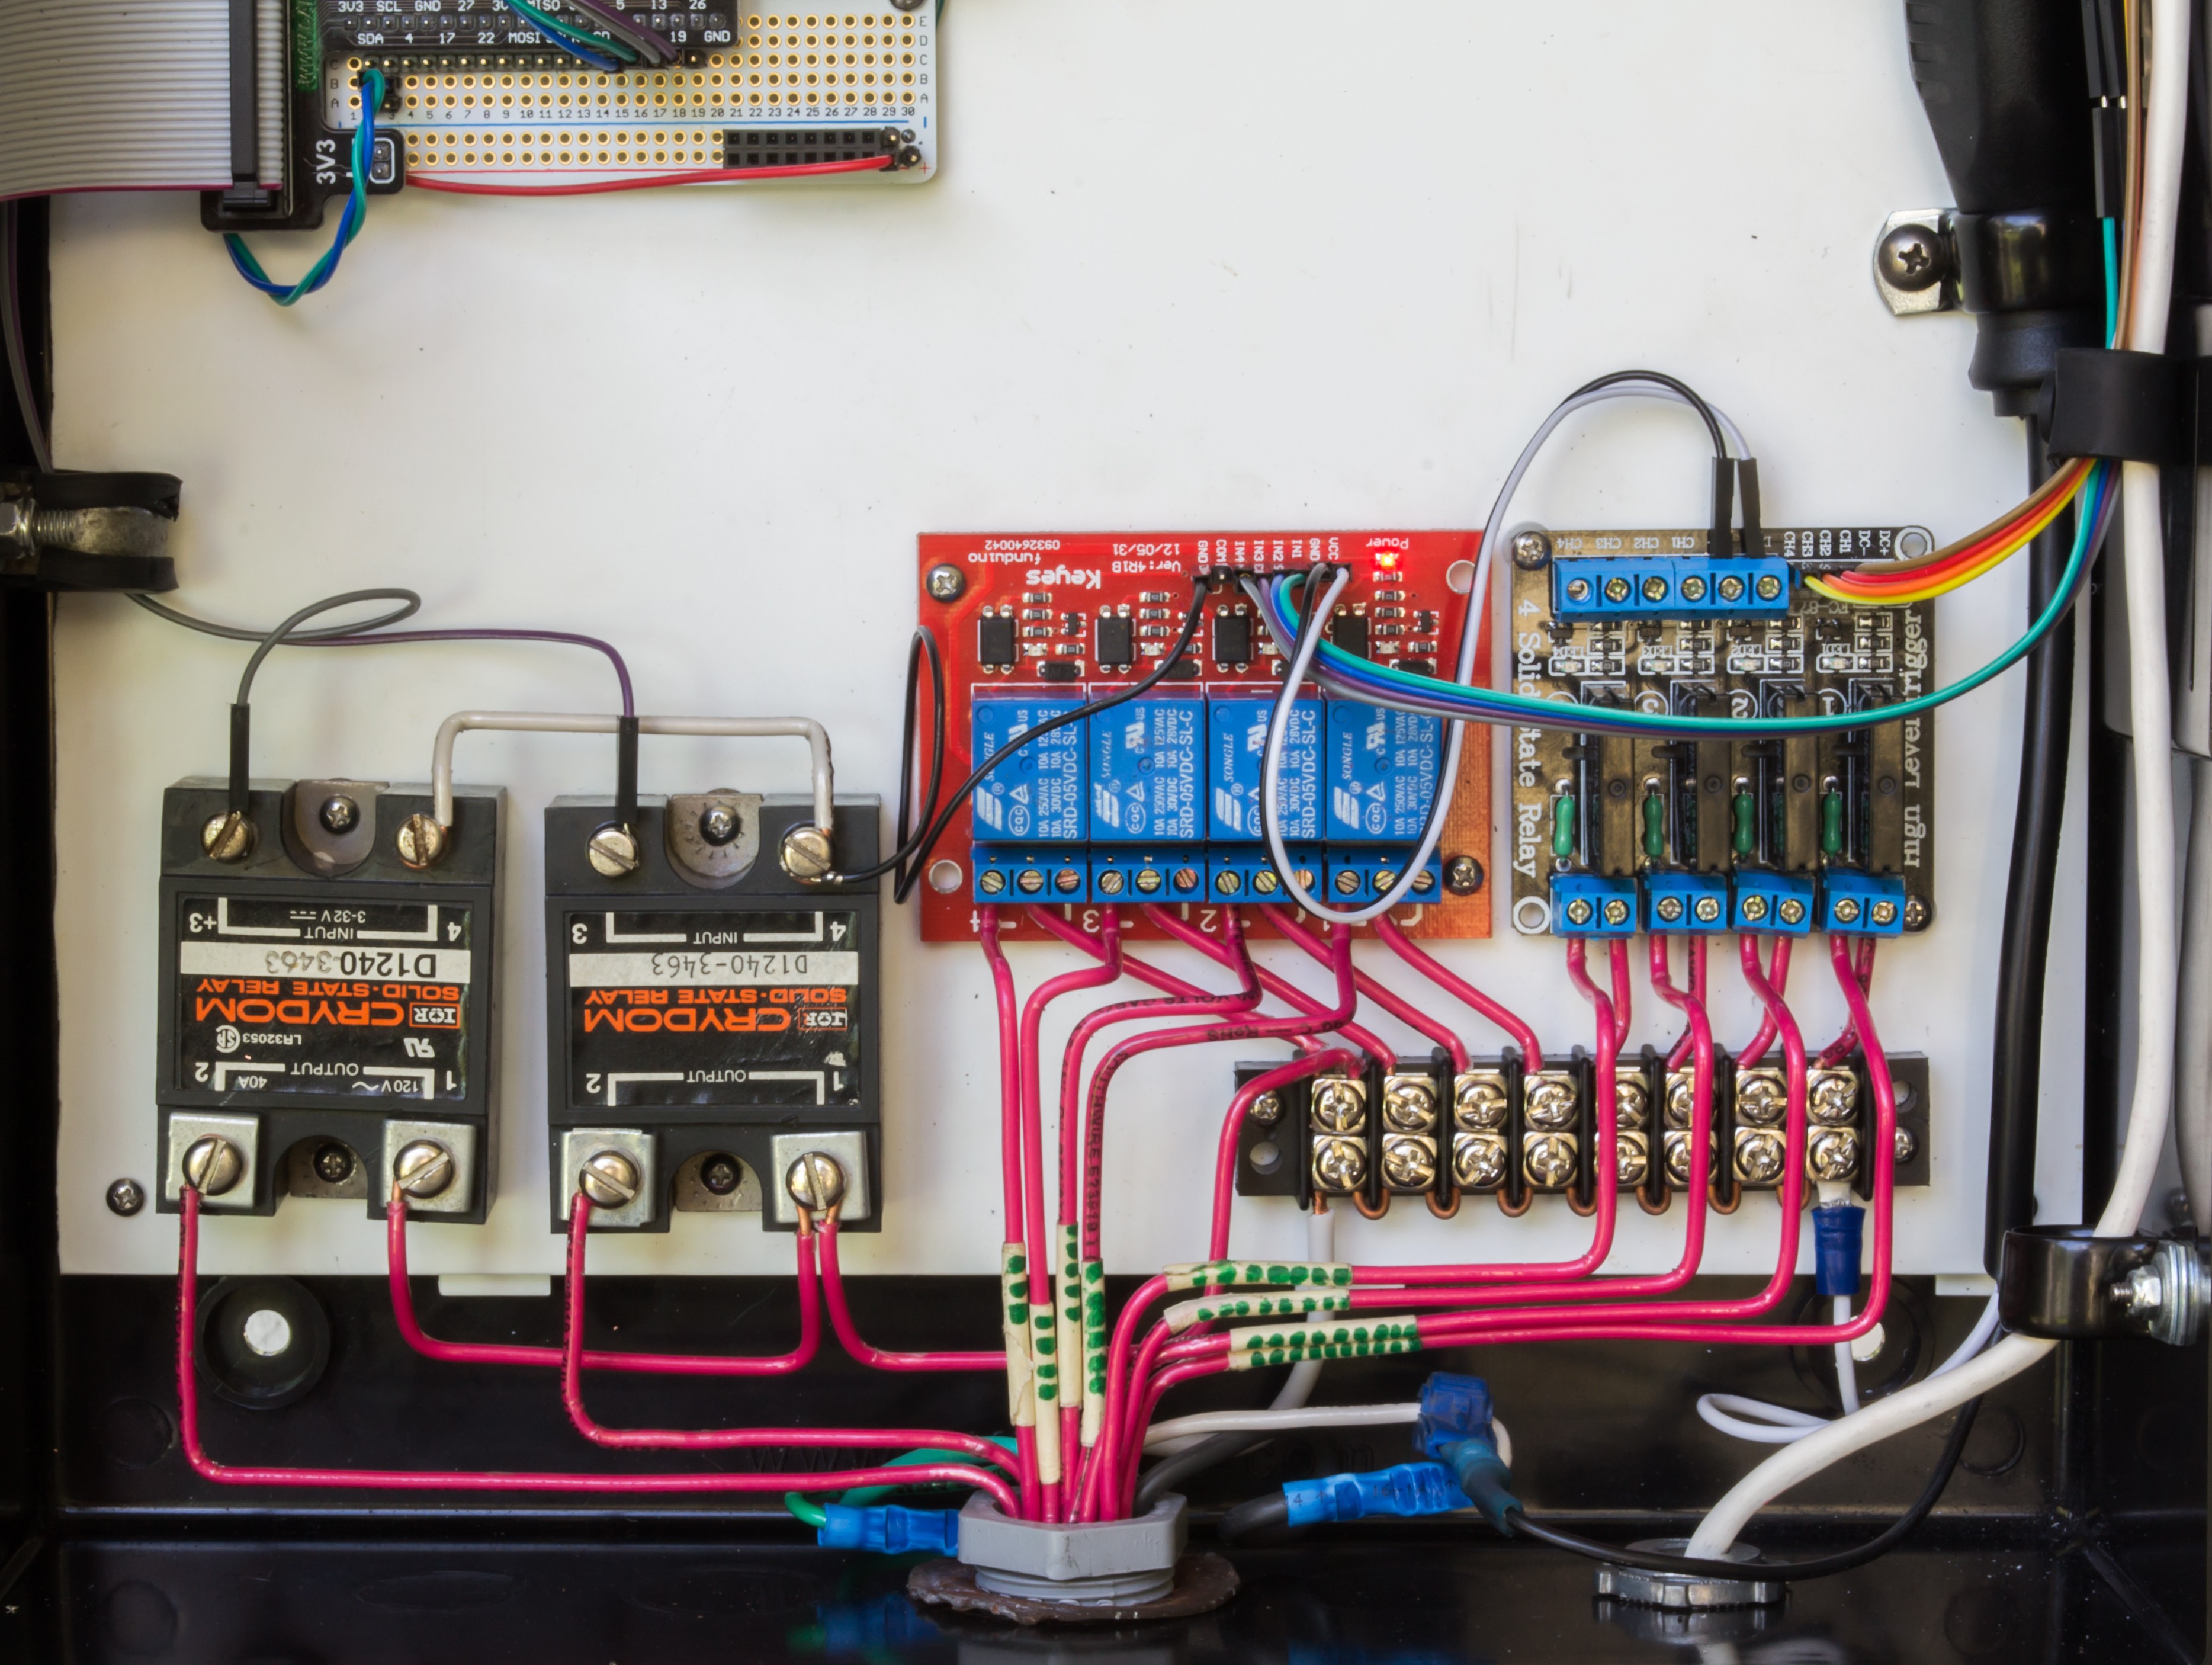
In the electrical box, power was distributed through a terminal block with all the terminals linked. Each of the 10 relays were connected to each outlet and are now individually controllable with the Raspberry Pi. All boards and relays in the box were fixed to a white piece of plastic from a broken flatbed scanner and cut down to size. The metal ring securing the electrical outlet array is a sprocket lock washer that outlived its safe use on a motorcycle of mine.
![]()
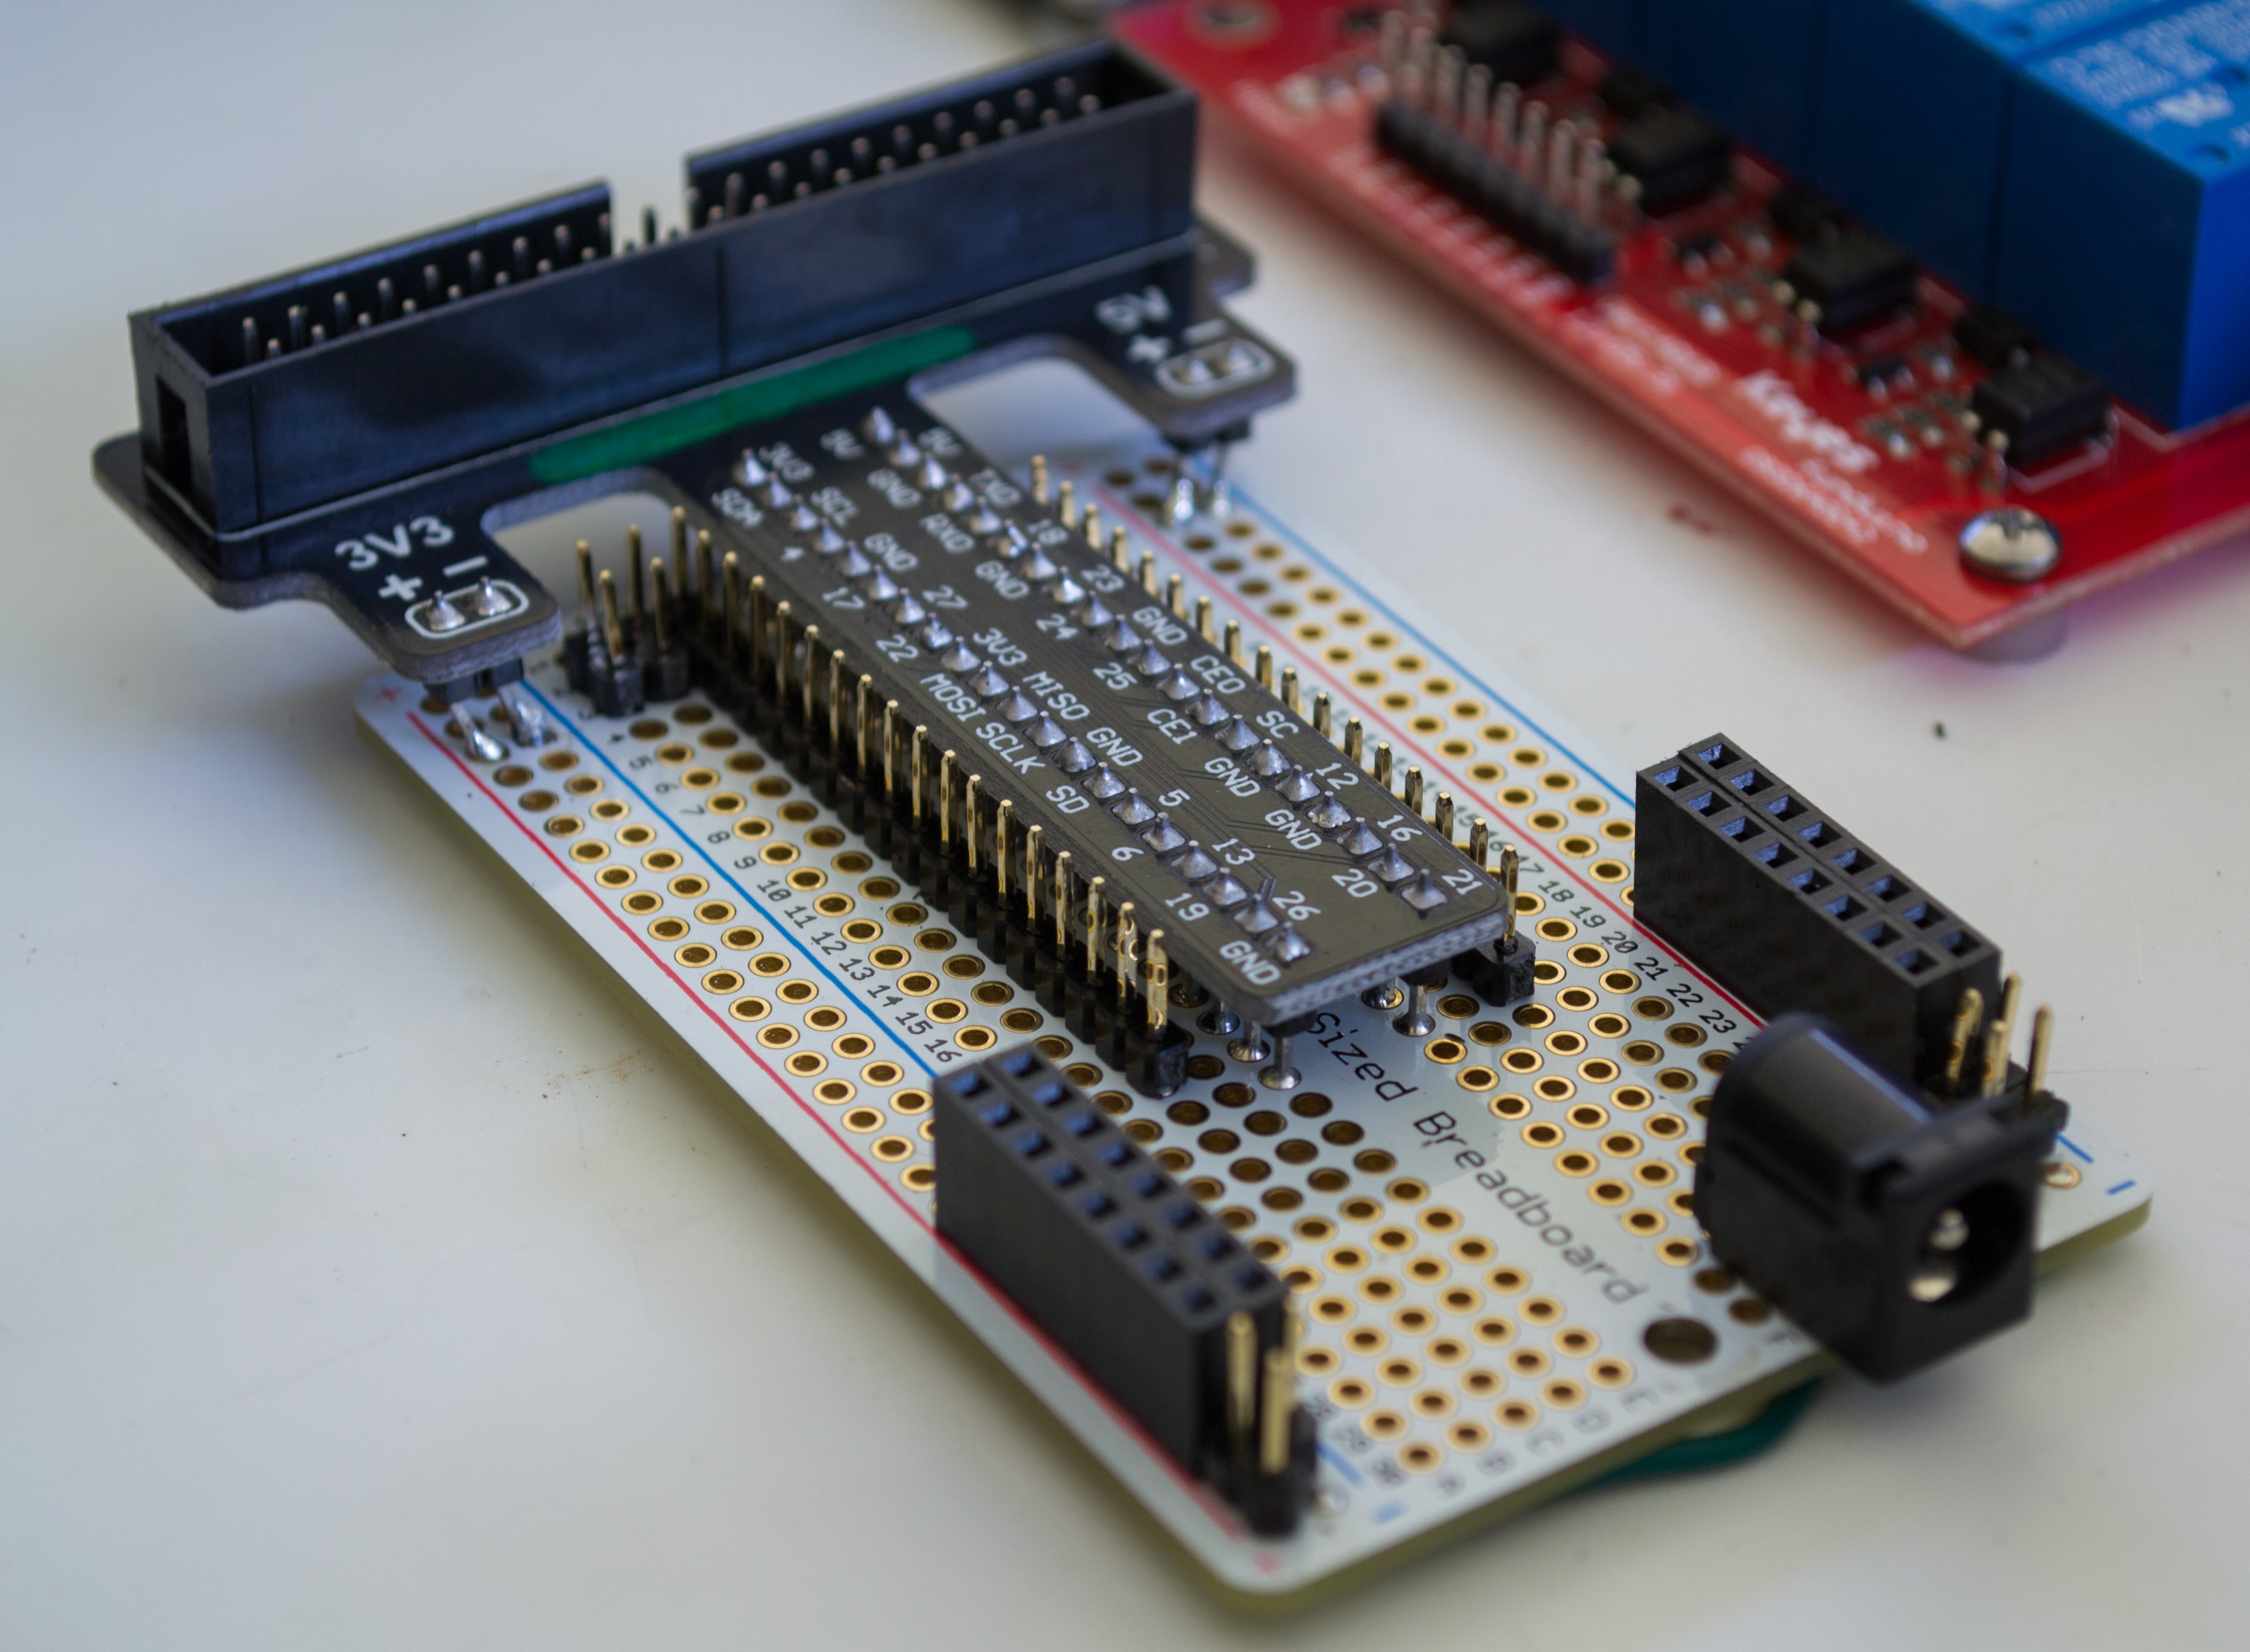
Communication to the Raspberry Pi was accomplished with a breadboard-style perfboard and an IDE cable breakout, soldered together. The power rails were just a bit too wide for the perfboard but after some coaxing, everything aligned nicely. This perfboard has the same latitudinal and longitudinal connections as a breadboard, making expanding connected devices a bit easier.
![]()
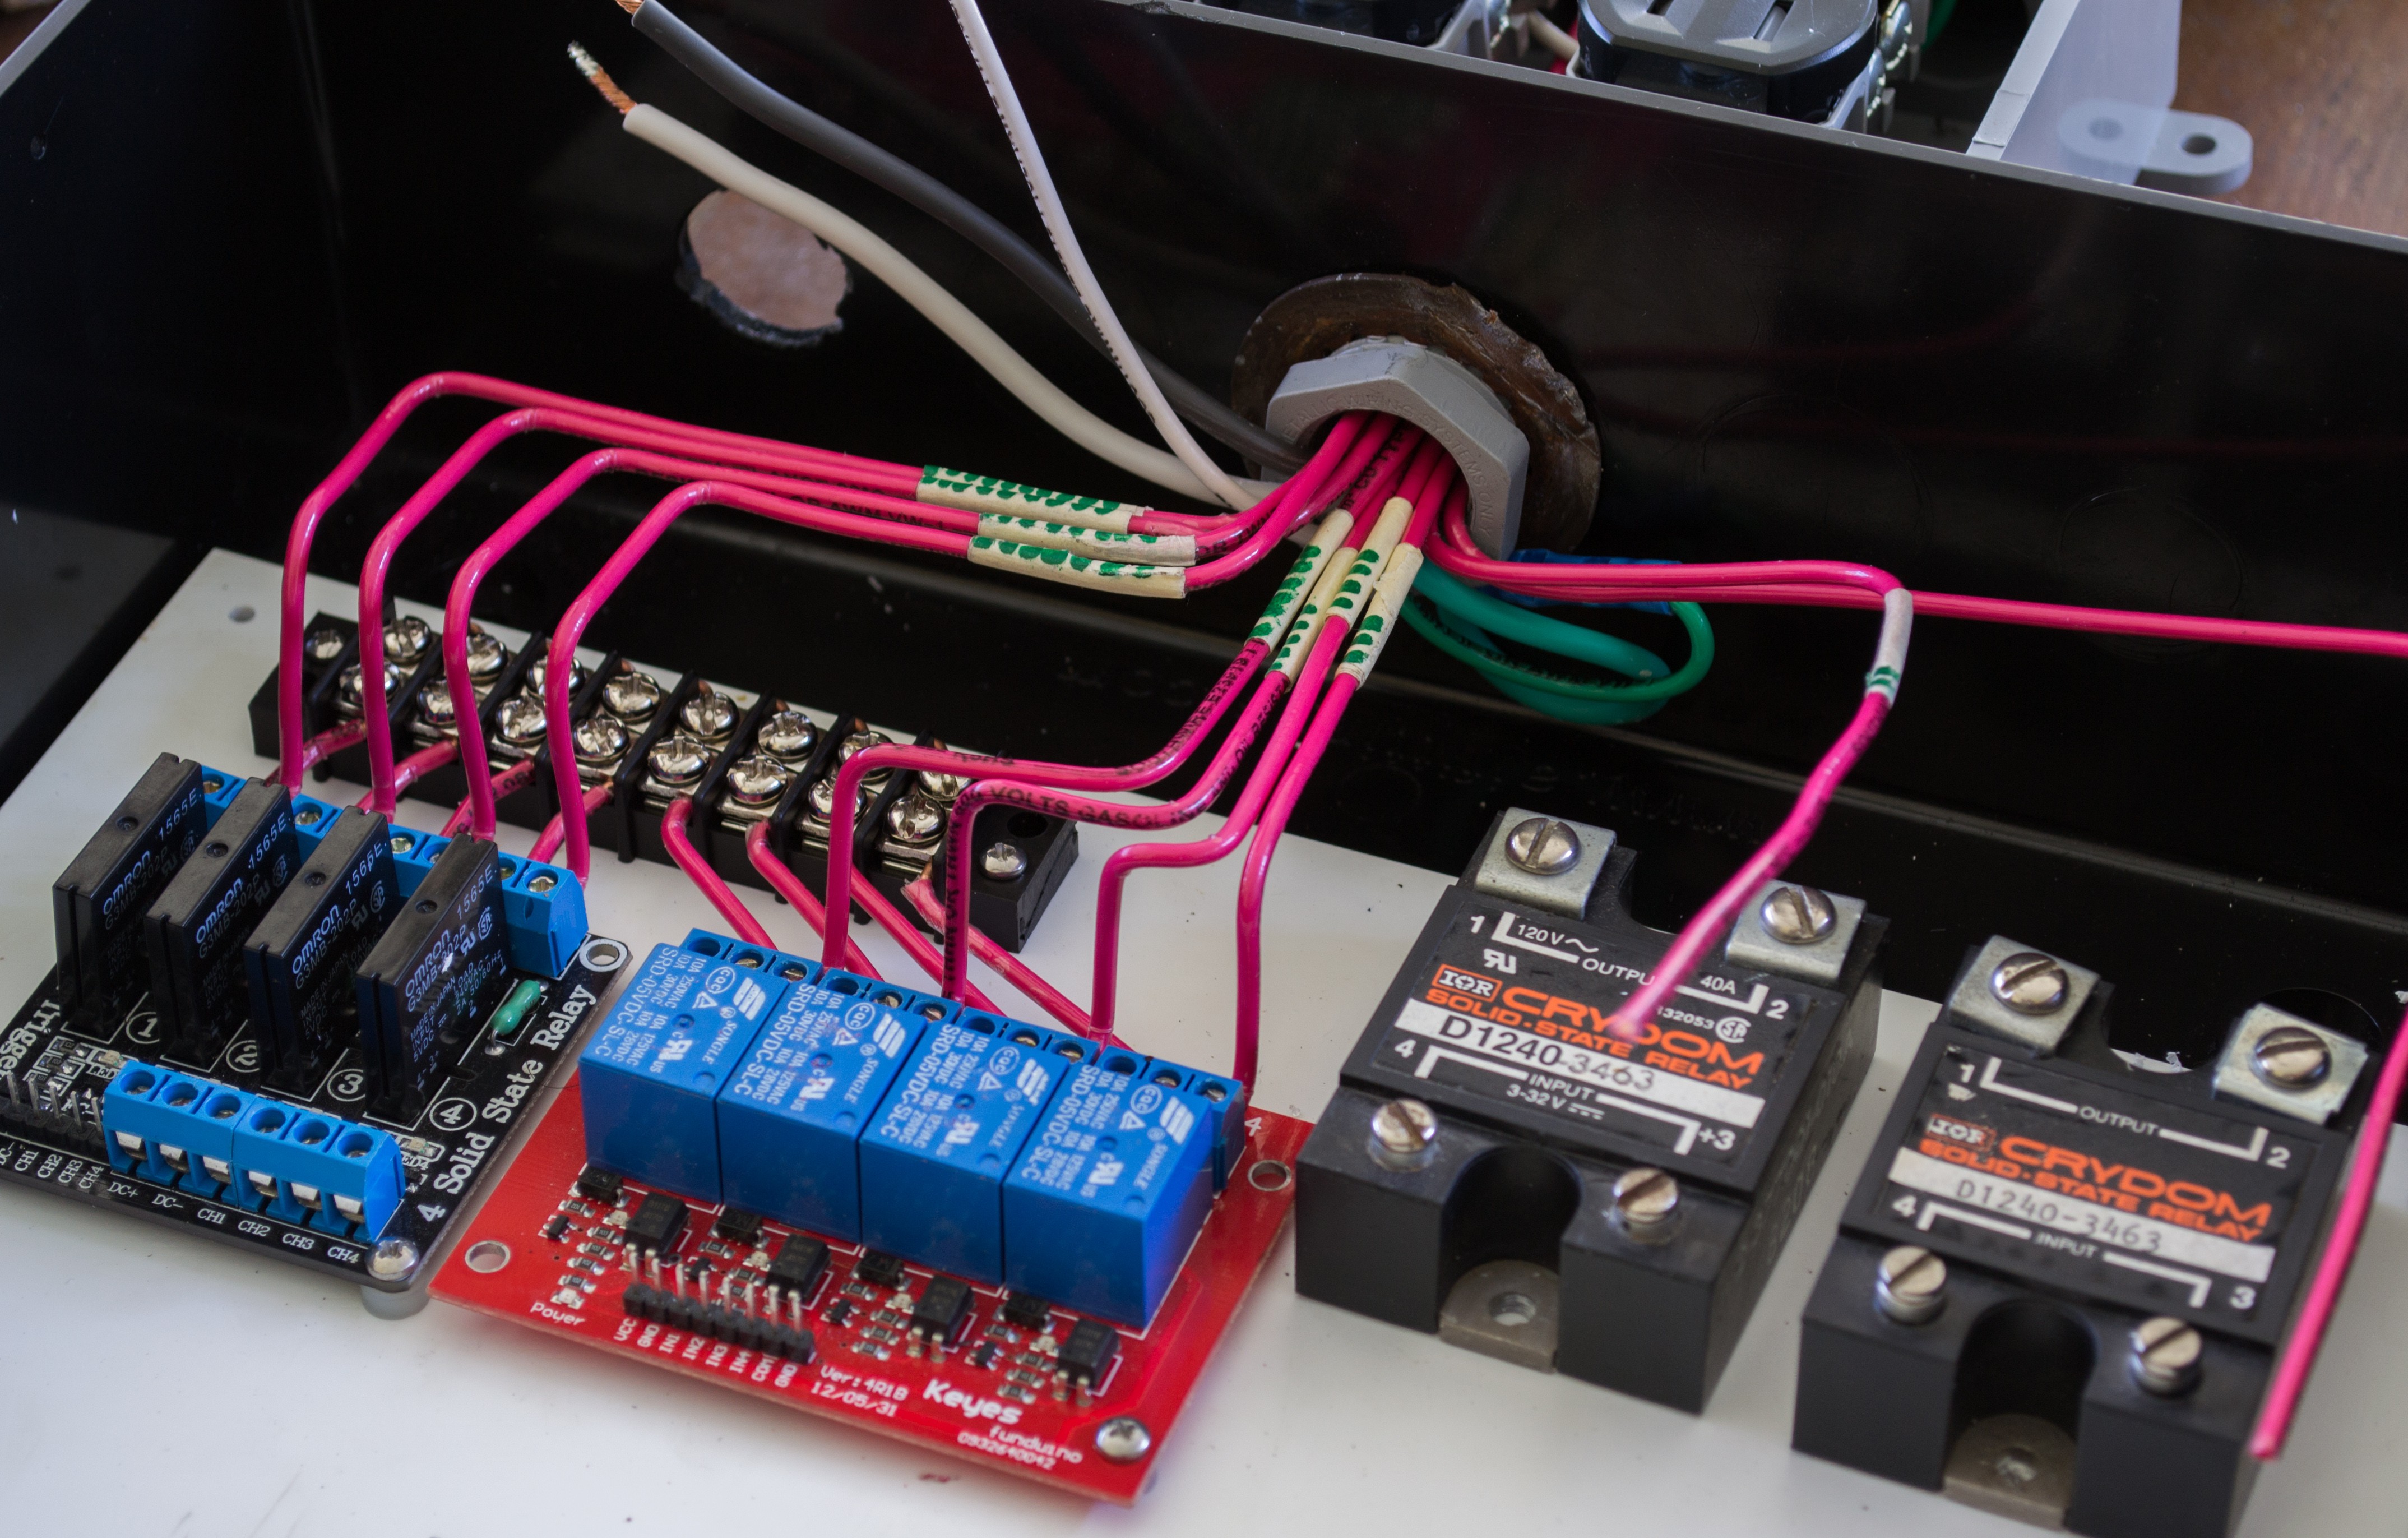
Top left: Raspberry Pi IDE/perfboard
Bottom left to right: 2 Crydom D1240 solid state relays (40 amps each), 4 mechanical relays (10 amps each), and 4 solid state relays (2 amps each).
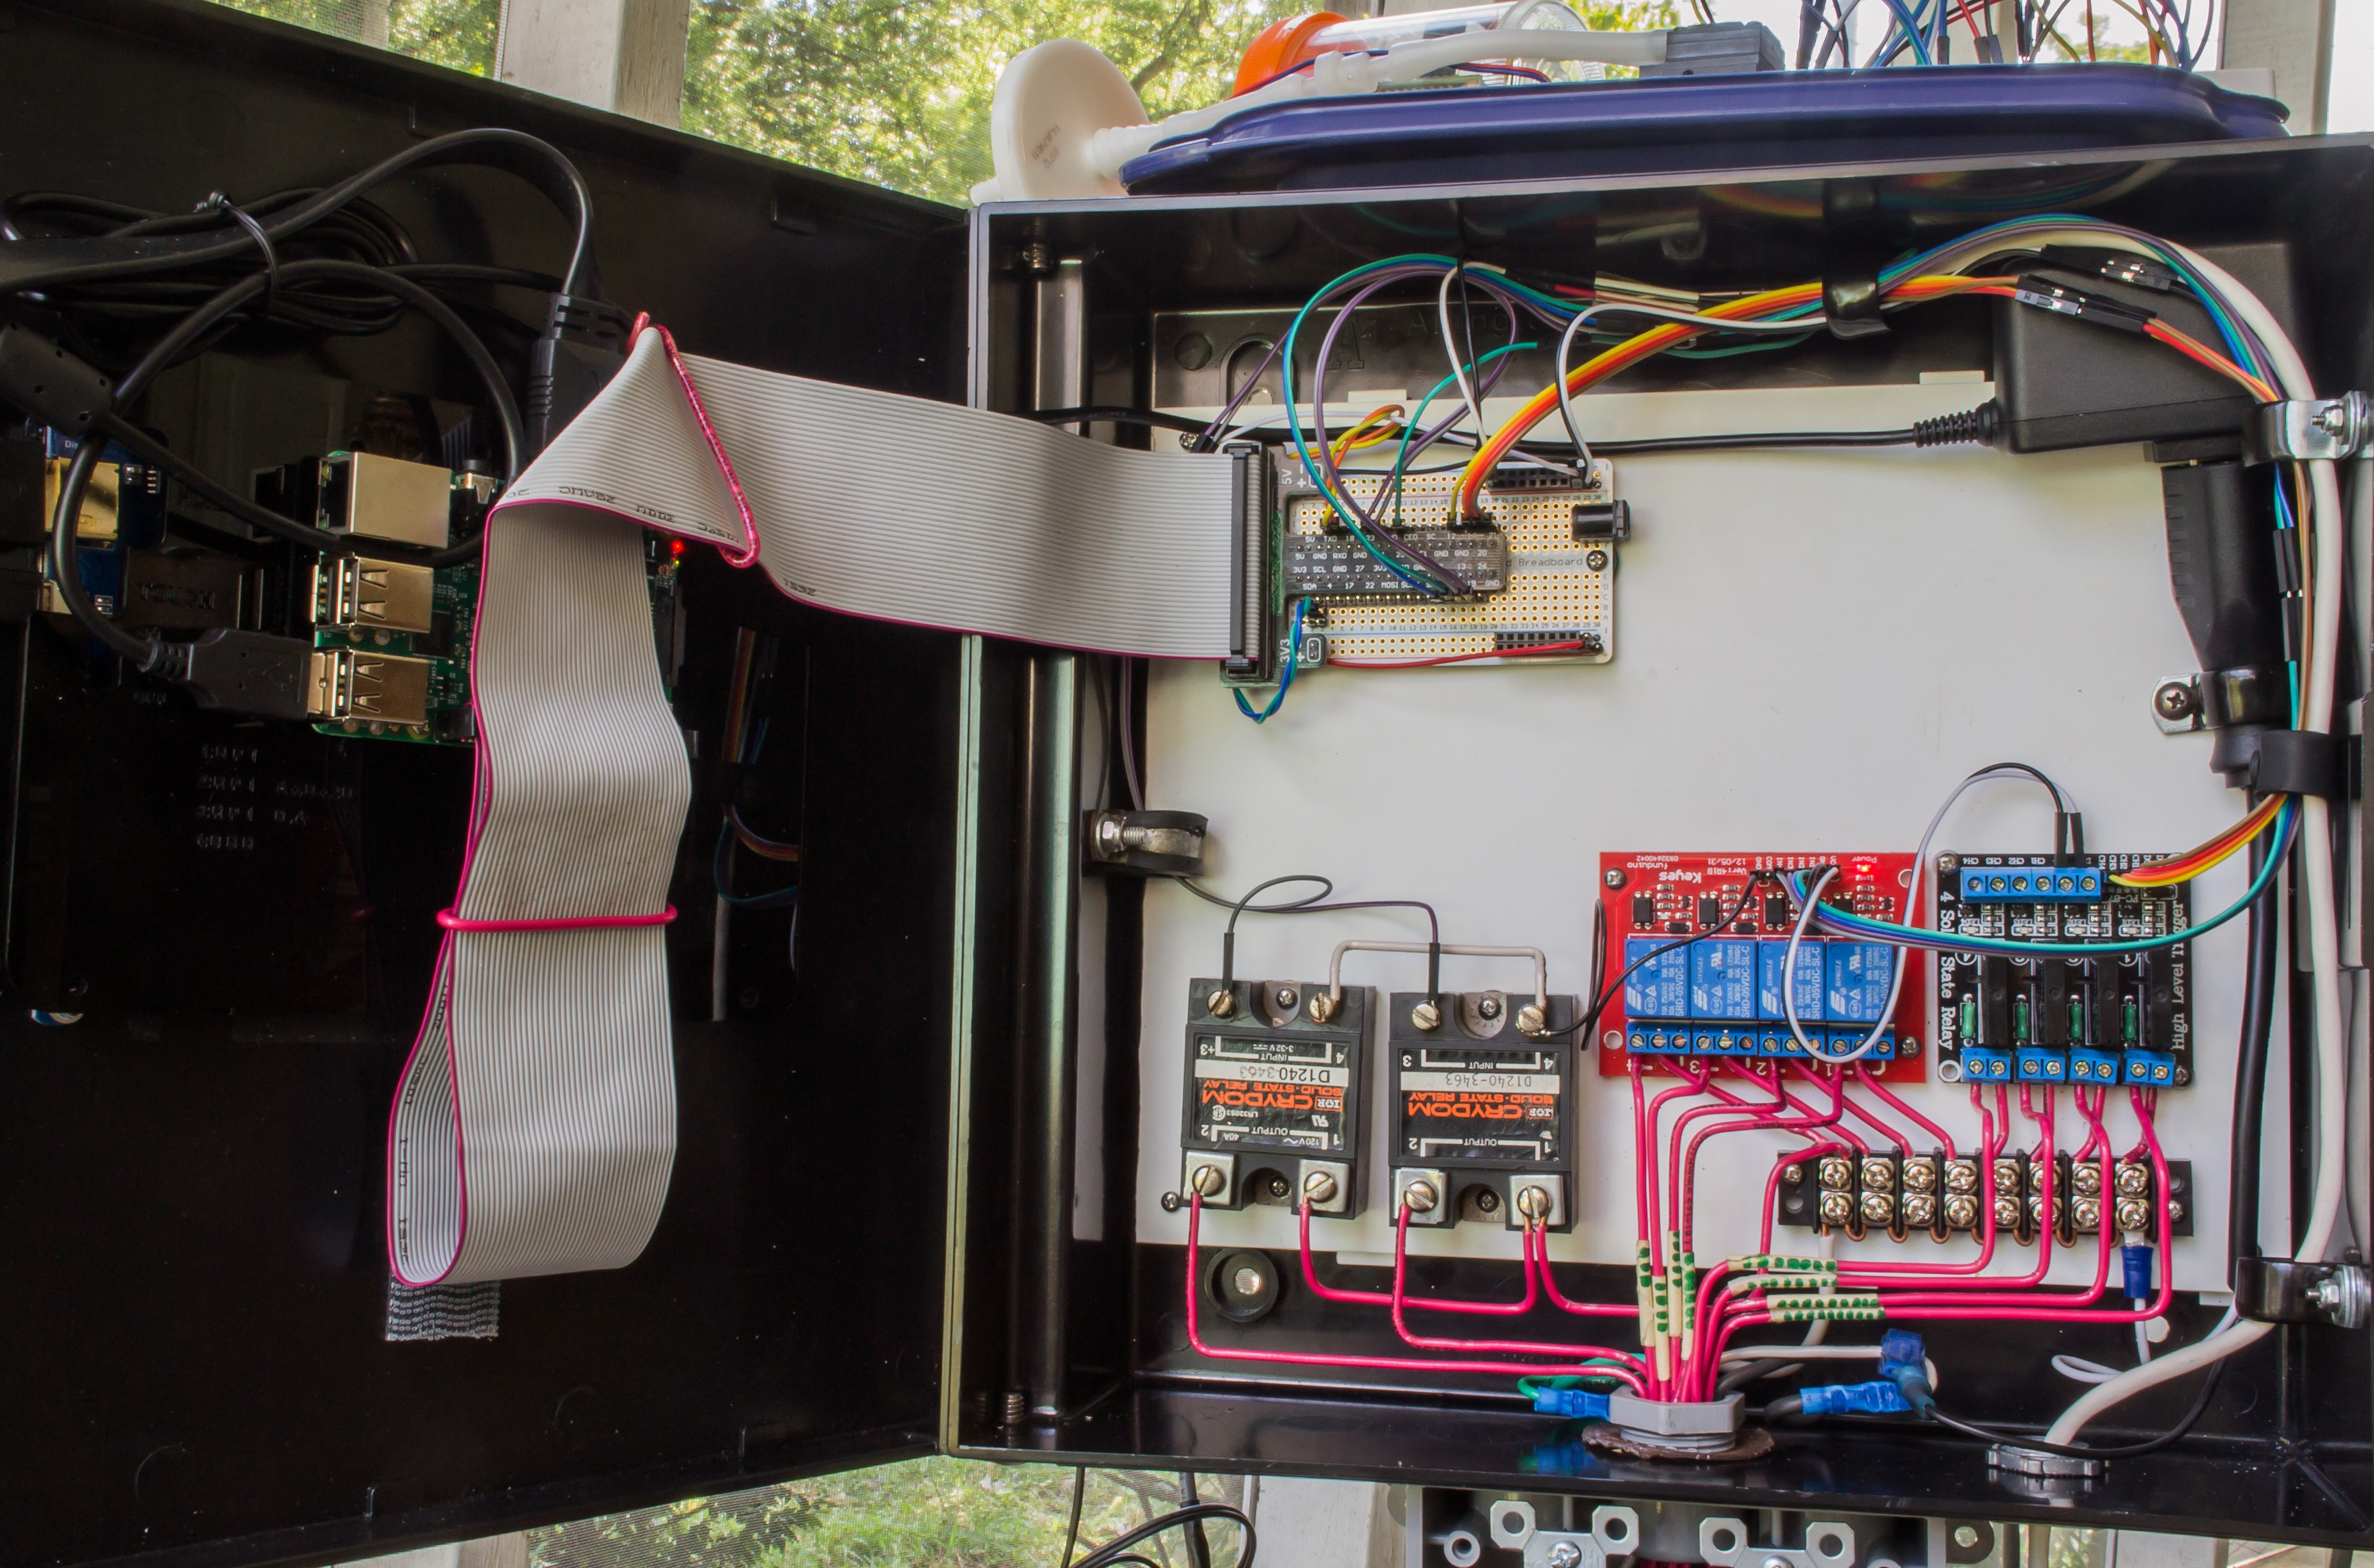
![]()
Everything wired and powered up. The wall wart powers the Raspberry Pi and the LCD touch screen. Sensors either connect through the ethernet port on the left side of the box (behind the IDE cable), or from the opening in the bottom-right, The ethernet connection currently carries ground, 3.3v, 5v, I2C lines (data and clock), and Tx/Rx (for CO2 sensor). The 8th wire is currently unused.
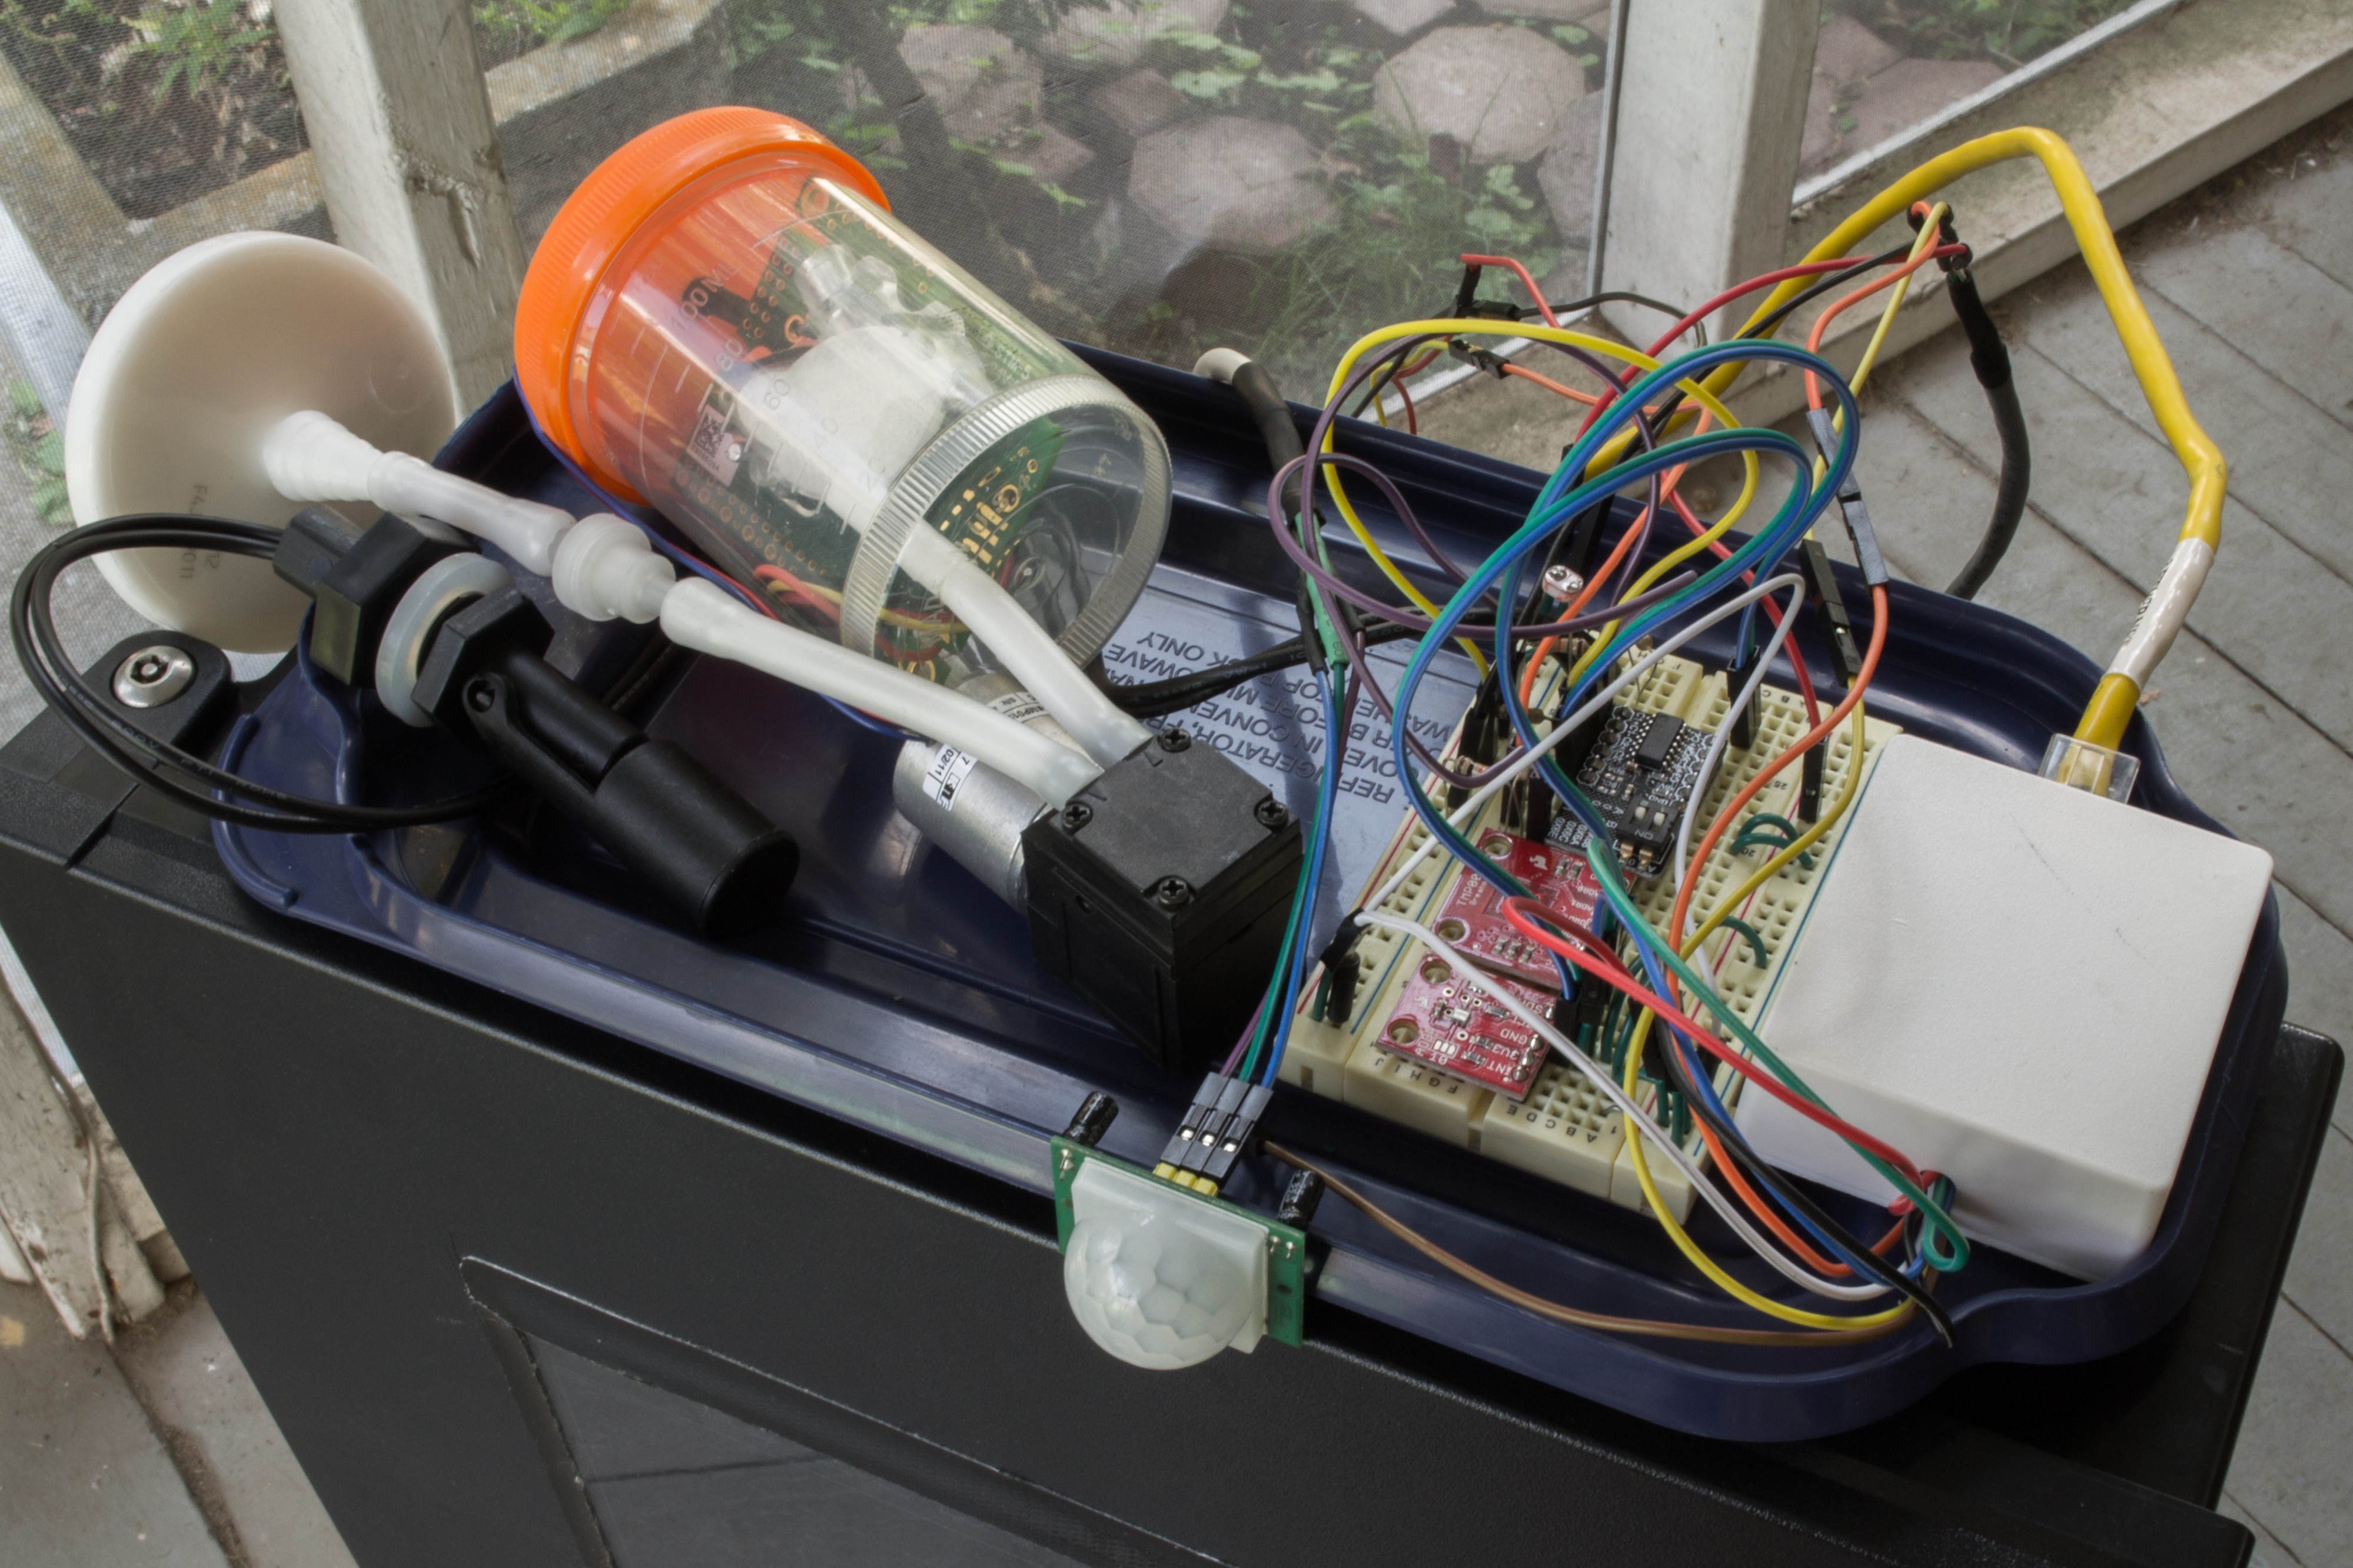
![]()
Even thought the ethernet connection permits a long distance between the head unit and sensor array, I currently have most of the sensors sitting in a tray on the top of the box while I prepare to set the system up for live use.
![]()
The pipe fittings that make up the temporary stand actually provide a nice amount of holds for organizing wires. Black is power, white is the motion sensor, yellow is I2C and Tx/Rx, and grey is the CO2 sensor.
![]()
That's all for this weekend. Perhaps the next update will have Mycodo growing or cooking something.
I'd like to thank everyone who has supported this project. Mycodo was recently selected from the Automation round of the Hackaday Prize to be 1 of 100 great projects judged in the final round.
-
Moisture Sensor Calibration and Tuning #2
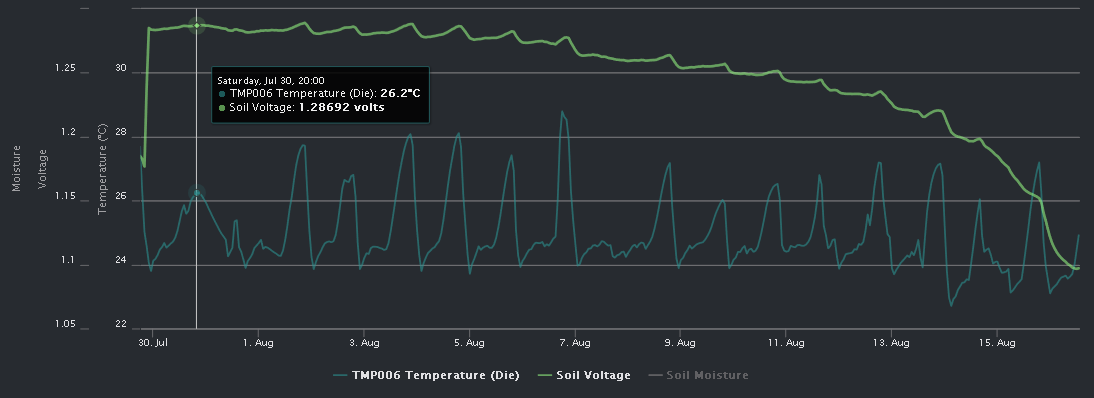
08/16/2016 at 18:05 • 0 commentsIt's now been 18 days since I started the soil moisture measurement experiment. This was a test I began 18 days ago, when I saturated the soil that had a soil moisture probe submerged into it, for measuring conductivity. To be able to accurately determine how moist the soil is, measurements at both total saturation and total dryness must be known. In this case, voltage is the measured value, and this will be converted to a percentage scale. The raw data is below.
![]()
It appears that temperature and soil conductivity are correlated, so I've included the temperature data to explain the bumps in the soil probe voltage.
The volume of this pot is roughly 1 liter. The soil is very degraded (dense) with a lot of clay (fine particles), which could explain the high conductivity for the majority of the test. The plant that's in the pot is also a slow-growing succulent (cactus), and does not require a great amount of water. These things combined make it difficult to determine the voltage at which it would be most appropriate to water. Other plants and soil makeups will invariably need the system to be calibrated again.
I have been meaning to purchase a grow light and tent to conduct actual grow studies, but due to my motorcycle being stolen recently, and having to deal with insurance and transportation issues, I've had to put that off until I am more financially stable.
In the mean time, I can theorize about optimal soil moisture and methods for improving this system. One improvement that may be beneficial would be to remove a small core sample of the dense clay soil and fill that with more loosely-packed soil, which the soil moisture probe could be placed. This allows the plant to retain the soil surrounding its roots, but enable the moisture probe to potentially react more quickly to moisture changes. The loosely-packed soil surrounding the probe would still be affected by the surrounding soil's moisture ,yet because of the lower conductivity, could react quicker and yield a more discernible voltage difference earlier in the test.
Having two soil moisture probes to measure at the same time would be ideal for this type of test, however with the assumption this data curve is reproducible throughout this soil, one probe will suffice.
I hope to bring more tests, Mycodo features, and a working automated plant monitoring and grow setup in the near future.
-
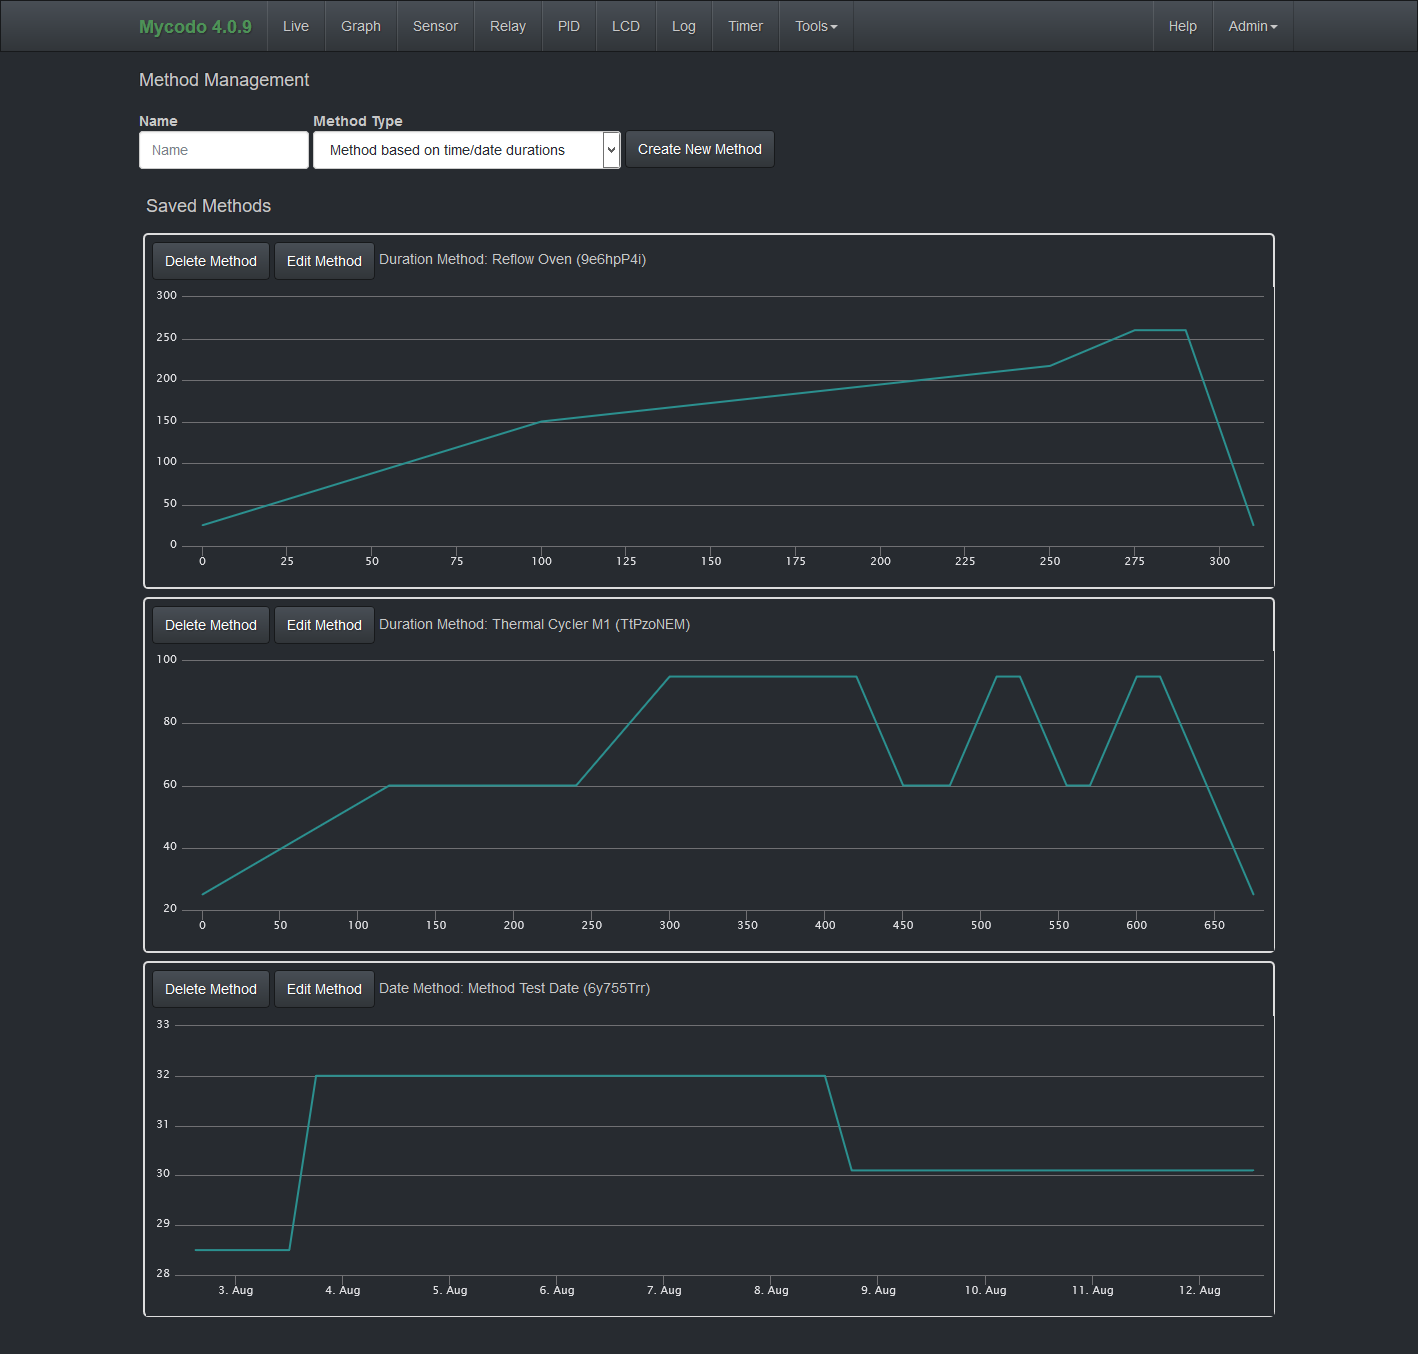
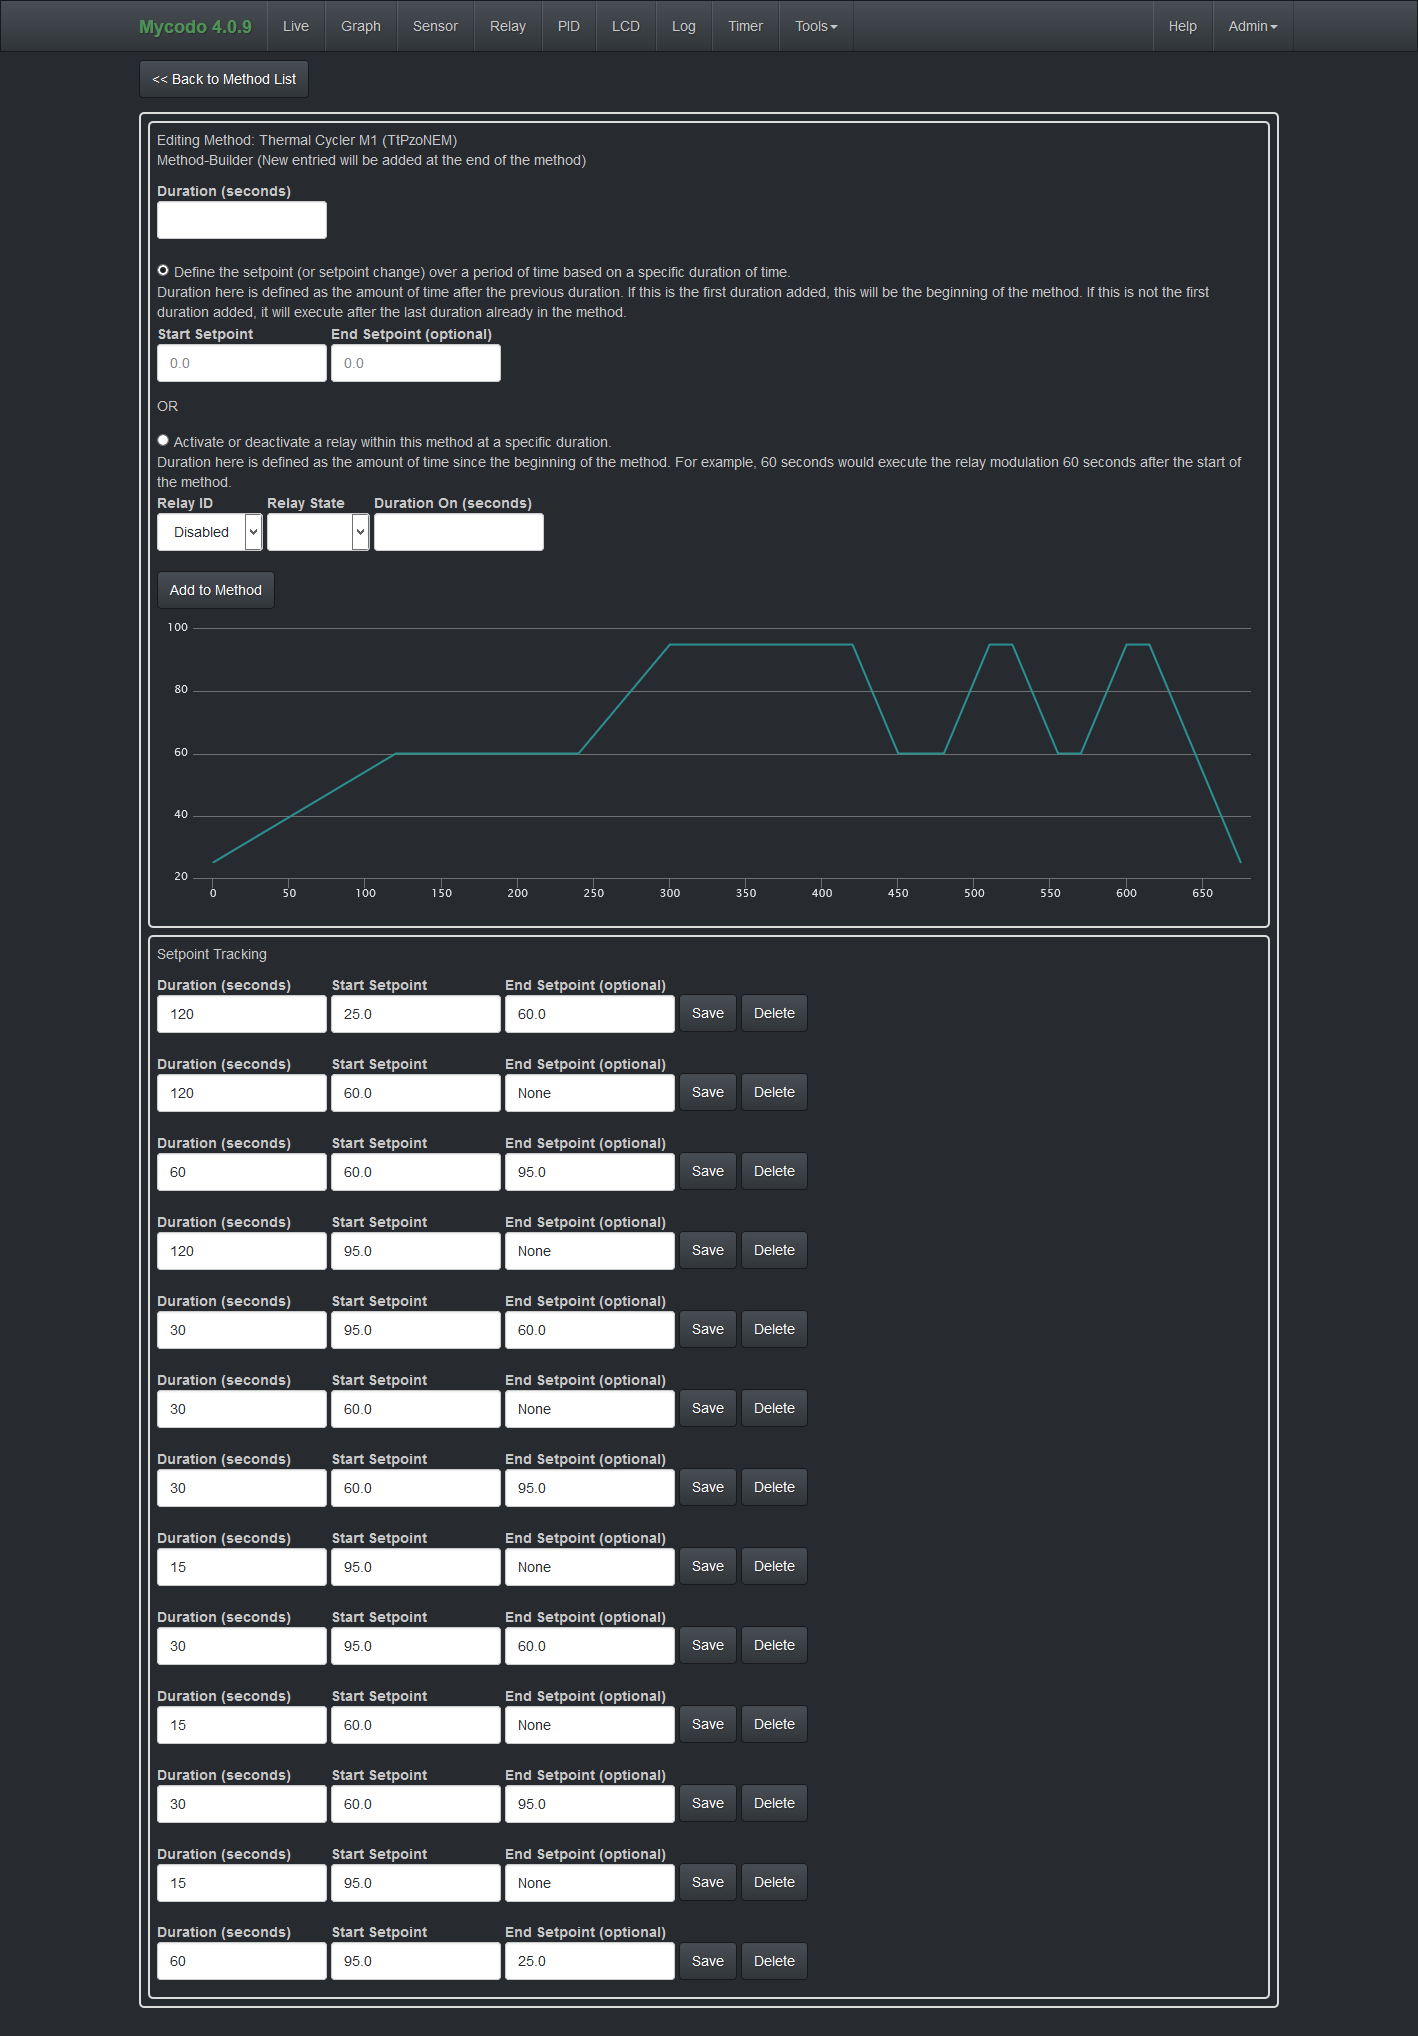
New Feature: Method Development
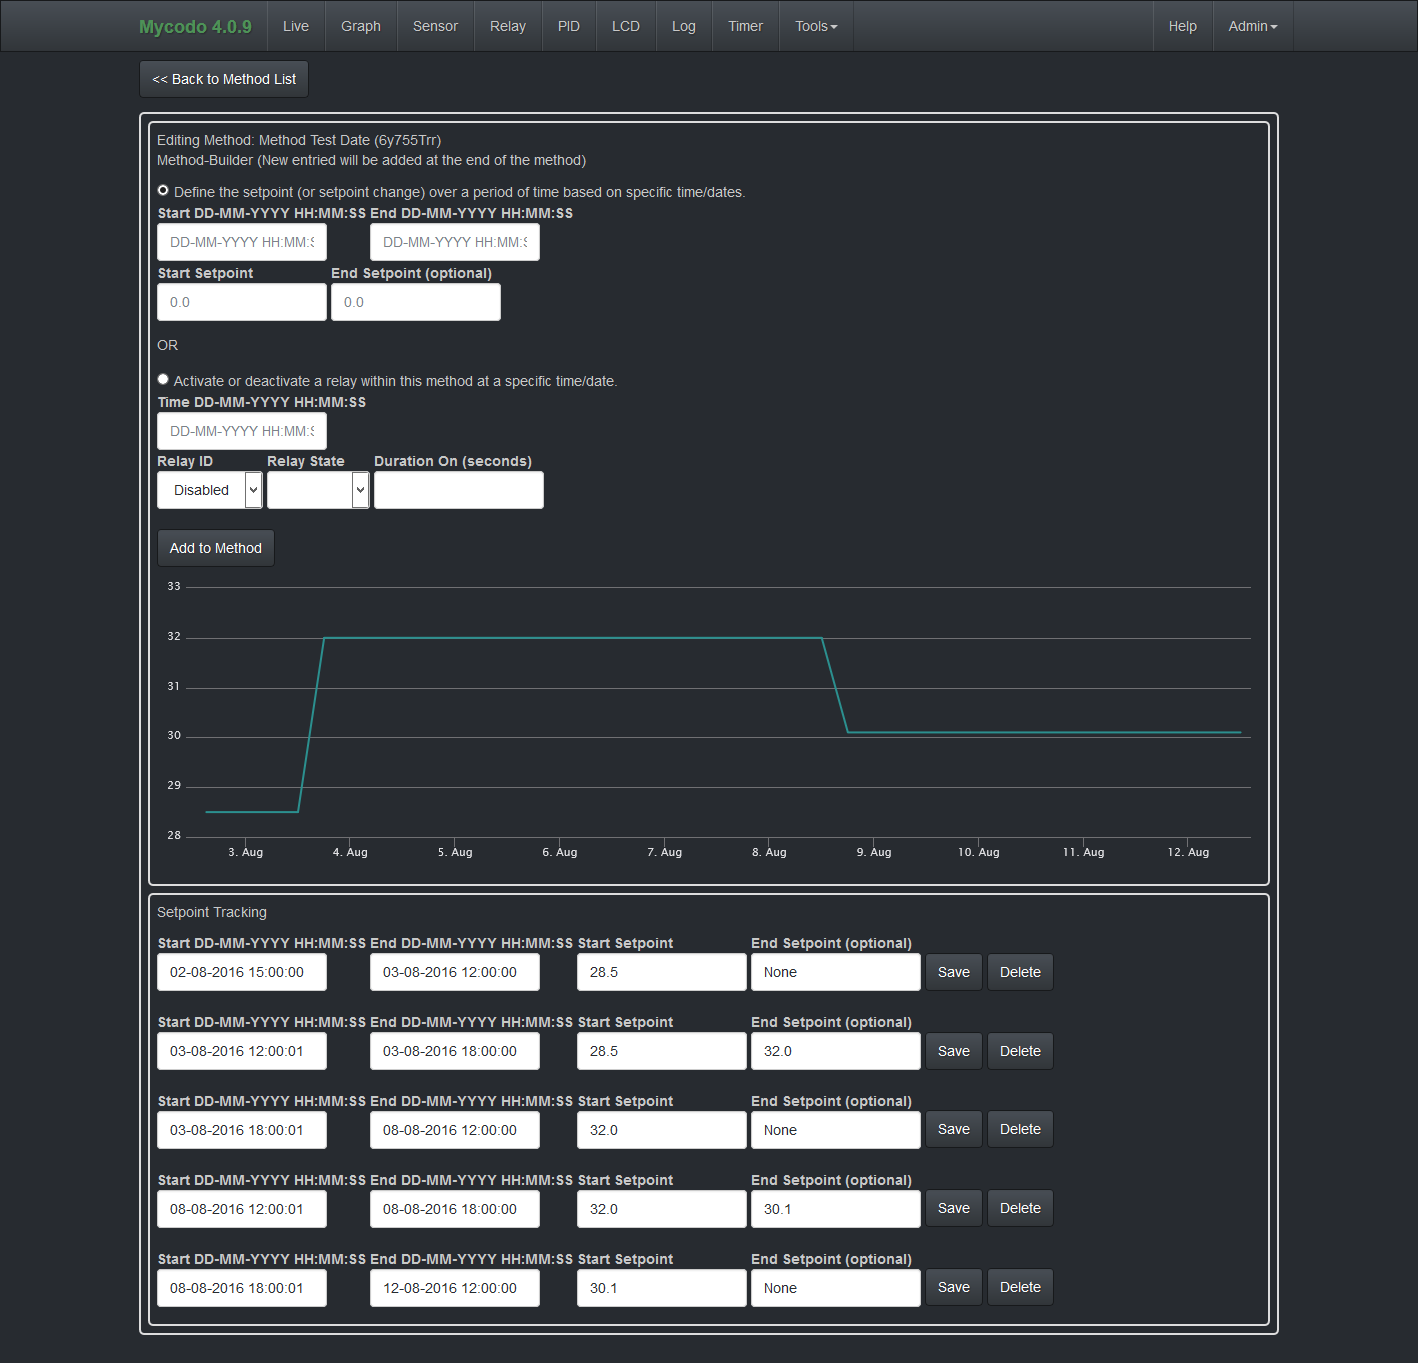
08/02/2016 at 18:22 • 0 commentsToday's log will be short. I just wanted to share a new feature being developed. Using a PID to regulate an environment is nice, but what if you want more than a simple static regulation? What if you want that regulation to change at different time points? This has major utility if you want to build things like reflow ovens (soldering SMD parts), thermal cyclers (replicate DNA), and systems for food production (cultivating, fermenting, aging, etc.), to name a few.
Afew months ago I implemented a feature, known as setpoint tracking, that allowed a daily schedule to be built (to a resolution of 1 minute). This enabled the setpoint (where the environmental condition would be regulated at, for instance temperature) to change throughout the day. However, this was limiting if you wanted to build a method that would change the setpoint farther into the future (such as over a weeks, months, or even years), or if you required a resolution of less than a minute.
This new method builder feature is a major expansion to the initial daily schedule builder, and enables method creation without any duration limitation. The next feature will be the ability to enable repetition, if you want to have a method that repeats at a defined interval.
![]()
![]()
![]()
-
Moisture Sensor Calibration and Tuning #1
07/30/2016 at 01:31 • 0 commentsBefore beginning to talk about today's topic, I wanted to briefly say the SIMB conference I just returned from was a huge success. I was able to listen to a lot of great talks and share ideas with many great scientific minds. I also won the Carol D. Litchfield Poster Presentation Award in the Environmental Microbiology category, and wanted to share that poster, which briefly covers my graduate research.
![]()
Having just returned home, I decided to relax and do some light data analysis of the sensor data I collected while out of town, and discuss the process I went through to calibrate the analog to digital converter (ADC) for the soil moisture sensor placed in a potted plant.
Since different soils will vary in electrical conductivity due to variance in substrate composition, it's necessary to calibrate the ADC and probe to a particular soil in order be able to more accurately measure the moisture. The first step is to ensure the maximum voltage being returned from the moisture probe doesn't exceed the maximum detectable voltage of the ADC. The particular probe I'm using, the SparkFun soil moisture sensor, returns a voltage between 0 and the input voltage, depending on the conductance of the soil. The more wet the soil becomes, the higher the conductivity, and the closer the sensor output voltage will be to the input voltage.
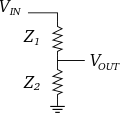
I have two voltages I can easily use from the Raspberry Pi as input to the sensor- 5 or 3.3 volts. The MCP3424 ADC I'm using has a maximum detectable voltage of 2.048 volts, and requires the use of a voltage divider (Figure 1) to reduce the measured voltage below 2.048 volts.
![]()
Figure 1 | Voltage divider with resistors Z1 and Z2 (courtesy of Wikimedia).
The voltage ratio for this voltage divider is:
Rearranging to solve for Vout yields:
Two 10 kOhm resistors were chosen, which reduced Vout to 1/2 of Vin. This voltage divider would reduce 5 volts to 2.5 volts, or 3.3 volts to 1.65 volts. Our only option to yield an output voltage within our target range (with this particular resistor combination) is the 3.3-volt input.
The next step was to submerge the sensor in the soil and measure the voltage when the soil is both dry and wet to determine the significant detection range. The measured voltage will be converted to a configurable condition, which in this case was the "moisture" of the soil (to which the %-sign was the unit). Therefore, 0% soil moisture would be equated to the voltage returned when the soil is dry, and 100% soil moisture to the voltage returned when the soil is saturated with water.
I planned to use the SIMB conference as an opportunity to collect a week's worth of data in order to have enough to effectively calibrate. I set the recordable voltage range to the maximum the ADC could measure, from 0 to 2.048 volts, thus ensuring the measurable voltage would fall within the detection limit of the ADC. Since the soil of plant I was testing had an unknown initial moisture content, I decided to begin my measurements after watering the plant then measure for several days as the soil dried from the water being taken in by the plant and evaporation.
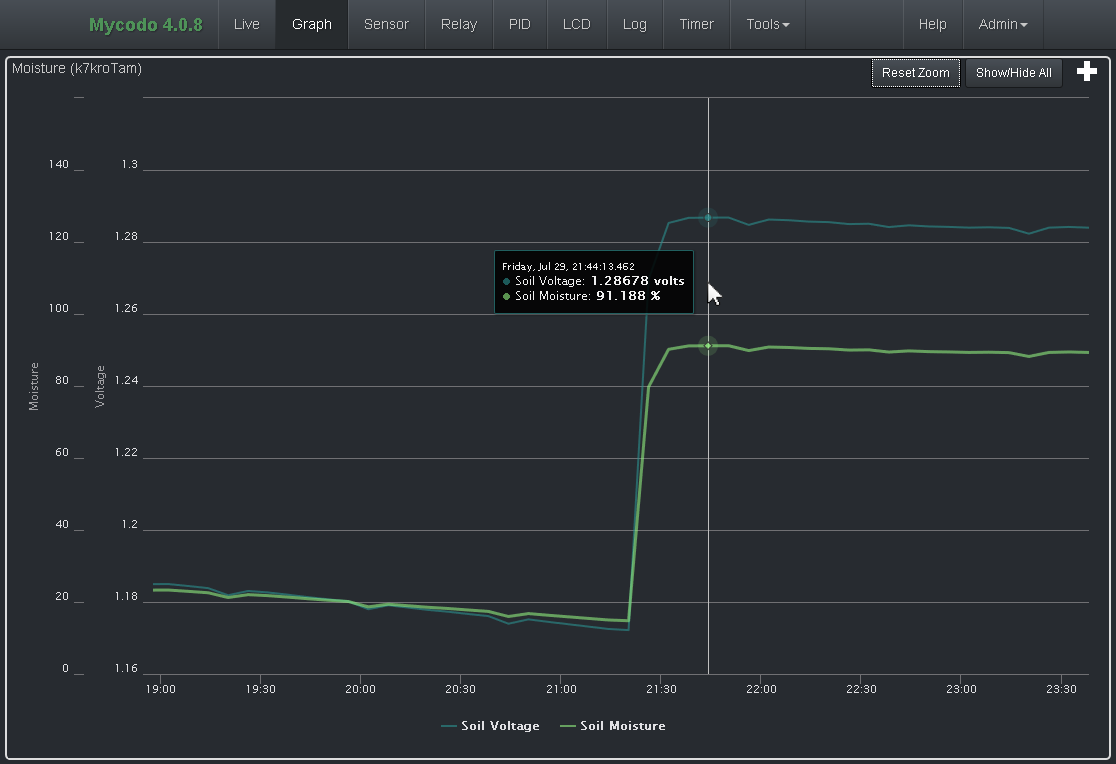
Over the next week, the soil changed from saturated to dry. The recorded voltage started at 1.27 volts and ended at 1.16 volts. It wasn't necessary to allow the soil to become completely dry, as this would be unhealthy for the plant (and most likely impossible due to the high humidity). Rather, it only had to dry to the degree that would be useful for triggering a watering system. Several days without watering was more than enough to accomplish. In fact, it probably became dryer than I would normally have allowed it to become. Using this data, the ADC and soil moisture sensor combination was calibrated to convert 1.15 to 1.3 volts to a scale of 0 - 100% moisture. I collected a few hours of data, completely saturated the soil again, and recorded a few more hours of data (Figure 2).
![]()
Figure 2 | The first few hours of voltage and moisture data recorded after setting the new calibration, then adding water to saturate the soil.
This moisture range is what's used to trigger relays or an input to a PID controller to regulate a certain moisture level. There can be further calibrations, but this initial calibration has already enabled a much higher resolution of moisture detection. The initial voltage range of 0 - 2.048 volts converted to a dry-to-moist range of merely one percent (72% to 73%). The new calibration of 1.15 - 1.3 volts yielded a much greater resolution, with a range of ~10% to ~90% moisture. This increased resolution will enable more accurate moisture measurements and ultimately a finer control of watering.
One of the next logs will include wiring the relays, enabling the modulation of water pumps and testing of the effectiveness of different watering methods.
-
Guest Access to Server
07/23/2016 at 16:32 • 0 commentsNext week I'll be at the annual Society of Microbiology and Biotechnology conference in New Orleans, While learning about science and industry and presenting my graduate research (unrelated to Mycodo), I wanted to give the public guest access to one of my Mycodo development systems. I spent yesterday tightening security for guest users on the system. If you happen to find a bug or security lapse, please contact me at http://kylegabriel.com/contact/ or create an issue at https://github.com/kizniche/Mycodo/issues.
Server: https://fungi.kylegabriel.com
User: mycodo
Pass: guestpassEnjoy!
Mycodo - Environmental Regulation System
Bringing industrial automation and regulation to everyone.

