Mario Frei
-
Outlook
04/20/2020 at 11:12 • 0 commentsAfter the mixed experience with the gateway based on the Adafruit Feather 32u4 FONA, we came up with a new design. It bases on an Arduino Mega 2560, an Adafruit FONA breakout board, an RTC, and an SD-card reader. The larger memory of the Arduino Mega allowed using not only the FONA modem but also SD card logging. So now, even if the gateway is not able to send the data to the web server, the data can still be stored on the SD card. All files are available on our Github repository. The new gateway was deployed in two buildings, and the results look quite promising:
![]()
-
Recap 2 - What to better next time
04/20/2020 at 10:17 • 0 commentsTL;DR: Keep it simple, fail early, fail often, take notes, improve, repeat
If I had to it all over again, I would do some things differently.
- I would define a minimal viable product (MVP). I would keep any non-essential feature on a separate list and only implement it only if it becomes apparent that it is absolutely necessary.
- I would also start and a failure mode and effects analysis (FMEA) early on. I did it after the fact, and it made some weaknesses obvious. Having that insight earlier would have helped to improve the product.
- I would push to have prototypes as early as possible. I would deploy the prototypes in the lab, office space, and at home to get early experience in deploying the sensors. It would be valuable to include these trial deployment in the FMEA.
- Initially, I was quite afraid of failures. Now, I don’t mind failing as long as it is early on in the prototyping phase. Failures and their correction make the whole network more robust and help to build confidence. Also, addressing issues in a controlled environment is much easier than contacting case study participants and schedule a visit. Hence, I would try to fail as early as possible and try to predict failures and their probabilities.
-
Recap 1 - Lessons Learned
04/20/2020 at 10:16 • 0 commentsIt was quite an adventure to design, produce, and deploy approximately 150 sensor nodes. Below are some of the ‘lessons learned’ from this experience.
- Simplicity
- In the beginning, we had many features in mind to be included, e.g., SD card logging on the sensor node, collecting multiple measurements, and sending them bundled together to save energy, etc. A lot of these features were meant as a backup measure in case that something didn’t work out, e.g., underperforming mesh network, or an insufficient battery lifetime. However, these features added quite a bit of complexity in the PCB design and code and weren’t or couldn’t be used later on. Furthermore, these features also added quite a bit of cost.
- Cost
- Even though the cost of the sensor network was within budget, it could be 50% lower. The most expensive components on the main module are the battery (35%), the XBee module (25%), RTC (8.7%), and the SD-card socket (5.5%). These components make up 71% of the main module cost. XBee modules are simple and robust but also expensive, and there is no bulk pricing. Switching to RFM69 radio modules could reduce the price significantly. The RTC and SD-card socket could be omitted without replacement. Finally, batteries became already much cheaper just over the course of this project. So waiting for the prices to drop even further seems to be a feasible option. Alternatively, one could also use alkaline batteries. The sensor network is intended to be deployed for several months. By the end of the deployment will be collected and refurbished. Hence, a battery change wouldn’t be too inconvenient compared to sensors that are intended to stay in place for several years.
- Robustness
- For most applications, it is essential to have somewhat continuous time-series data. Hence, we should have put more effort into ensuring it. It turned out that the gateway was the most vulnerable member of the message chain from the sensor to the webserver. However, I am still not aware of methods to test varying levels of reception in the cellular network in a repeatable and non-cumbersome way, e.g., walking around with the whole test equipment is not much fun (or feasible).
- Automation
- Initially, the goal was to achieve a high degree of automation. However, there were constant issues, with window sensors, energy meters, and the gateways. These issues drained the focus from other tasks and also caused additional issues with automation, e.g., how to deal with the gaps in the data, or how to find a period with minimal gaps, etc. I wasted a lot of time on the automation of processes that shouldn’t be needed in the first place. In hindsight, I would rather focus first on the robustness of the overall data collection processes. Once the systems work somewhat smoothly and reliably, it’s quite easy to focus on automation.
- Message format
- The sensor data is re-formatted several times during the transmission, e.g., sensor module -> main module, main module -> gateway, gateway ->web server. We could have saved some work and reduced the complexity by adhering to a single format through the communication chain. The only drawback would have been the loss of some flexibility, which was never used in the first place.
- Practical things
- The battery connectors seem fine at first glance. However, after countless unplugging and re-plugging these kinds of connectors, I’d like to find another solution. I am wondering whether holders for 18650 cells would be a better solution.
- The wired connectors between the main module and sensor module are somewhat expensive, time-intensive the manufacture, awkward to handle, and somewhat prone to failure. Hence, they should be replaced through a different solution, e.g., right angle, surface-mount pin headers.
- Currently, the power supply cable for the main module is attached to the bottom half of the sensor node housing. If the power supply or the housing is damaged, a soldering iron is needed to remove the power cable from the housing. This should be improved, either by changes to the design of the enclosure and/or through a different power supply plug.
- An RSSI indicator would be a helpful tool during deployment. This could be a handheld device that indicates the RSSI level or it could be implemented in the web-interface. Such a tool could help to place route nodes.
- During data processing, measured data had to be merged frequently with metadata, e.g., room number, floor number, building number, etc. It might be helpful to add this metadata to the web interface, where it could be added during the sensor deployment. Later, the measured data could be retrieved with the associated metadata, without the need to keep track of multiple spreadsheets.
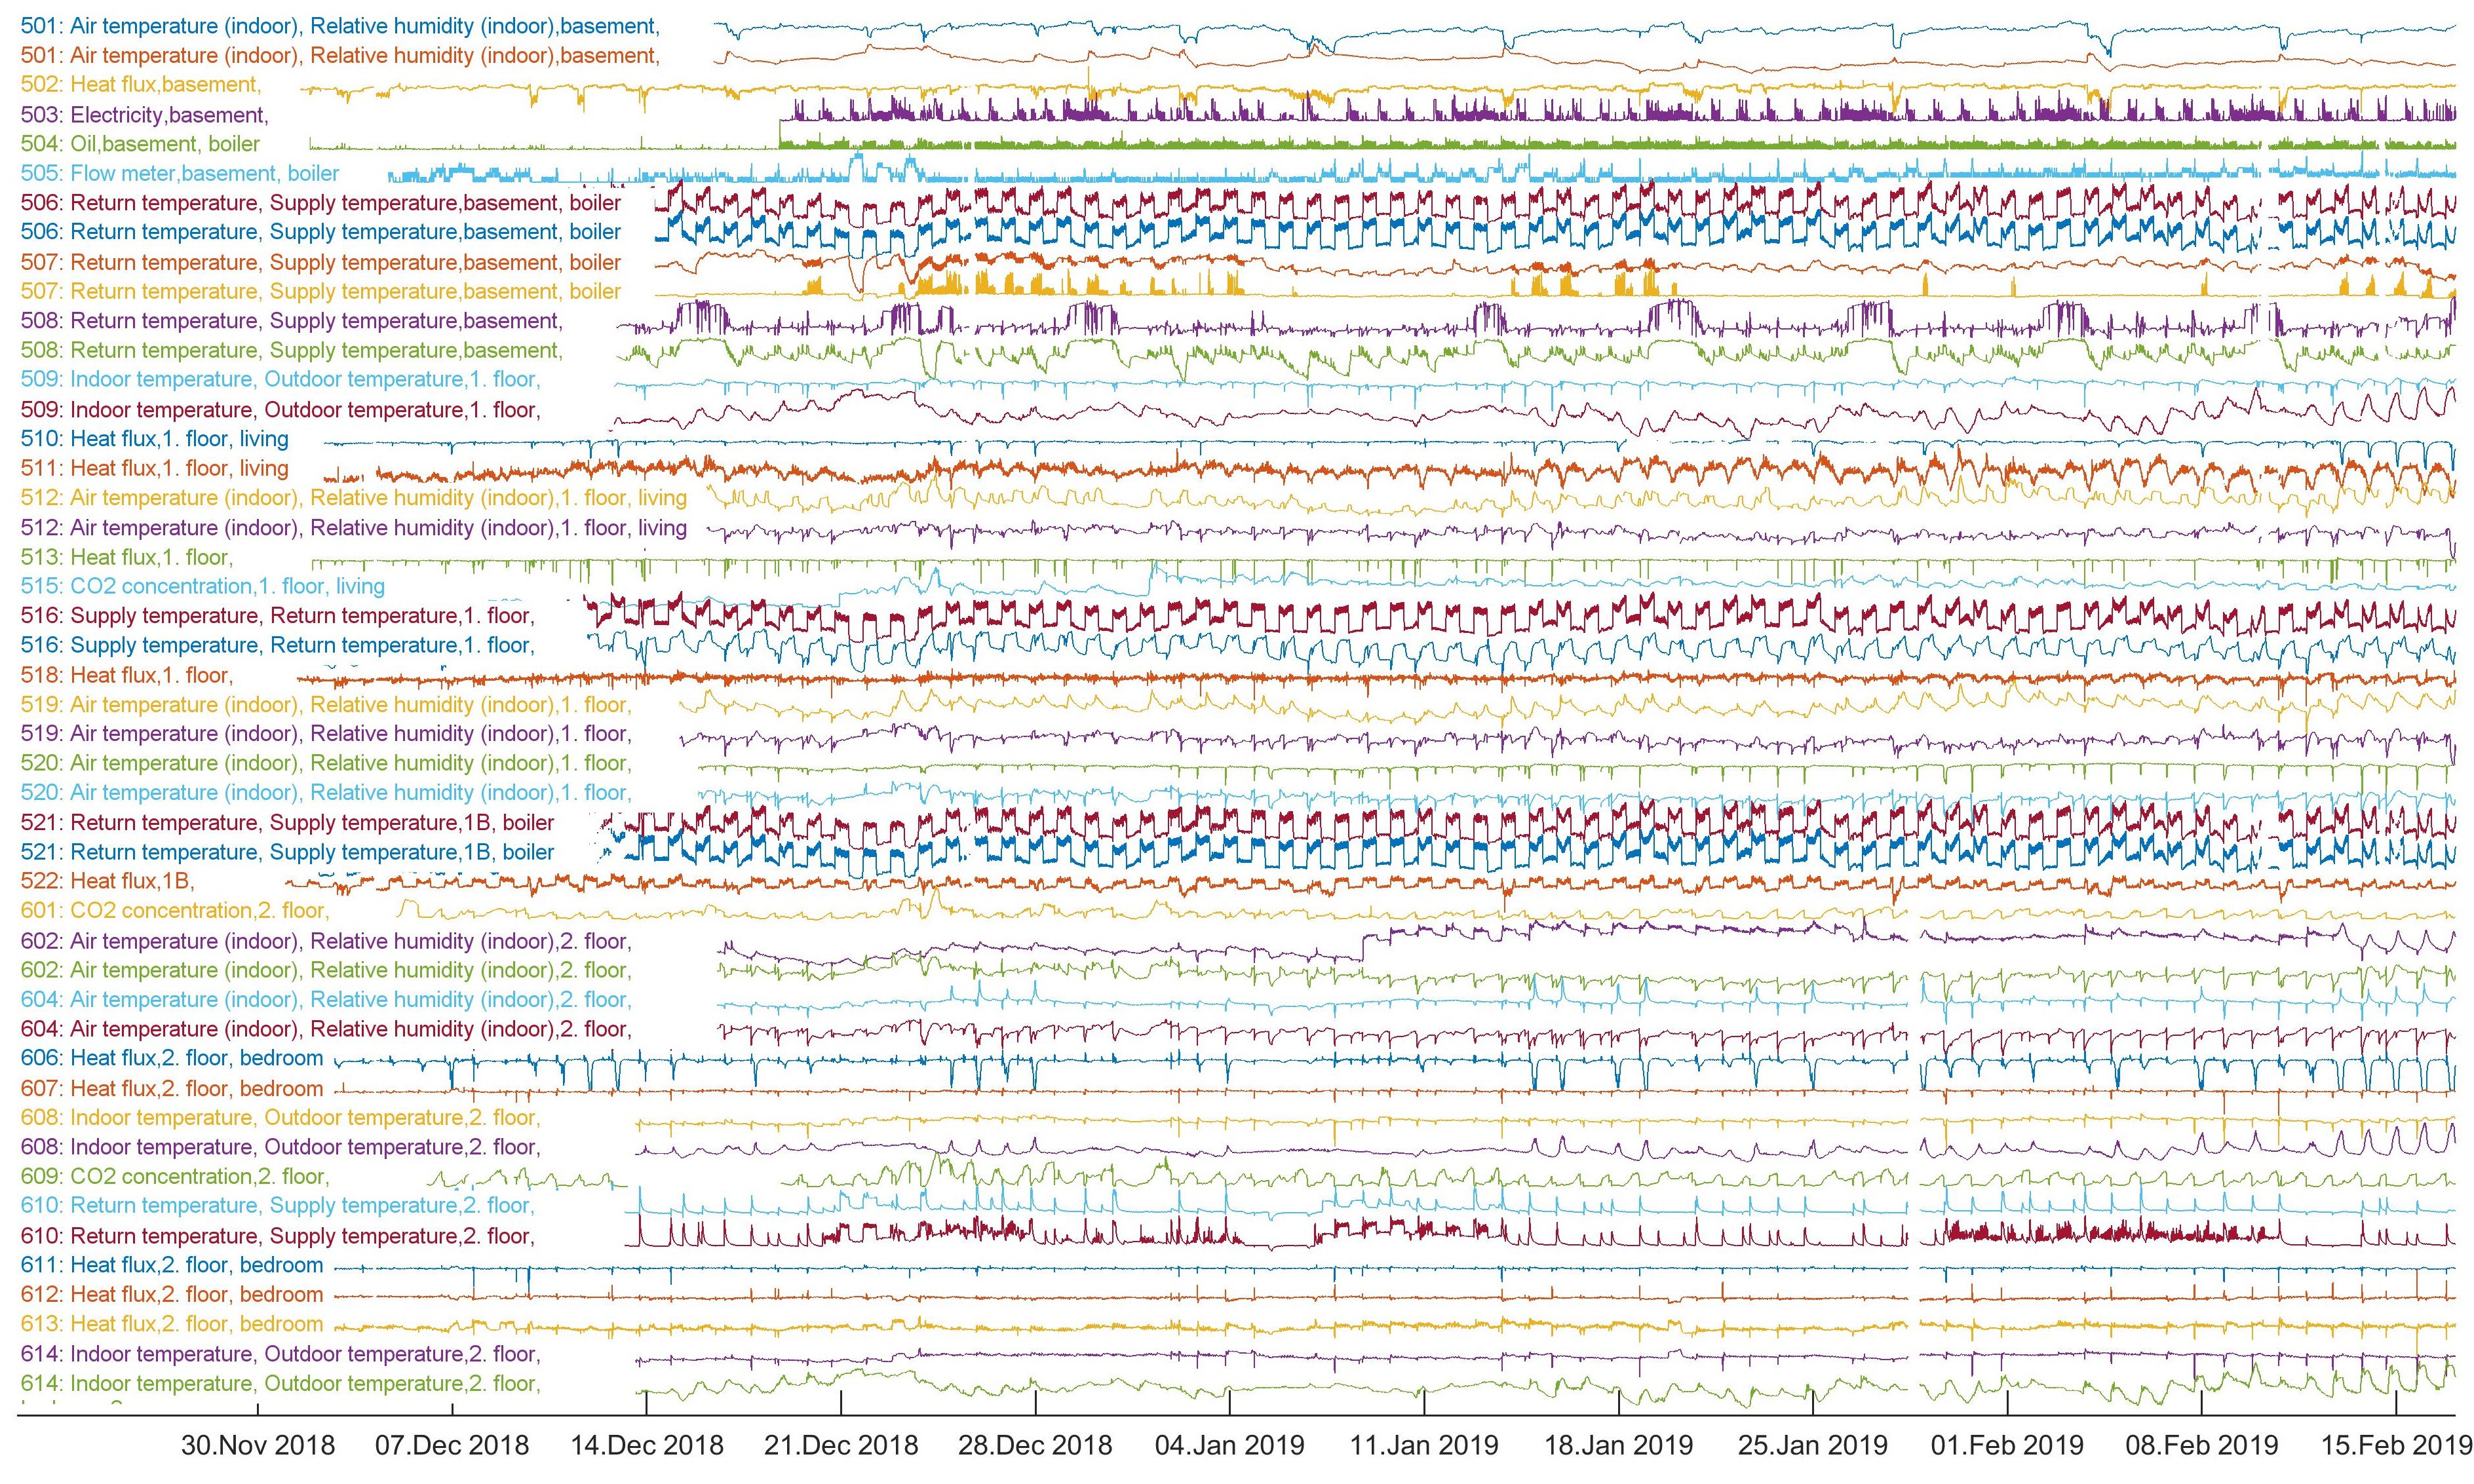
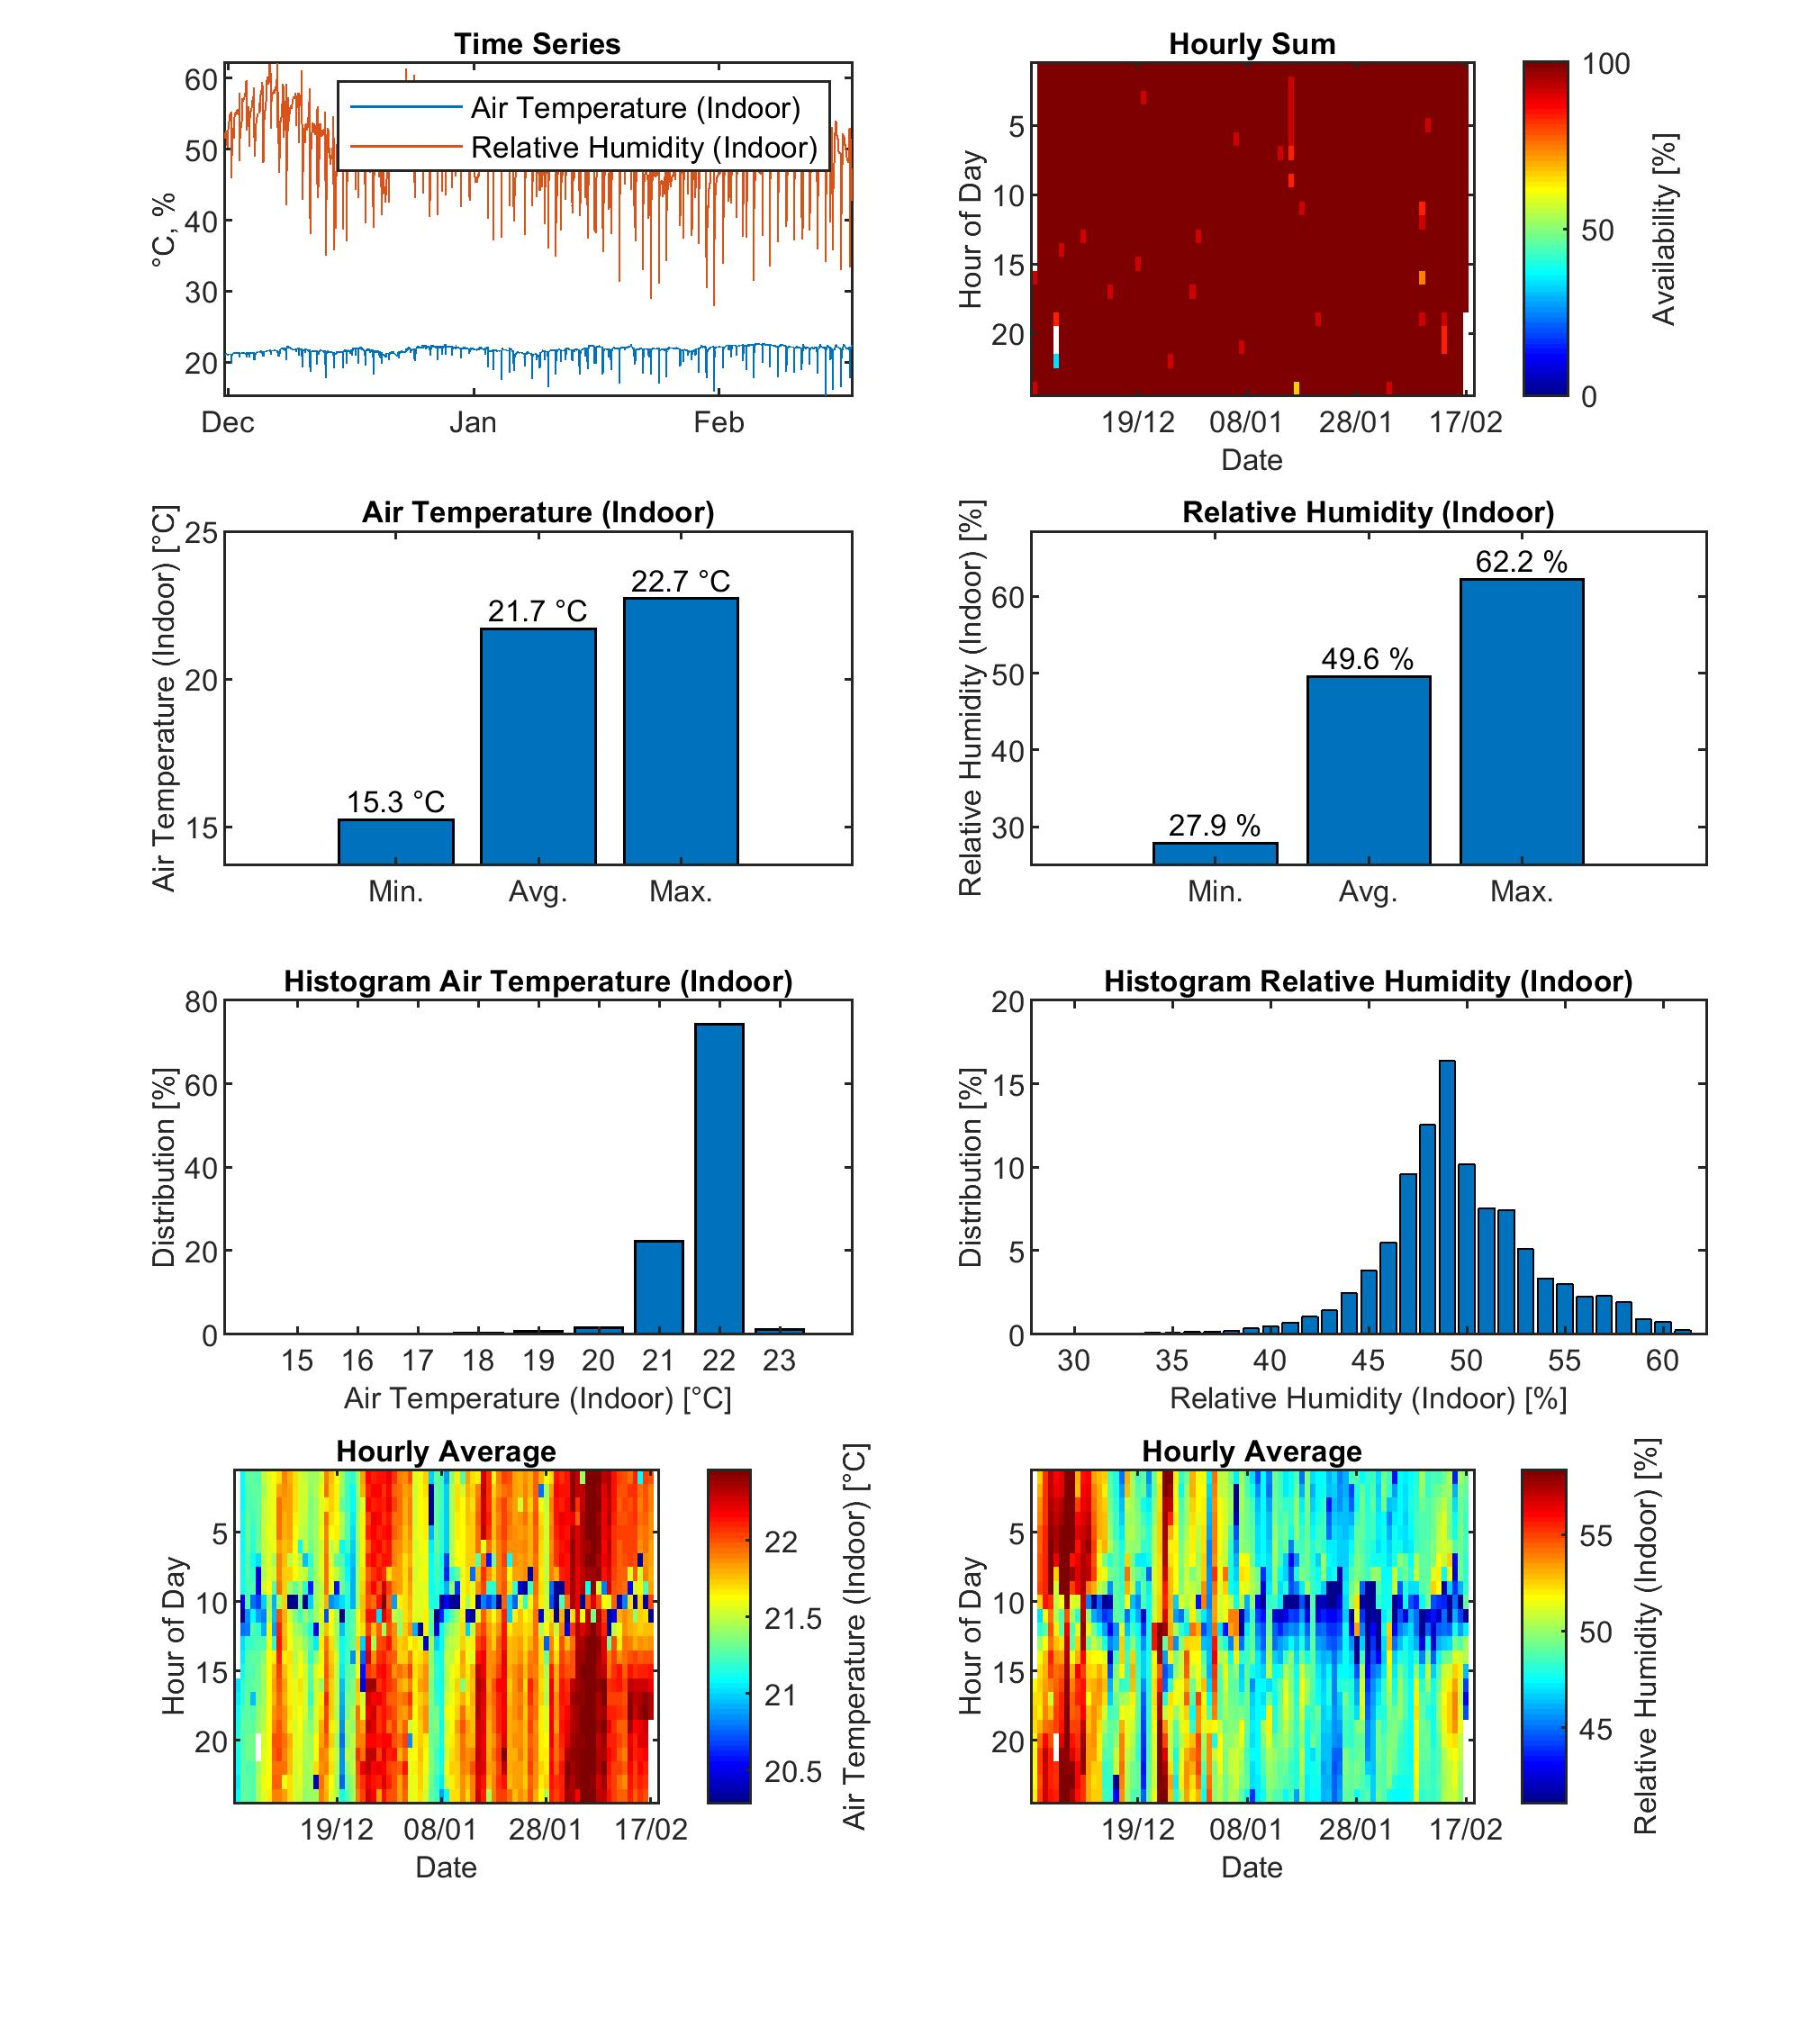
- Visualization
- The overview plots from the last two project logs were quite helpful in getting a quick first impression of the performance of the sensor nodes. However, to see whether the measured data is meaning full, we also used overview figures for single sensor nodes. These figures included the time series data, histograms, and raster plots. On example is shown below:
![]()
- Simplicity
-
Visualization and Quality of Data 2 – The Ugly
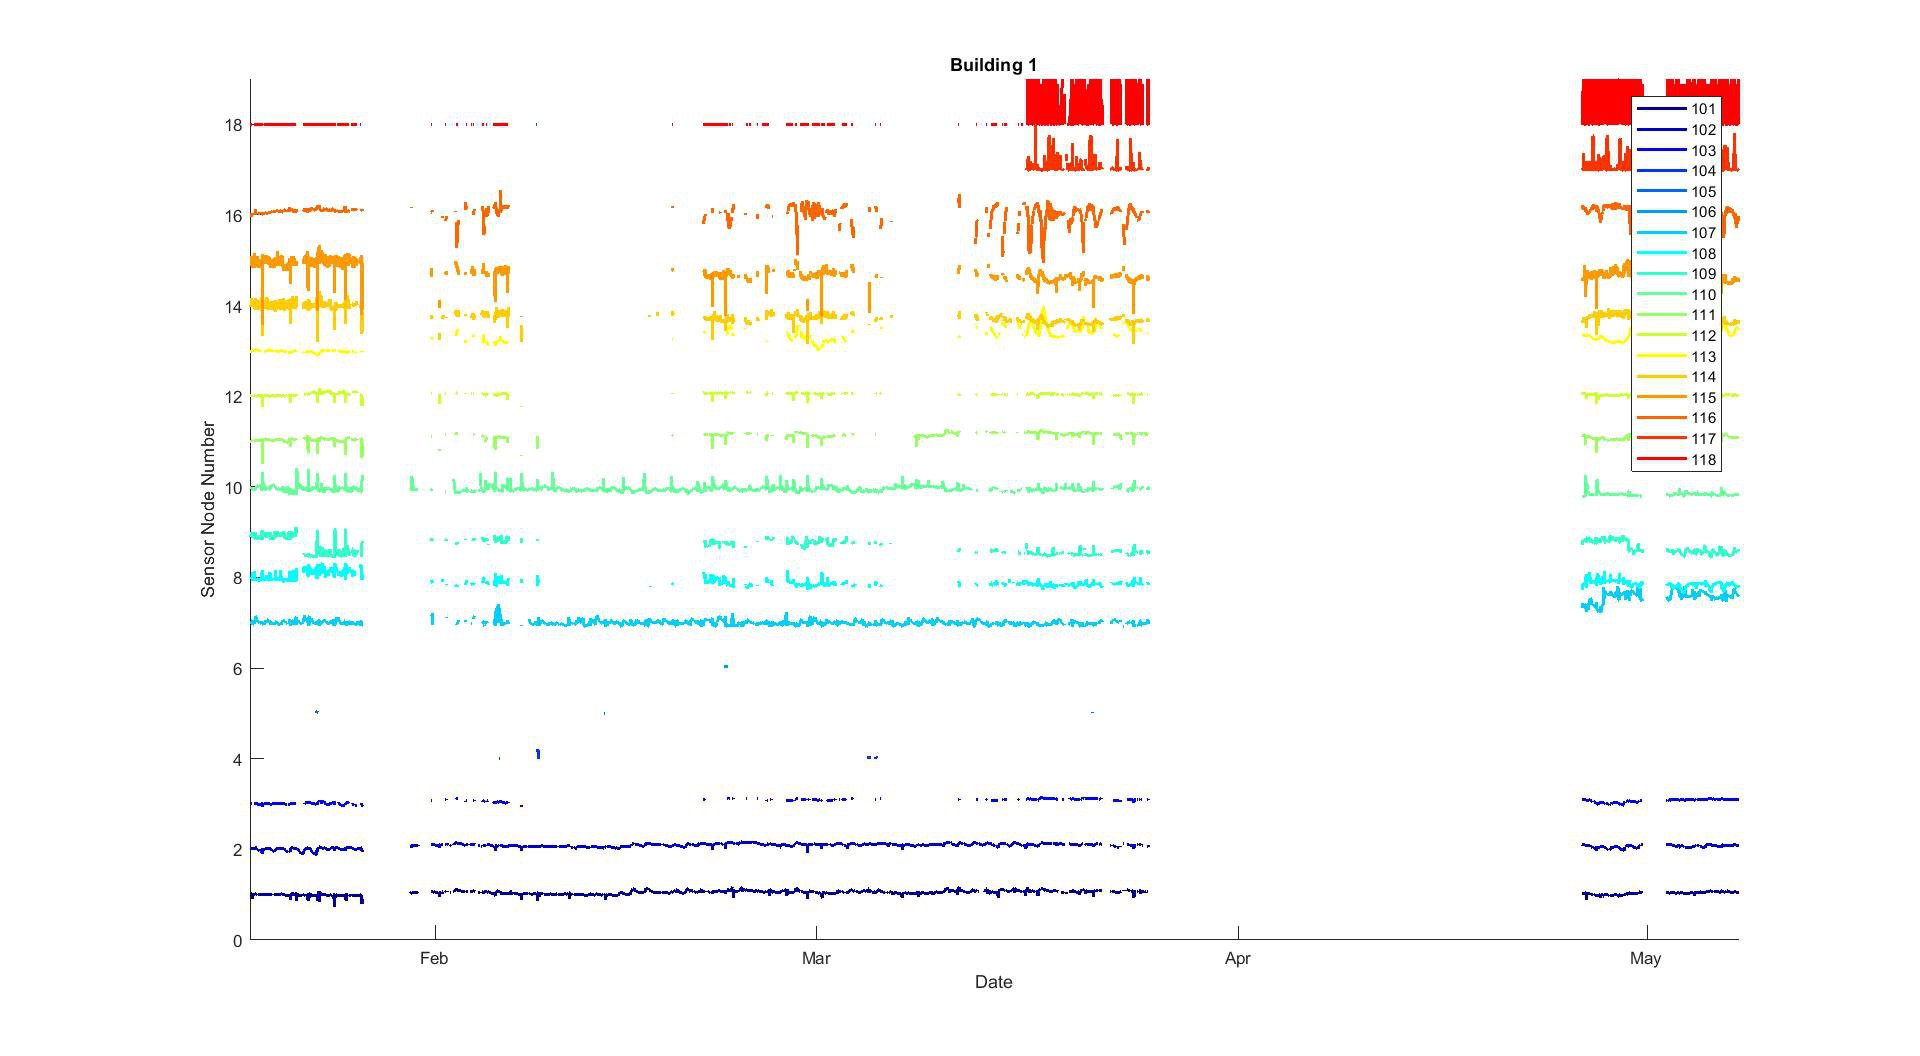
04/11/2020 at 21:33 • 0 commentsThe figure below shows an example of quite low data quality. Again sensor nodes 4-6 don’t show much because the data is event-driven and the time gap between the events is usually too large. And sensor node 17 needed to be adjusted, just as in the example from the last project log. Sensor node 18 started only in March because the oil flow meter needed to be installed by a third party. There are two kinds of gaps; the first kind is where there is no data available for all sensor nodes such as at the end of January or in April. This kind of gap is caused by issues with the gateway. The other type of gap concerns only individual sensor nodes, while others continue to send data. Usually, these gaps are intermittent, however, there were cases where on-site intervention was necessary.
![]()
The gaps that concerned only individual sensor nodes could have been avoided by deploying more router nodes. The gaps concerning all sensor nodes were caused by different issues around the gateway, such as: - The power supply of the gateway was unplugged by occupants. This issue required an on-site visit.
- The antenna cable of the modem was disconnected (reason unclear). This issue required an on-site visit.
- Unrelated issues on the web server: Once the web admin accidentally shut down our web server and in another instance, an unrelated script caused on overload on the web server.
- Issues with the modem on the gateway. We suspect that in the case of bad cellular reception, the modem would increase the sending power, and therefore draw more current, which in turn causes a brown-out, which triggers a reset on the microcontroller. However, we were not able to confirm the issue. Sometimes, this issue was resolved by itself. Other times, an on-site visit was necessary. In that case, relocating the gateway would solve the problem. However, the Feather-Fona-Gateway does not have offline storage, and even with offline data storage, all data would probably have been lost anyway, because the microcontroller was stuck in a reset loop. Hence, we abandoned the Feather32u4 Fona. Instead, we opted for a gateway consisting of an Arduino Mega, Fona breakout board, RTC, and SD-card adapter. The Mega-Gateway showed much better performance with only very little lost data. Also, we redesigned the gateway housing in such a way that the antenna won’t be unplugged from the modem when opening the enclosure. -
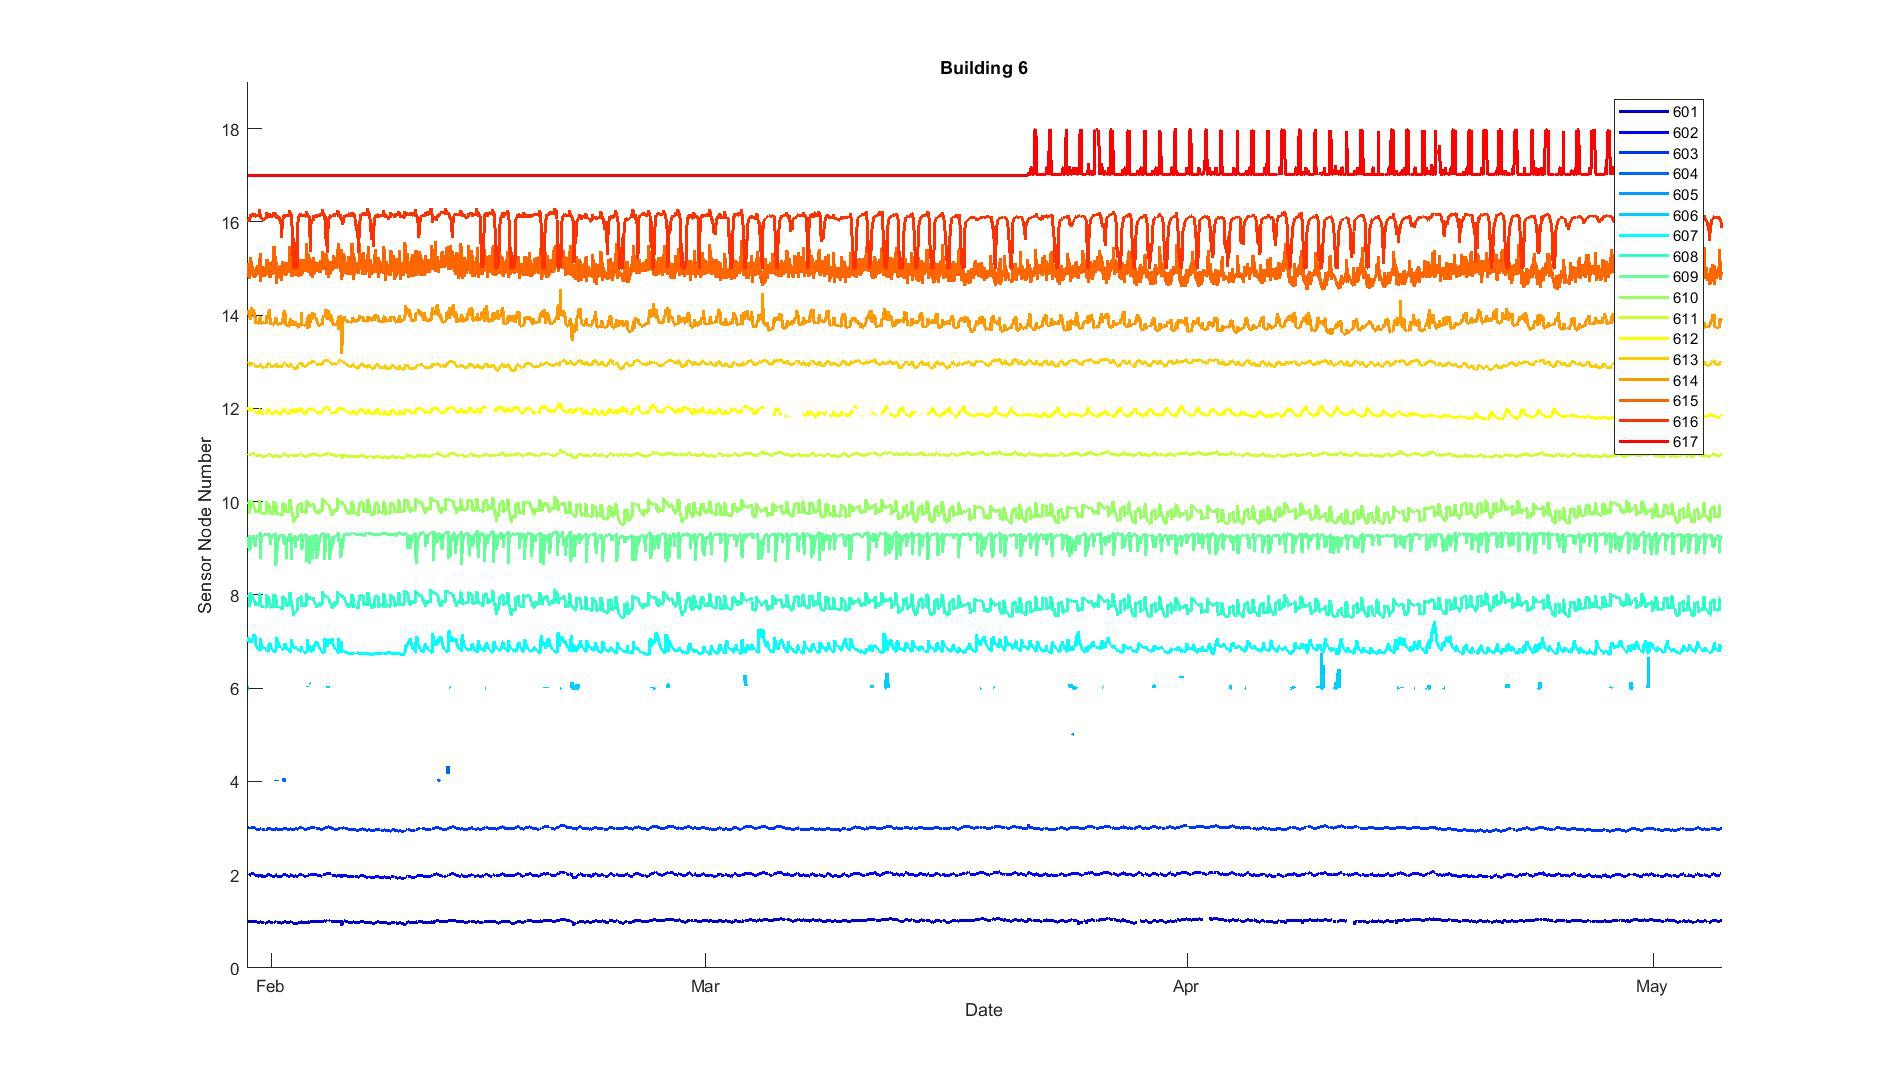
Visualization and Quality of Data 1 – The Good
04/11/2020 at 21:28 • 0 commentsThe quality of the gathered measurement data varied quite a bit between the different buildings. The overview plots I am using show all measured data from 18 sensor nodes in one figure. For that purpose, the mean of the measured data was subtracted, and then the result time-series was scaled by the maximum of its absolute values. The y-axis shows the sensor node number. Similarly, the legend shows the sensor node number plus the gateway identifier, e.g., the sensor node 601 is sensor node 1 associated with the gateway 600. In the plot, two data points are only connected if the time gap is less than 15 minutes; otherwise there will be a gap. However, only gaps of several hours are visible in the figure due to the resolution. This representation allows us to assess some characteristics of all time-series of one building in one figure; time-series gaps, variations in the data, and irregularities can be seen. However, this does not work for event-based data, i.e., windows opening events. In the data sets presented here, the sensor nodes show the following data: Sensor nodes 1-3: Indoor temperature & Relative humidity, Sensor nodes 4-6: Window opening times, Sensor node 7: CO2 concentration Sensor nodes 8-10: Supply and return temperature of heating systems Sensor nodes 11-13: Indoor and outdoor temperature of building elements Sensor nodes 14-16: Heat flux through building elements Sensor node 17: Electricity consumption Sensor node 18: Oil consumption If more then one sensor is connected to one sensor node, only one entity is shown in the overview plot.
The figure below shows an example of a set of measured data with good quality. There are only a few gaps visible, e.g. sensor node 1 in April, and sensor node 12 in March. Sensor nodes 4-6 don’t show very little data, because they represent windows opening times, which are event-based. So lines are only visible, if the windows was opened twice within a short time. Sensor node 17 only shows activity starting in March. This is because the pulse detector for electricity metering didn’t work initially and needed to be fixed. Sensor node 18 doesn’t show up, because it wasn’t installed at all. Sensor nodes 1-3 and 11-13 appear to have small extremes compared to the mean. While sensor nodes 14-17 show much more pronounced spikes. Sensor node 16 was a heat flux sensor mounted on a south-facing window. The peaks are from solar radiation causing large heat fluxes from the outside to the inside. Sensor node 17 measures the electricity consumption of the entire building. The spikes are caused by the resistive electrical heating system, which heats up large water tanks during the night. More on that can be found here: https://www.sciencedirect.com/science/article/pii/S0378778818316256
![]()
-
Deployment 3 - Incidents
12/02/2019 at 13:08 • 0 commentsDuring the deployment and retrieving of the sensor nodes, two notable incidents happened that affected the occupants negatively. Two more incidents affected only the data acquisition In the first incident, a freezer stopped working in the night after the sensor deployment. For the installation of a router node, I unplugged the freezer, inserted a multi-plug, plugged in the freezer and the router node. After the installation of all sensors, I notified the building owner of the procedure and even opened the freezer door to demonstrate that it was still working. To me, it is unclear if the unplugging was the cause of the freezer thawing or if it was just an unlucky coincidence. However, the building owner was able to eat all the contents in a timely fashion. So besides the inconvenience, there was no damage. The freezer continued to work after the incident.
The second incident happened during the removal of a sensor network. The gateway of the WSN was plugged into a multi-plug together with the building owner’s modem. To retrieve the multiplug, I unplugged the modem, removed the multiplug and plugged the modem in again. However, the modem refused to work again. The building owner was working from home and was less than amused. The modem was replaced by the internet provider without charge. The internet provider stated that unplugging and re-plugging the modem is acceptable and should not corrupt the modem. Nevertheless, it caused some inconvenience for the case study participants, which was compensated with a bottle of wine and some chocolate.
In one instance, the heating system reached its end of life and was replaced by a new one. In this process, the sensor nodes attached to the heating system were discarded together with the heating system. This had also the consequence that for this building, we were only able to acquire a limited amount of heating data. All other sensors nodes could be retrieved intact.
After the measurement campaign, I left the sensor nodes operating as they were in our office space, in order to assess the battery lifetime. During this time, a fourth incident happened. The admin from our institution took the webserver down because the responsible person from our time left the institution. This took all sensors offline and would have been very inconvenient during the campaign. However, after a few emails, the server was up again, and all sensor nodes would resume reporting measurement data.
In the beginning, we had the concern that pets might interfere with the cables from the sensor nodes. However, pets never caused an issue with the sensor network.
-
Deployment 2 – Energy Metering
03/12/2019 at 14:42 • 0 commentsIn Switzerland, the electricity is provided by the municipalities. This results in a large variety of electricity meters present in the buildings. Ideally, the electricity meters would have a visibly pulsing LED that indicates the energy consumption. That was the case for a few buildings. Sometimes the LED was infrared. However, in some cases, the electricity meters were old analog meters, which could not be interfaced easily. In anticipation of the problem, I called a few electricity suppliers about that issue. Some providers offered to replace the old meters on demand and for free since they would replace the electricity meters anyways eventually. Other providers would refuse to cooperate.
Electricity meters caused an additional issue. The detection of the LED flash worked in the lab but did not work in the buildings. It turned out that the LED flashes of the electricity meters in the buildings were significantly shorter than the LED flashes of the electricity meter in the lab. The sensor module for pulse detection (electric pulses or light pulses) used a debouncing IC (MAX6816). The LED flashes from the electricity meters in the lab were long enough to be detected after the debouncing. The LED flashes from the electricity meters in the buildings were shorter and were ignored by the debouncing IC. The issue was solved by removing the debouncing IC for detection of light pulses. In hindsight, this is an obvious and straightforward issue.
The municipalities also provide gas. However, in the region, where the case study took place, all meters were analog, and there were no plans to replace them anytime soon. However, in other places digital gas meters with a pulsing LED as an indicator can be found (e.g., Zurich).
-
Deployment 1 – Case Study 1
03/06/2019 at 16:32 • 0 commentsThe current version of the sensor network was deployed in eight single-family buildings in Switzerland. The deployment started by the end of January 2017 and was ended in May 2017. Ideally, we would have started at the beginning of the heating season. One sensor kit was placed in each house. A sensor kit consisted of 18 sensor nodes, 5 router nodes, and 1 gateway. Just in these eight buildings, we have encountered a large variety of heating system setups: the energy source for heating, the energy source for domestic hot water, the metering infrastructure, the heat emission systems, and the heat storage. Sometimes we would only learn about the circumstances when being in the actual buildings.
The case study participants were all buildings owners, who were customers of building energy assessor. We cooperated with the assessor, who asked his customers if they were interested in participating in a case study. The assessor provided us with his assessment of the buildings, which included building plans. We used the information to propose the placement of the sensors. After arrival on the side, I would sit down with the case study participants and explain the reasons for the case study and the course of action. During this talk, I would also discuss a data privacy statement, which they had to sign. Then, the building owners would show me the building, and during this tour, I made suggestions about where to place the sensors. If the building owner agreed, I would put the sensor on the floor for later installation. If the building owner disagreed, we would find an alternative solution. After the house tour with the owner, I would install all sensors properly, clean up and check whether all sensors appeared online. By the end, I would again make a tour throughout the building with the owner, indicate the sensors and asked whether he/she was content with the installation. Then I would say good-bye. The whole deployment including introduction, house tours, questionnaire took on average 2.5 hours.
The oil flow meter for oil-based heating systems was installed by a third party after the initial sensor deployment. (Pro tip: measure the diameter of the oil line during the first visit, or you have to visit again). After the oil meters were installed, I would go back to the building for a check on all the sensors (check whether they still stick where I stuck them or whether they fell off). The sensors held up quite well. However, a few fell off (e.g., heat flux sensors or reed switches) but nothing major. The check of the sensor network took about one hour per building.
-
Sensor Network History 3 – Third Iteration (current)
09/20/2018 at 17:54 • 0 commentsBy now, I got a bit of experience with deploying and operating sensor networks. The major improvements of this iteration are:
- Modular platform
- Battery powered sensor nodes (with optional mains adapter)
- Modular composition of sensor nodes
- Microcontroller based gateway
- SMD components for PCB
- Nice 3D-printed cases
- Xbee for communication between nodes
- Router nodes
- GSM for data transfer
- MySQL tables for data storage (with PHP interface)
The following aspects remain unchanged from the last iteration:
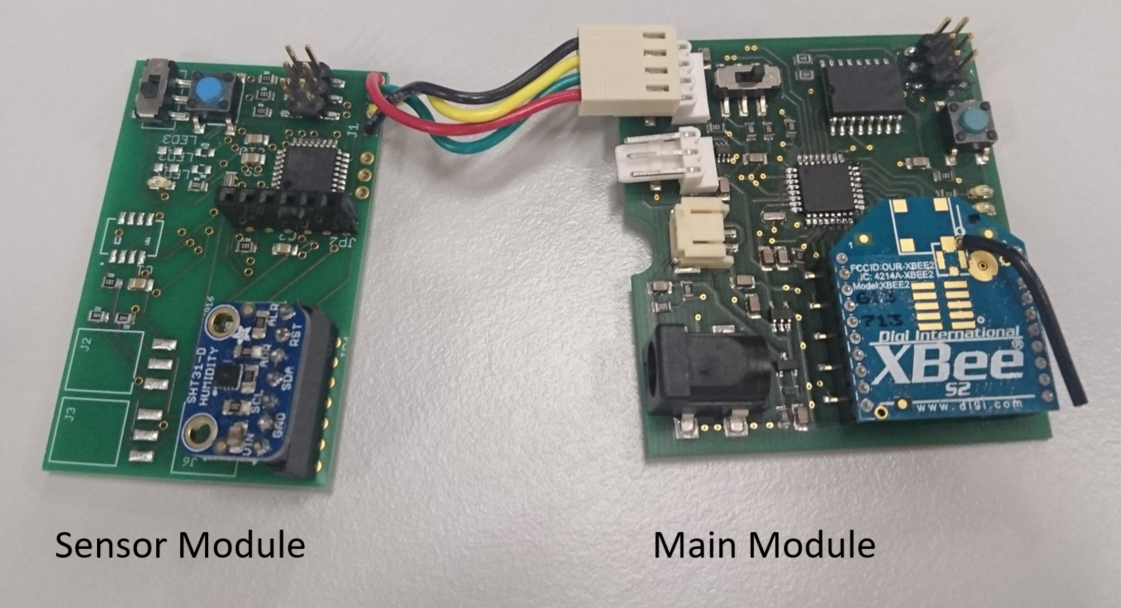
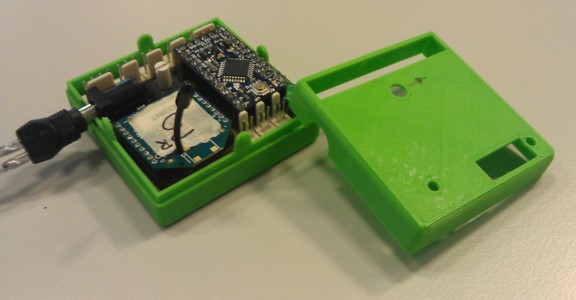
The sensor nodes of the third iteration of the sensor network were split into two modules. The main module takes care or power supply and communication, and the sensor module interfaces the sensors and relays the sensor readings to the main modules. This allows separating the hardware and software development of the sensors from the rest of the sensor network.
![]()
The main module features an ATmega328p, an Xbee, SD-card, RTC, LiPo-battery, power jack for mains adapters and connectors to the sensor module. The measurement interval is set on the main module. When it is time to take a measurement, the RTC will trigger an interrupt on the microcontroller, and the power to the sensor module is enabled. The sensor module then reads out the sensor and sends the data via serial to the main module. Then the power to the sensor board is again disabled. The measurement data is sent to the Gateway via Xbee. The measurement data can in addition stored on the SD-card of the main module with a time stamp from the RTC.
The sensor modules generally consist of an Atmega328p, connectors to the main board and various sensors. When the power to the sensor module is turned on, it reads out the sensor data and puts the data in a unified payload format for convenient data transmission and insertion into the database. Available sensor nodes are:
- Air temperature and relative humidity (SHT31)
- 2 temperatures (2xDS18B20)
- Heat flux (gSKIN-XO667C)
- CO2 concentration (S8)
- Luminosity (TSL2561)
- Windows opening times (reed switch)
- Pulse counter (electric pulses or light pulses, to interface electricity, oil and gas meters)
Router nodes still consist of an Xbee on a SparkFun XBee Explorer board powered by a mains adapter.
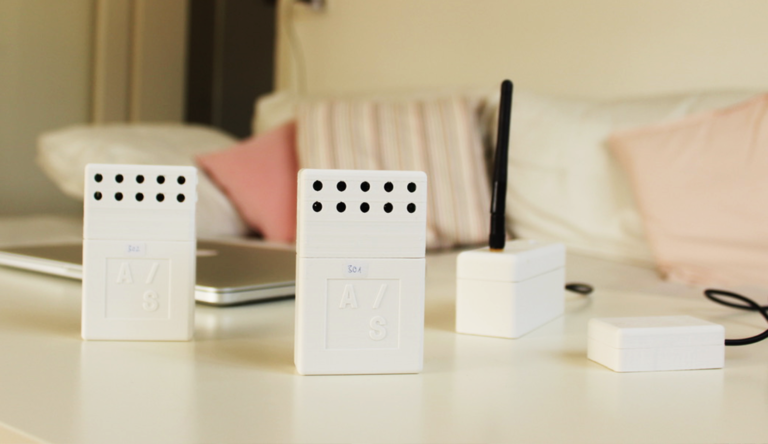
For the gateway, I chose an Adafruit Feather 32u4 Fona. It is Arduino compatible and features a GSM modem. The XBee is connected to the Feather Fona via a simple custom PCB. The image below shows from left to right two sensor modules, a gateway, and a router node.
![]()
With some support from students during development and production, we manufactured eight sensor kits with 18 sensor nodes each, plus some spare ones, about 150 in total. The sensor kits were deployed in eight single-family buildings. Some of the results can be found here: https://www.sciencedirect.com/science/article/pii/S1876610217329077
The installation of a sensor node took on average seven minutes per node. This is a huge improvement compared to 45 minutes with the previous version. The batteries lasted 10-12 month for most nodes. Exceptions were the nodes for windows opening times. The nodes for pulse counting and CO2 were powered by a mains adapter. During the deployment, I observed some issues with the gateway, leading to some data loss.
In summary
- When it works, it is really awesome
- Everything is on GitHub
- Quick and easy sensor deployment
- Sensor nodes have too many features leading to complexity and cost Gateway is not reliable enough (interference & occupant interaction)
-
Sensor Network History 2 – Second Iteration
08/02/2018 at 12:54 • 0 commentsFor the second iteration of the sensor network, I tried to make the sensor nodes universal and smaller. I integrated more sensors and switched from on-site internet to cellular. The sensor nodes were still powered with wall plugs. An Arduino Pro Mini was chosen as a microcontroller unit, and XBees were used for wireless communication. The sensor selection was as follows:
- Temperatures (2x DS18B20)
- Electric pulses (electricity meters, oil flow meters)
- Luminosity (TSL2561)
- Air temperature and relative humidity (SHT15)
- Small voltages (pyranometers, heat flux sensors, Opamp: ADA4528-1)
- Current clamp
The sensors were only used in certain combinations, e.g., two temperature sensors and a heat flux sensor for u-value measurement. The combination of the sensors had to be set with a rotary switch on the sensor node PCB. The gateway consisted of a Raspberry Pi, a USB-GSM-modem, an Xbee, USB memory stick, and a powered USB hub. The data was stored on the memory stick and in an online MySQL table. I chose a Raspberry Pi in order to have more computational power for having room to add more features. This version of the sensor network was deployed in four different case studies. Some of the results can be found here: https://infoscience.epfl.ch/record/213293/files/10_FREI.pdf
Now to the interesting part, the issues:
- The sensor nodes still relied on cords for power. It took up to 45 minutes to install and cable manage a single sensor node.
- Although, sensor nodes became more flexible, it was almost impossible to integrate new sensors into the system. Moreover, for the measurement range for small voltage was limited, leading to different resistor network configurations for heat flux sensors and pyranometers.
- The PCB is all through-hole, requiring considerable time for manufacturing.
- The amplification circuit for small voltages was quite crude.
- The operating system of the Raspberry Pi runs on an SD card. Corruption of the SD-card lead to several failures, including loss of data. After these incidents, the memory stick was added, and the operating system was set in a read-only mode. The read-only mode was cumbersome to enable and disable, which made changes to the python code on the Raspberry Pi cumbersome as well.
- Finding a USB-GSM modem that works with the Raspberry Pi was a bit of a gamble. An additional challenge was that USB-GSM modems of the same type but from different production lots or revisions did not work with the same setup. The difference between the modems could only be seen through software when plugged in.
- The USB-GSM modem requires more current than the Raspberry Pi can deliver, which made a powered USB-hub necessary, adding to the cost and complexity of the wiring.
- The 3D printed cases were brittle.
- The Raspberry Pi caused more problems than it solved.
- The power cables are a major burden during installation.
- Sensor nodes are still not flexible enough.
- Xbees work very well given that enough router nodes are deployed.
- Storing the data in MySQL tables works well.
- The size of the sensor nodes is ok.
In summary:
- The Raspberry Pi caused more problems than it solved.
- The power cables are a major burden during installation.
- Sensor nodes are still not flexible enough.
- Xbees work very well given that enough router nodes are deployed.
- Storing the data in MySQL tables works well.
- The size of sensor nodes is ok.
![]()