-
Analog-to-Digital Converter (ADC)
07/08/2016 at 20:09 • 0 commentsThe next goal was to record the fish frequency using the Arduino Zero. In my previous setup, I used the function generator and the SpikeRecorder app. In my data collection project log, I explain that you can approximate the fish's frequency by referencing the beat frequency.
The new method I want to implement is analog to digital conversion (ADC), using the Arduino Zero and the Muscle SpikerShield. The code I used for the ADC can be found here. Essentially, the code repeatedly takes thousands of samples of the voltage of the fish every second and determines the frequency based off the number of times the voltage switches from negative to positive, relative to an averaged value. This number roughly corresponds to the fish's frequency. Since we won't perfectly capture a sinusoidal signal in each sampling session, I include a way to include the endpoints of the signal to calculate a more precise frequency.
-
Digital-to-Analog Converter (DAC)
07/03/2016 at 16:12 • 0 commentsAs I previously mentioned, I would be transitioning from the function generator to an Arduino Zero. The Arduino Zero has a digital to analog converter (DAC) which makes this possible. An Instructables article by ForceTronics explains more about what this means and how we can use the DAC to make a pseudo waveform generator. I modified the example code because I don't expect to work much with signals over 1000 Hz. My changes include changing the sample count to a set number (100), and allowing the user to simply type in the desired frequency (range from 100 - 1000).
With an oscilloscope, you can confirm that the frequency you input is actually being transmitted. The next step is to mimic the fish signal's voltage. The Arduino Zero emits a 3.3 V signal and the weakly electric fish typically emit signals closer to 10 mV. To attenuate the Arduino Zero's signal to this level, you can use a simple voltage divider.
-
Preliminary Experiments
06/27/2016 at 03:17 • 0 commentsIn attempts to characterize the Jamming Avoidance Response, I ran various tests on the fish.
Control:
I wanted to make sure that in the absence of other fish or artificial stimuli that the fish in testing would stay at a constant frequency. To do this, I simply recorded the frequency of the fish over a period of 30 minutes. After the recording, I checked the frequency at regular intervals and confirmed that the fish maintains a steady frequency over time.
Frequency chasing:
As per the Watanabe and Takeda paper, the Eigenmannia species can be "chased" to the outer limits of their frequency ranges. This is done by slowly following the direction of the fish's frequency changes with the stimulus frequency. This ensures that the stimulus frequency is always close enough to elicit the JAR behavior.
I attempted a similar experiment with the Apteronotus Albifrons (Black Ghost Knife Fish). So far, I've only been able to chase the frequency downwards.
Long Term Frequency Elevation:
Other research on the weakly electric fish indicates that a stimulus frequency that persists can cause the effects of the JAR to persist as well. I simply left the function generator on at a set frequency for 2 hours and observed the results. I was able to modulate the frequency of the Black Ghost Knife Fish by over 40 Hz.
-
Collecting Data
06/27/2016 at 03:07 • 0 commentsI adopted a similar "beat method" used by Watanabe and Takeda to observe the effects of stimuli on the frequencies of the fish. This method takes advantage of wave interference. When two waves of slightly different frequencies interact, they will produce an alternating constructive and destructive interference pattern -- with sound waves, this is interpreted as alternating loud and soft sounds. Each of these fluctuations is known as a beat and the number of beats that occur in a second is known as the beat frequency.
Beat frequencies can be easily calculated -- it is simply the absolute value of the difference between the two waves. For example, if I stimulate the water with 850 Hz and the fish's resting electric organ discharge frequency is 860 Hz, the beat frequency would be 10 Hz.
Now, to visualize the beat frequency as well, I used the Backyard Brains Spike Recorder application found on their website. To start, I used the recording electrodes as input into the SpikerBox. After turning it on, I could estimate the fish's resting frequency.
Next, I turned on the function generator, setting it 5 Hz below the fish's resting frequency -- this resulted in a beat frequency of 5 Hz. The recording electrodes now pick up the wave interference caused by the stimulation frequency. On the Spike Recorder display, the beat frequency shows up as rhythmic bumps. This relates back to the idea of alternating constructive and destructive interference with the peaks being "loud sounds" and the troughs as "soft sounds".
Using the Spike Recorder, I can now record and watch the effects of certain stimuli on the fish's electric discharge frequency over time.
-
The Set-up
06/23/2016 at 05:06 • 0 commentsThe first phase of my project was to establish my workstation.
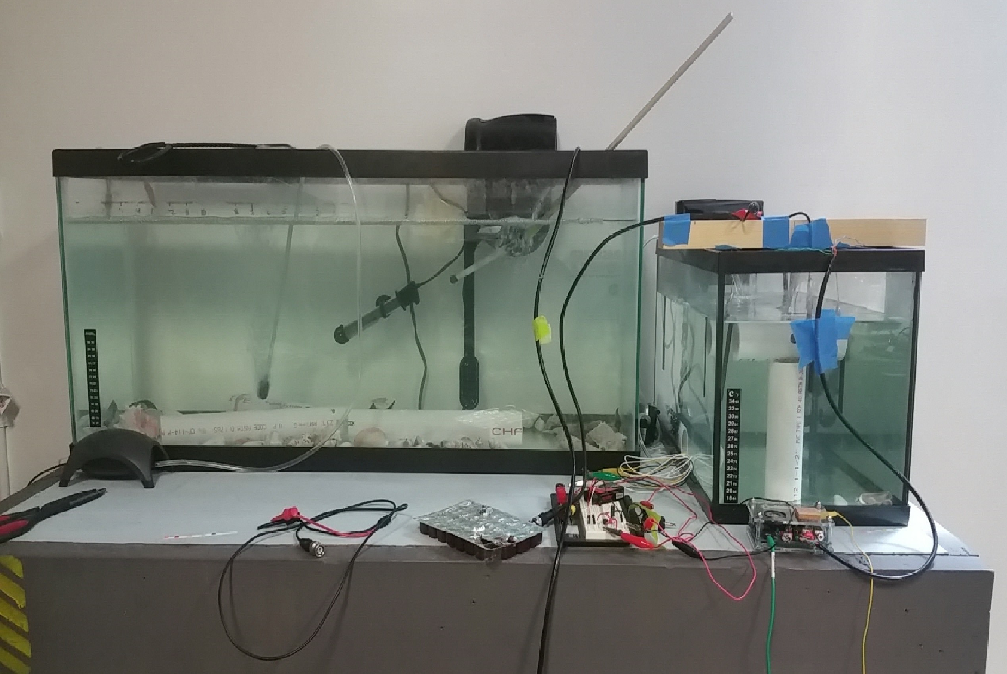
To start, I prepared two freshwater fish tanks -- a 40-gallon tank for the fish to live in and a 10-gallon tank for experimentation. These tanks included fixed heaters, water filters, and air pumps. These fish are comfortable between 73 and 80 degrees Fahrenheit and pH levels of 6.0 to 7.5. Consequently, conditions were held constantly at a temperature of 75 degrees Fahrenheit and a pH of 7.0. I fed the fish daily with frozen blood worms.
![]() The fish tanks with PVC pipes, heaters, water filters, and air pumps.
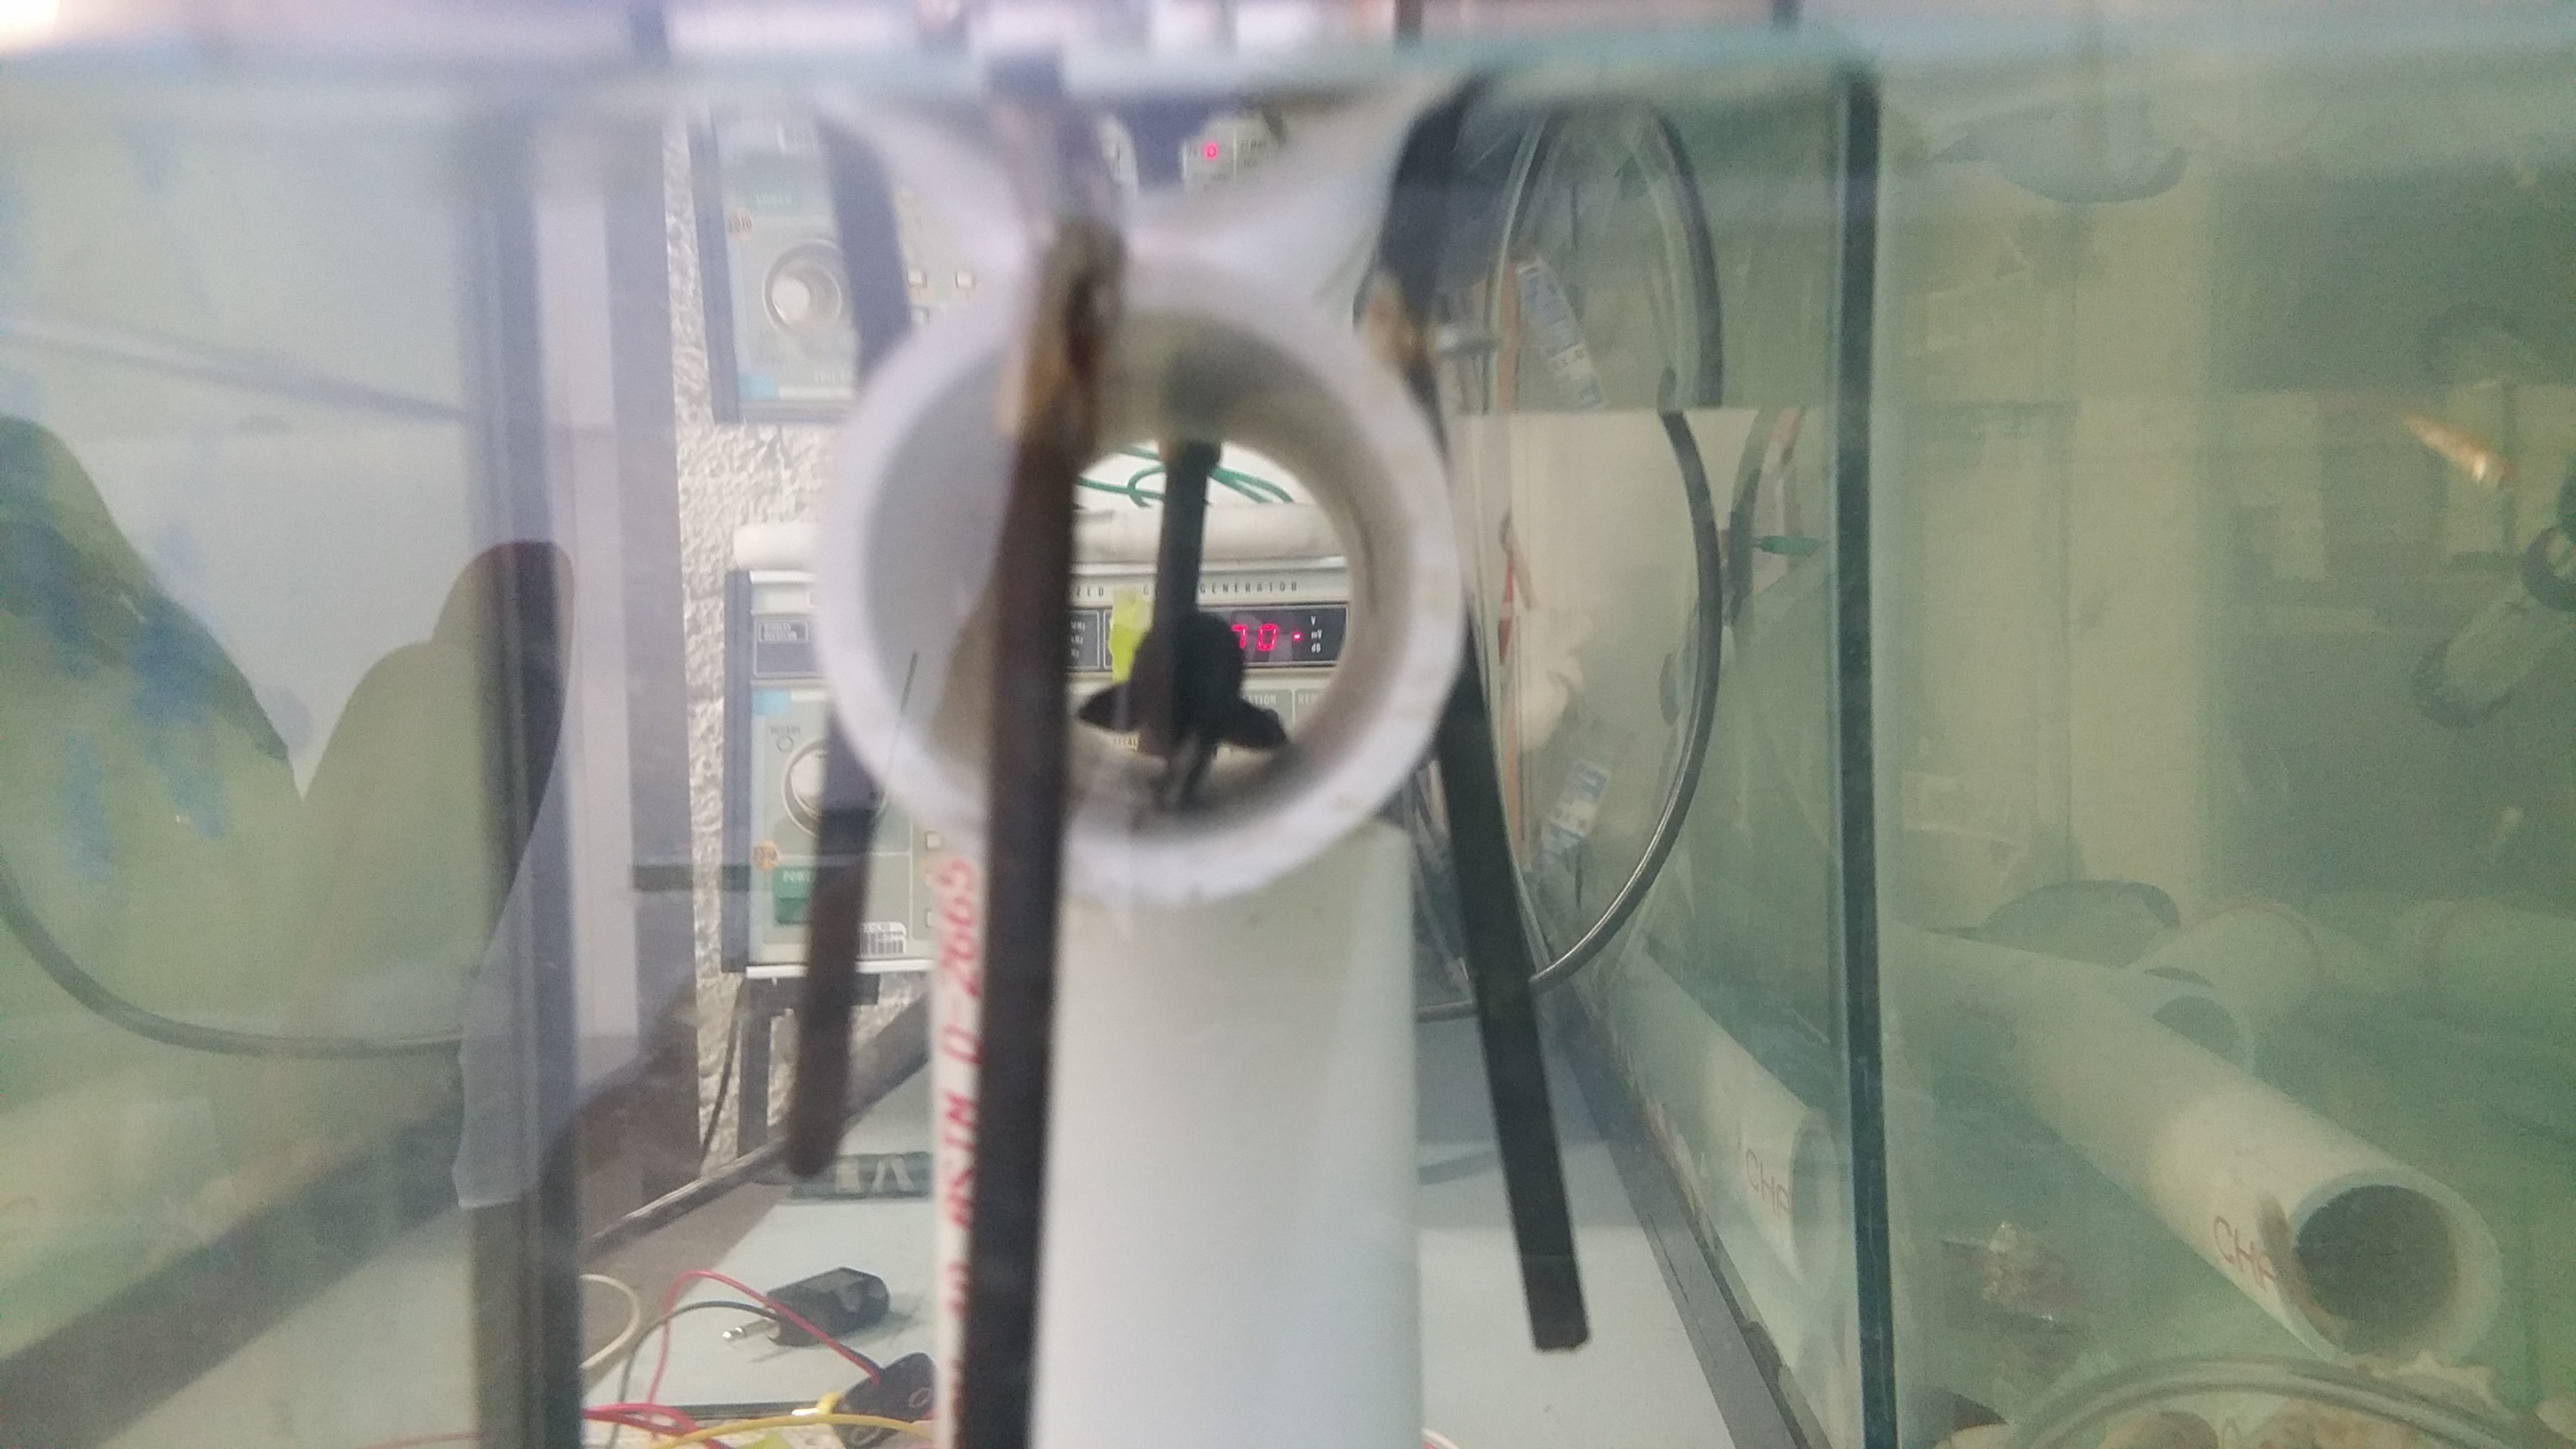
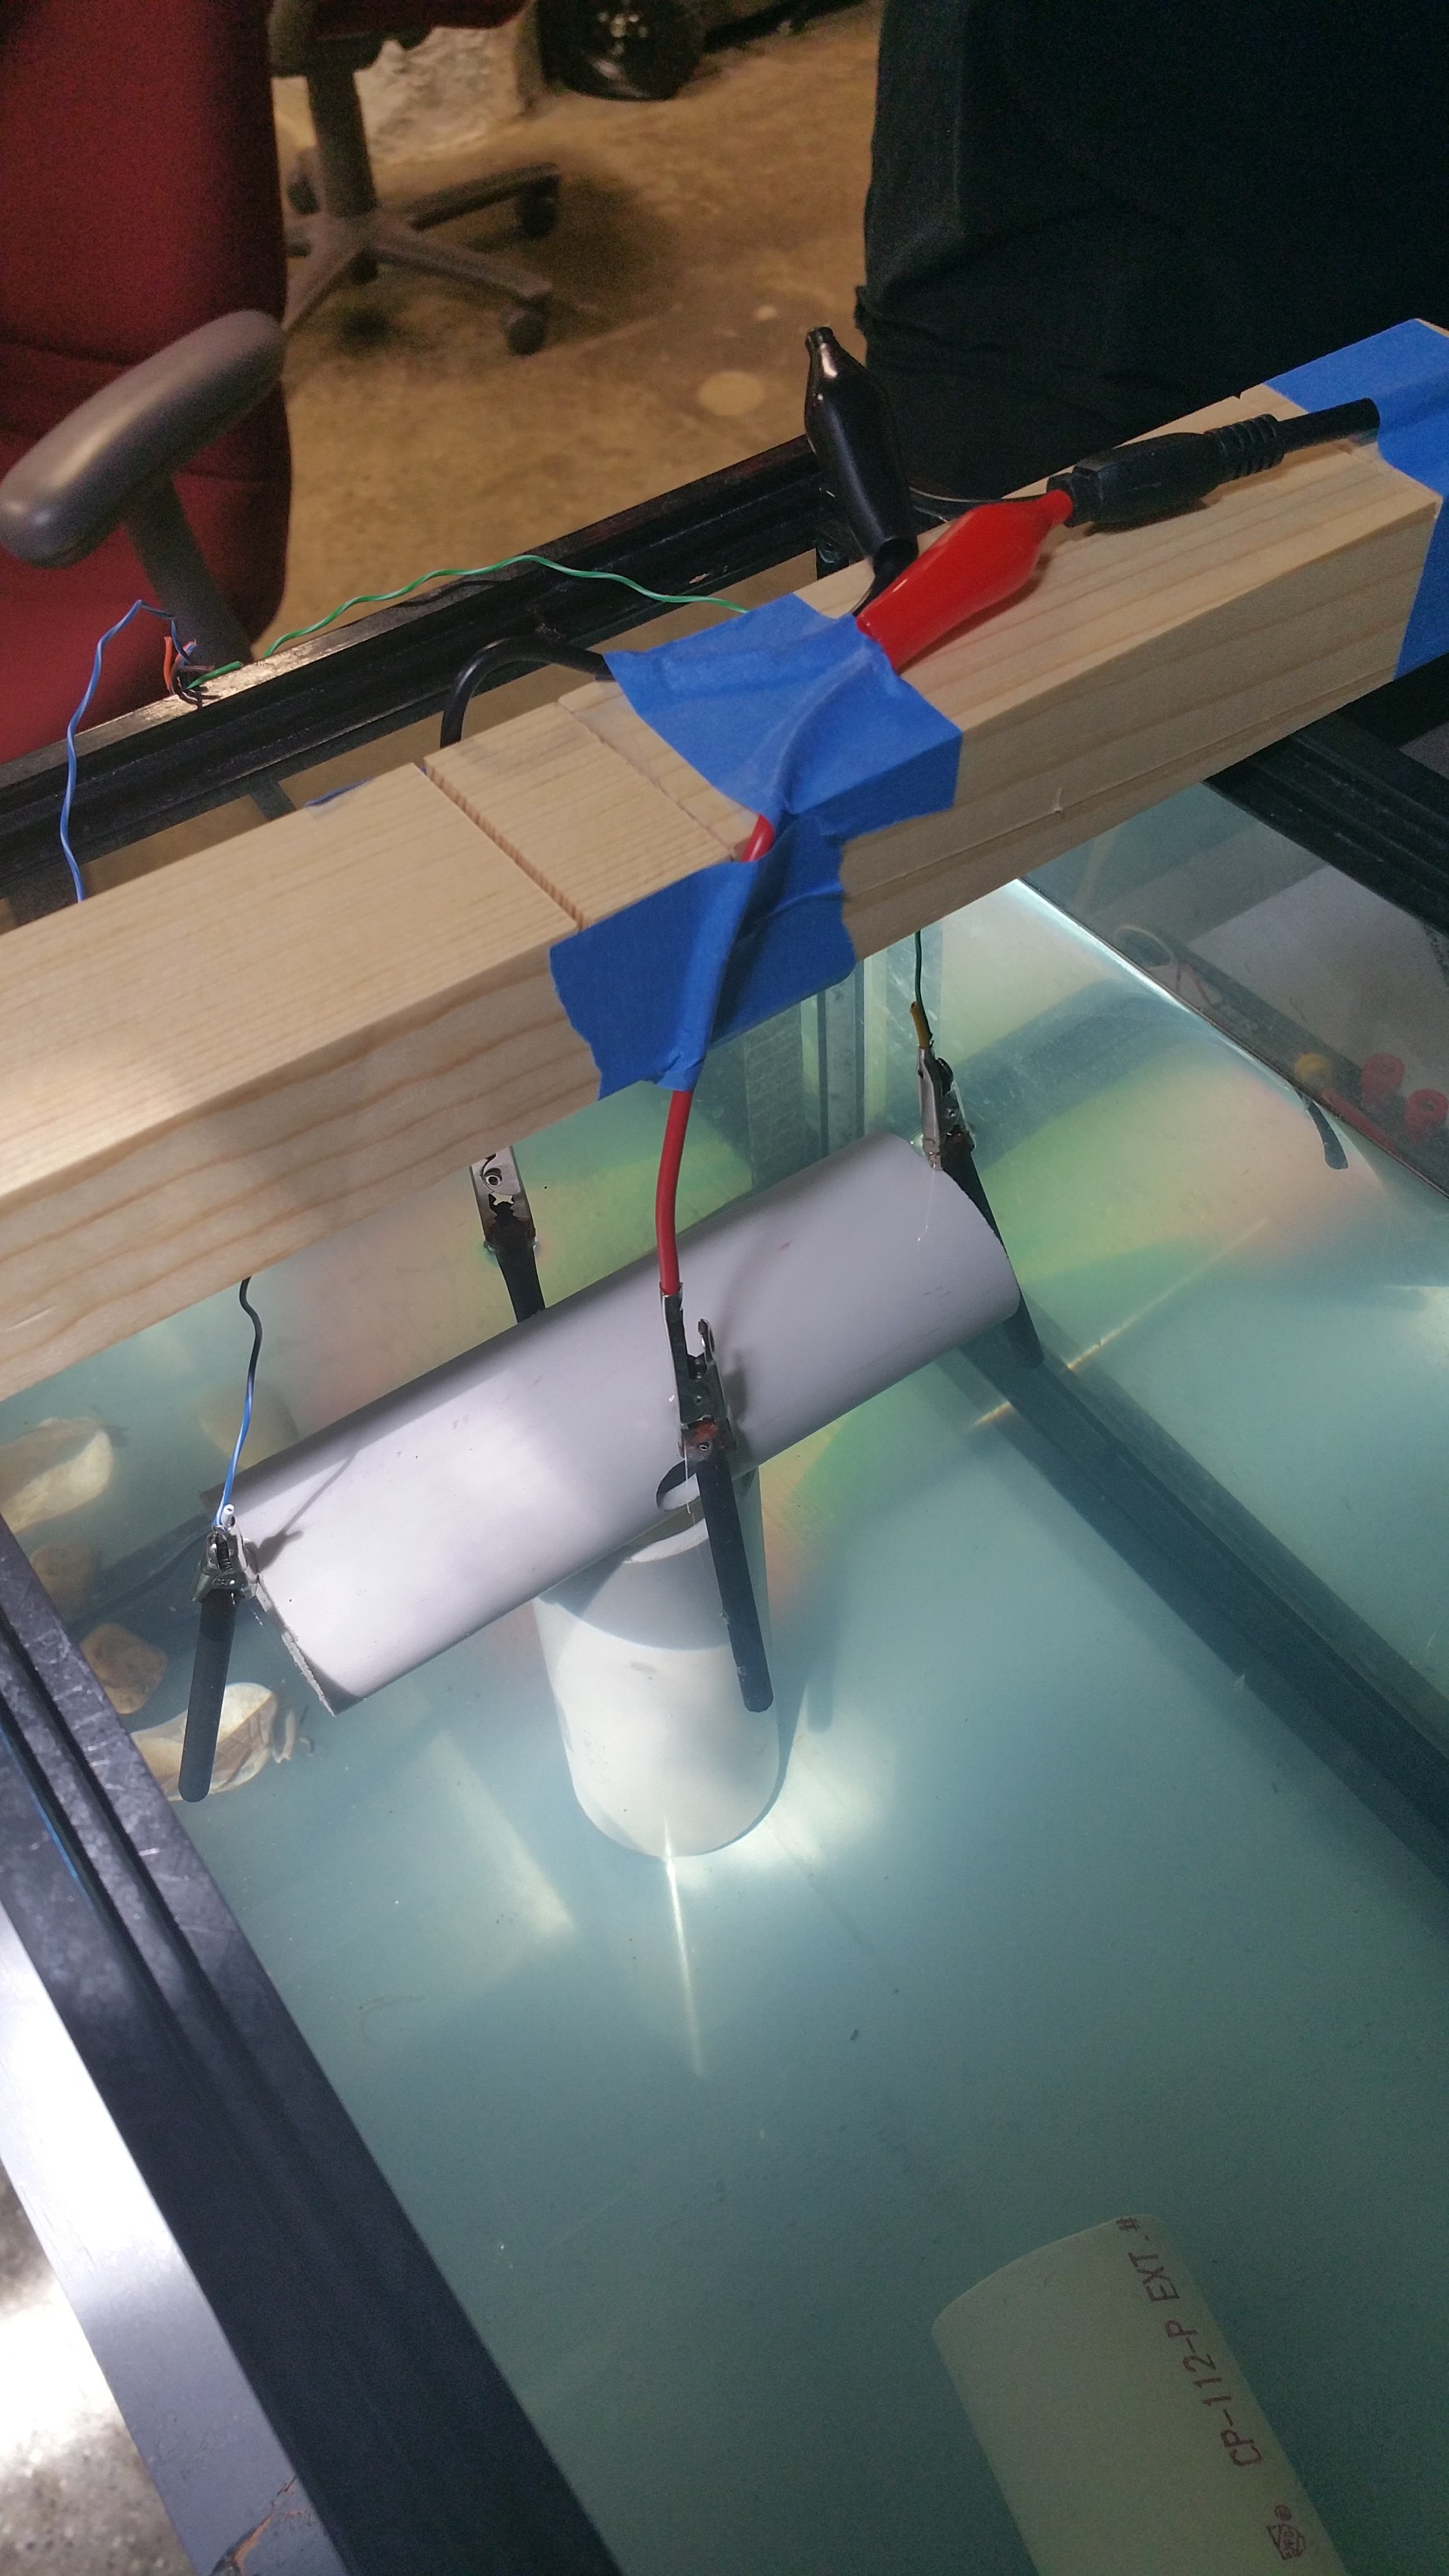
The fish tanks with PVC pipes, heaters, water filters, and air pumps.Knife fish especially enjoy hiding in small enclosures so I purchased PVC pipes, 1.5 inches in diameter. These PVC pipes doubled as a recording chambers because the fish will voluntarily stay inside for hours on end. For my recording equipment, I placed carbon electrode rods on either side of the PVC pipe. I then used alligator clips to connect them to my Backyard Brains SpikerBox. Using the Spike Recorder application found on the Backyard Brains website, I could visualize the frequencies of the electric fish. I used a RadioShack speaker-amplifier to listen to the tones as well.
![]()
A Black Ghost Knife Fish relaxing in the recording chamber.
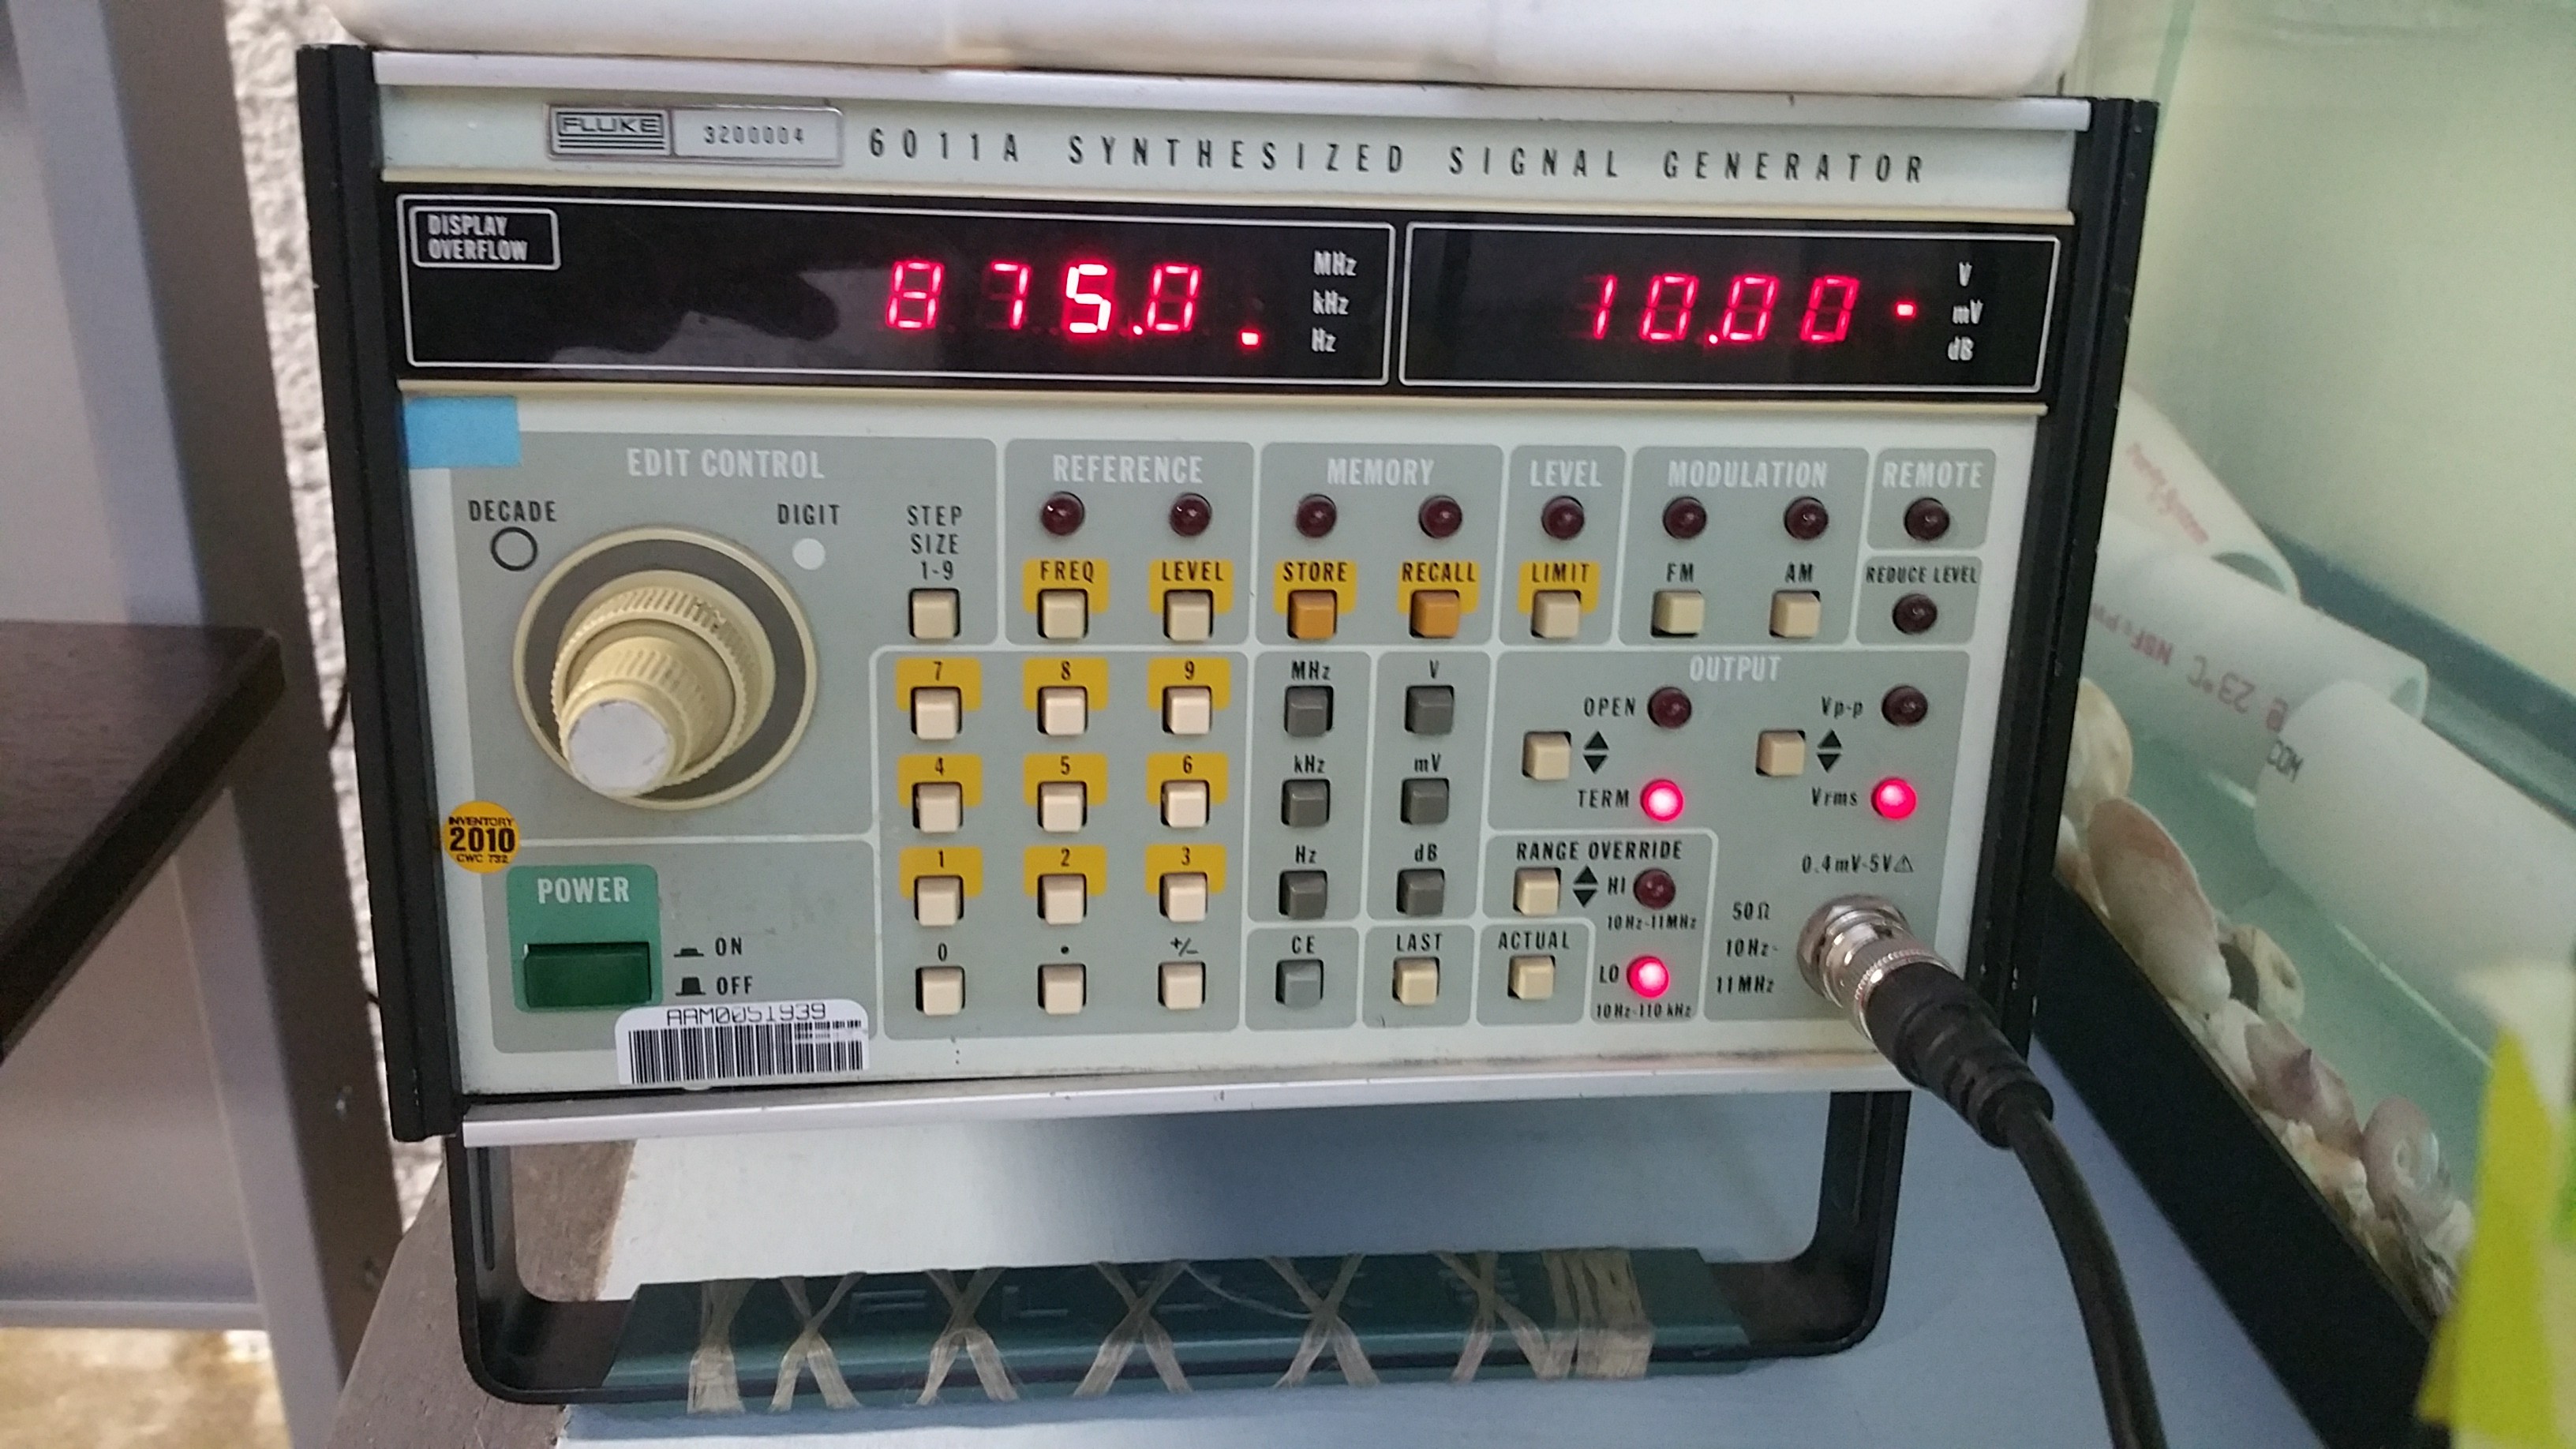
In order to stimulate the electric fish, I drilled a hole through both sides of the PVC pipe. I placed two more carbon electrode rods by these holes and clipped them to a function generator. For proof of concept, I wanted to start with a professional function generator to ensure clean data collection. I plan to use an alternative stimulation source in the future -- perhaps using the Arduino Zero's DAC.
![]()
I taped all the wires to a medium-sized wooden block for stability.
![]() The final set-up for the recording chamber
The final set-up for the recording chamber
The Electric Fish Piano
A DIY set-up to listen to, record, and manipulate the electrical tones produced by weakly electric fish!
 The fish tanks with PVC pipes, heaters, water filters, and air pumps.

 The final set-up for the recording chamber