doctek
-
An Adjustable Slit
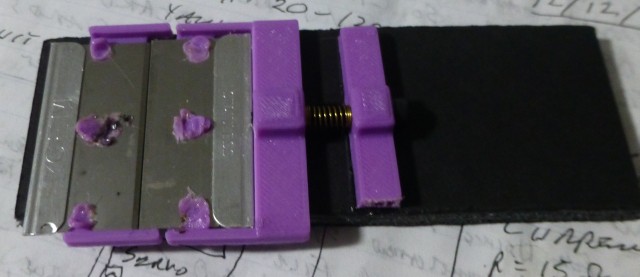
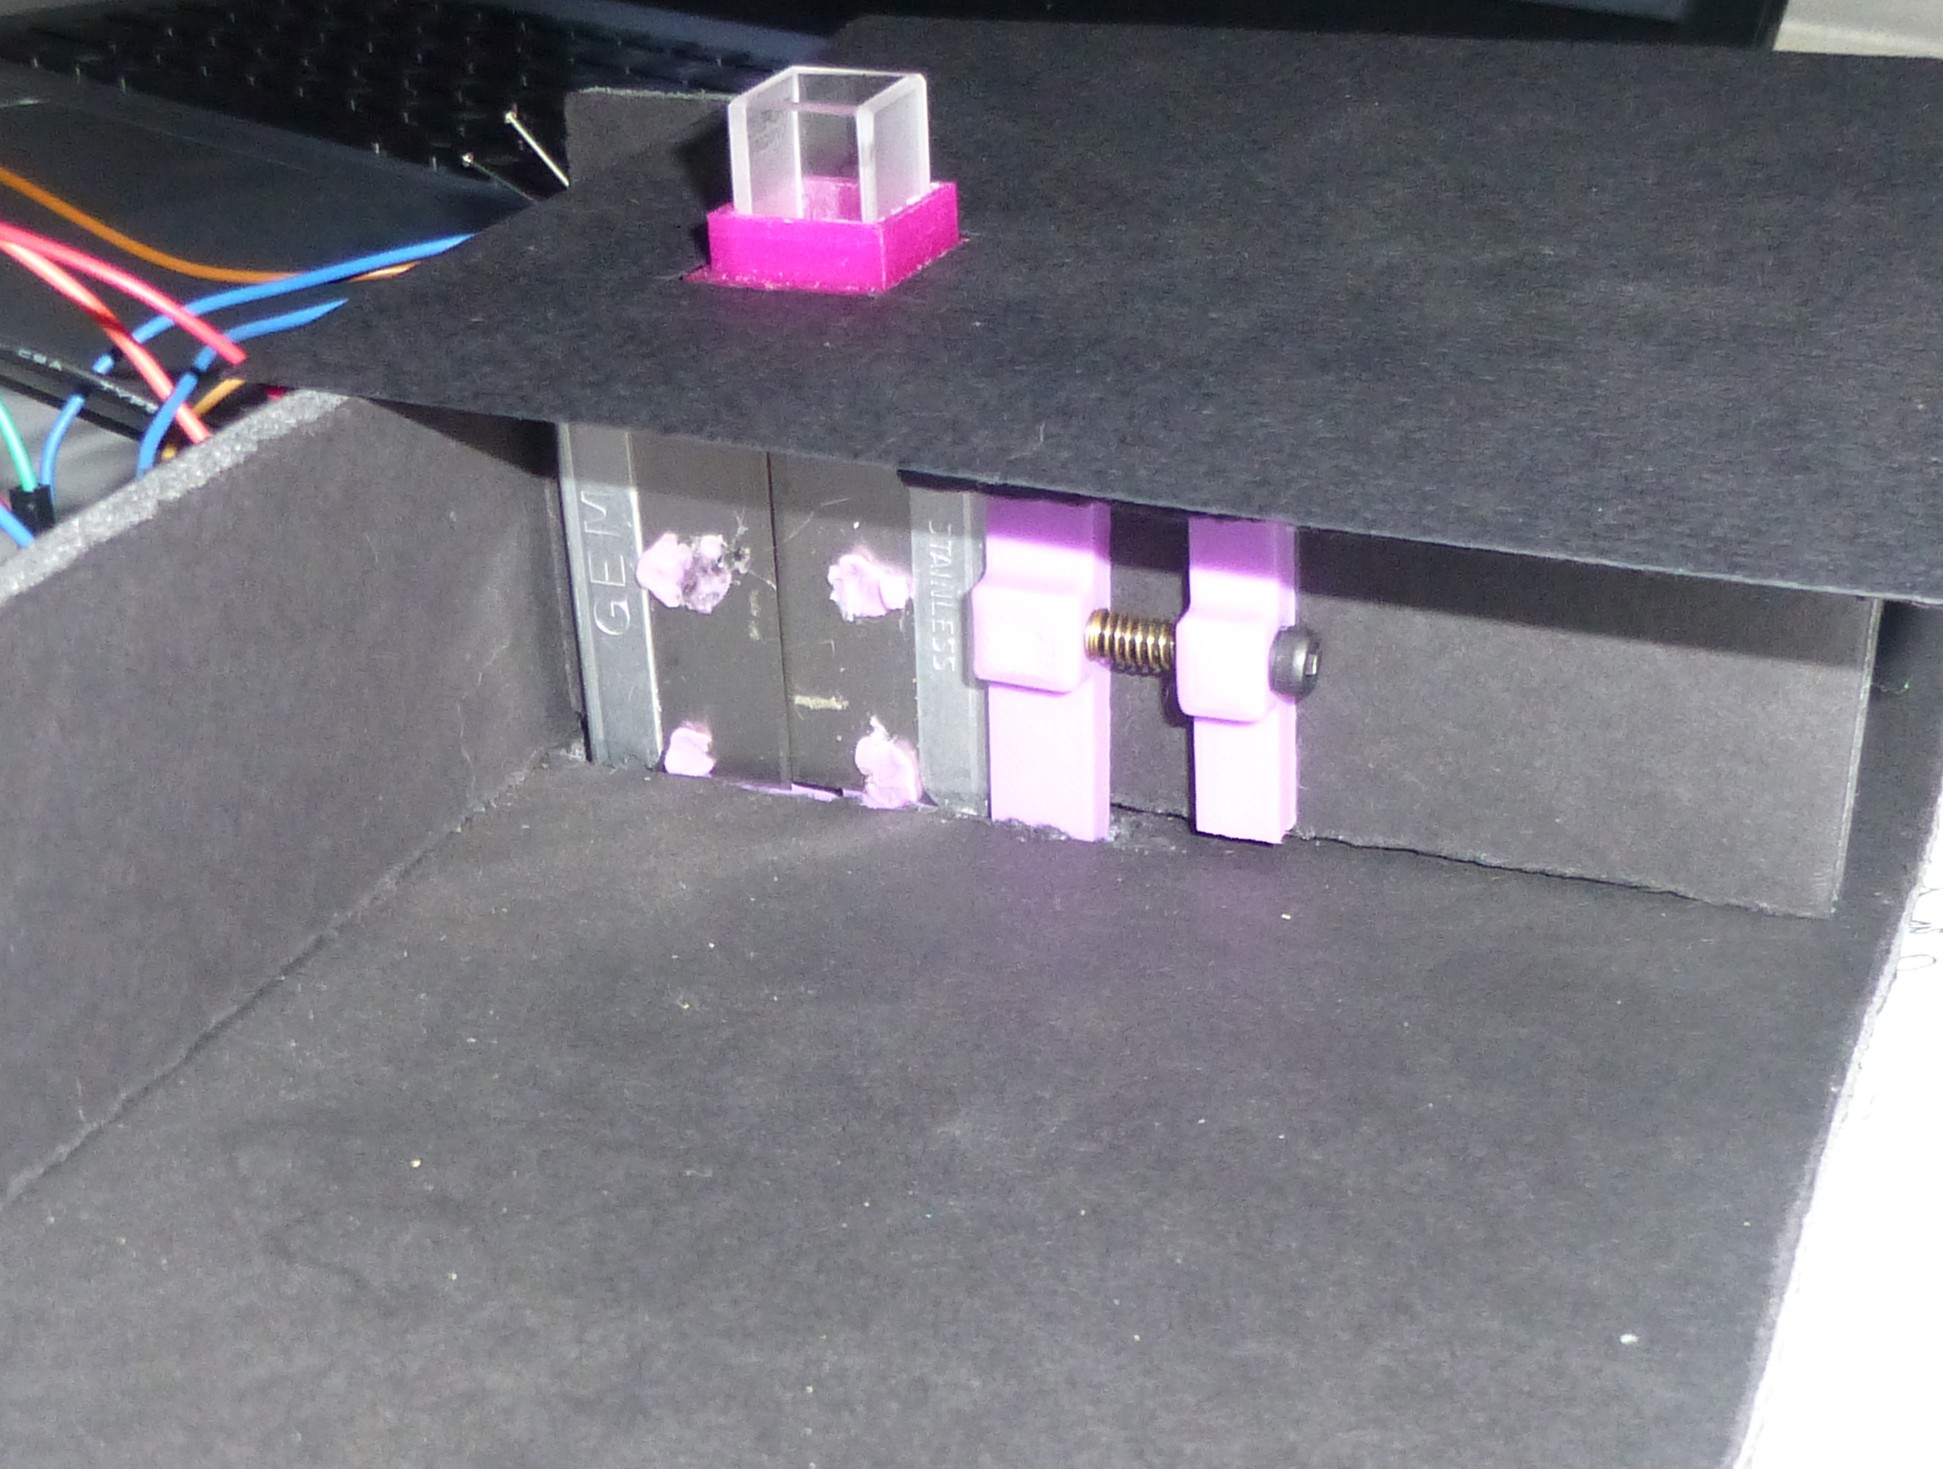
01/06/2017 at 01:40 • 0 commentsAs promised, I have created an adjustable slit for the spectrophotometer. This simple design still uses two single-edged razor blades, but makes one moveable so the width of the slit can be adjusted. Pegs on the blade holders are melted to hold the blades in place. A 3mm screw is used as the adjuster and a ball-point pen spring is used for tension. The left-hand blade holder and the screw mount are glued to the housing; the right-hand blade holder floats so the slit can be adjusted. I had to cut a groove in the floor of the housing to provide clearance for the new assembly. If you take the height of the assembly into account when you make your housing, this won't be necessary. (I'm just too lazy to make a new housing right now - maybe later?)
The stl files are posted so you can make your own (just like the rest of this project!). The design files in FreeCAD format are also posted, in case you want to modify anything.
Next step is to modify the control program and the data collection program to make use of the narrower slit. I'm thinking that using writeMicroseconds for fine control will work.
As an aside, it occurs to me that the adjustable slit could be controlled with a stepper motor to provide variable resolution. A narrower slit and finer movement of the light source could be used in a region of interest, while a wider slit could be used elsewhere for faster data collection. Hmmmm.
![]()
![]()
-
Contributor Visits from Colombia
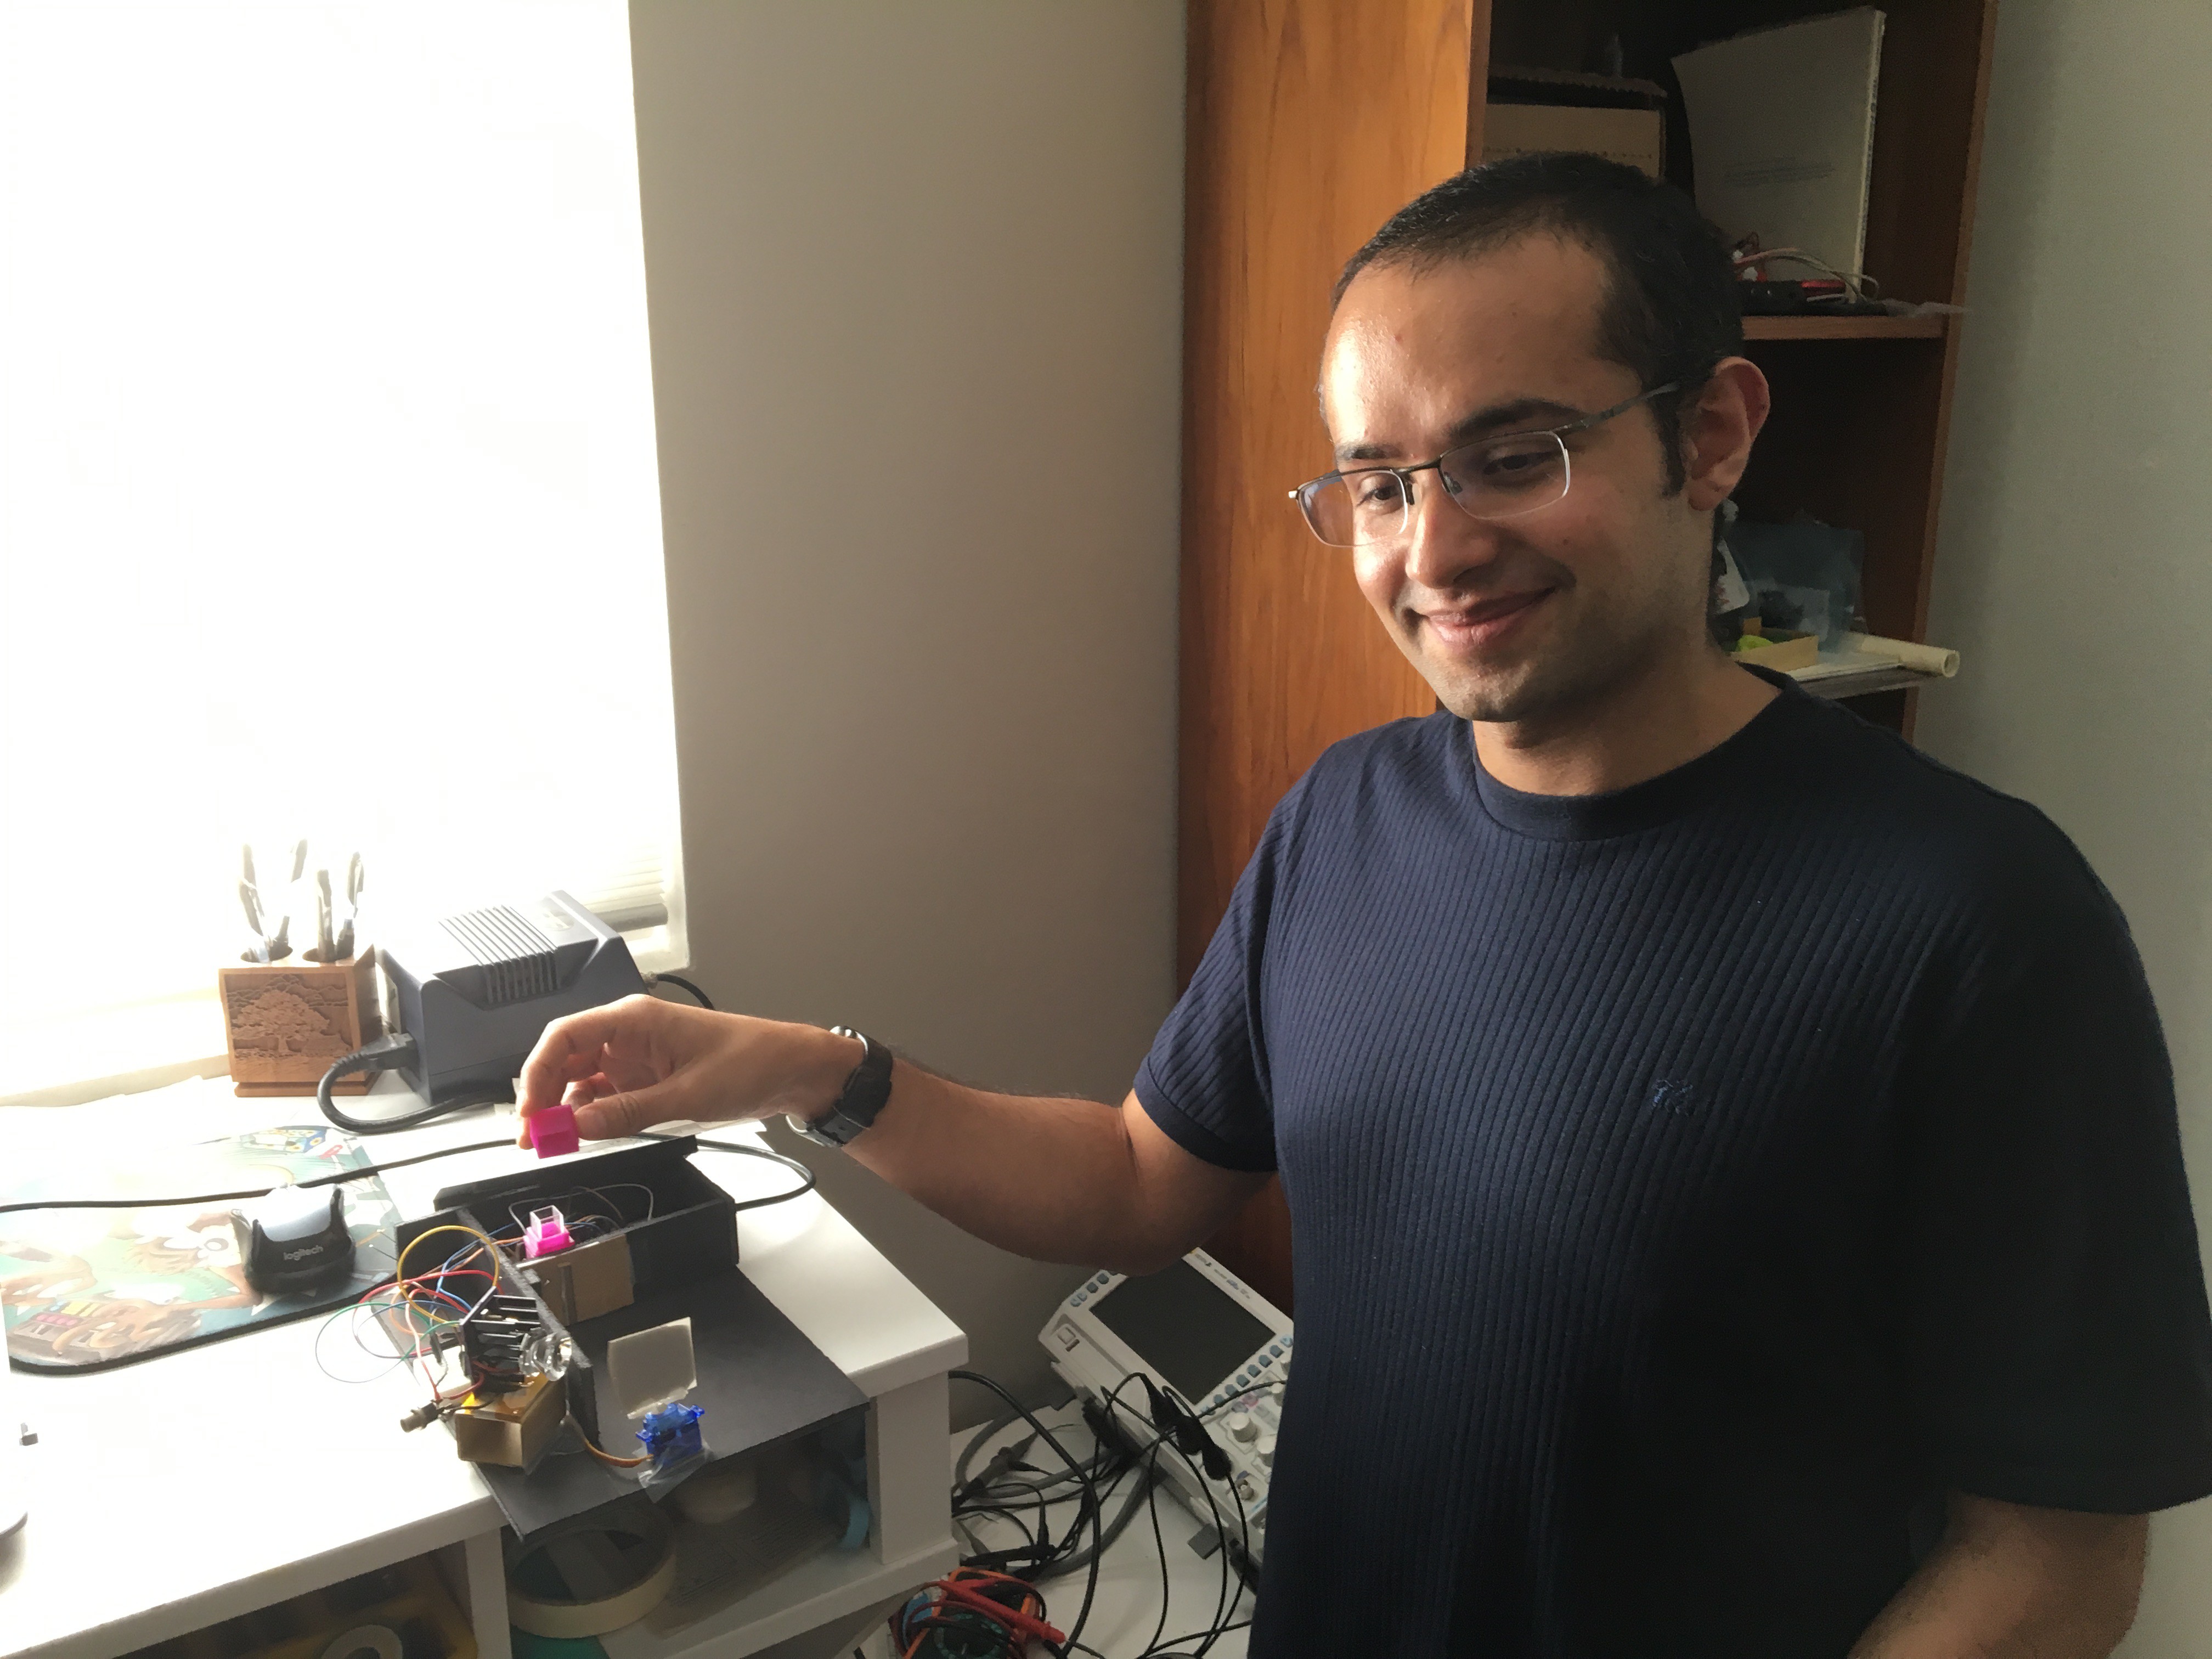
11/26/2016 at 23:19 • 0 commentsThe contributor on this project,[tucanae47], visited from Colombia. He was at the Hackaday conference in Pasadena and took a detour to visit Oceanside. How cool is that? What a terrific surprise. He got to see my multi-dollar lab and we nerded out over fish tacos at the beach. Adds a wonderful personal touch to our collaboration.
![]()
-
Lock-In Amplifier Design and Construction Details
09/12/2016 at 00:16 • 0 commentsThe Lock-in amp design is based around the ADA-2200 part. Other parts of the design provide signal conditioning of one form or another. The sensor is a photodiode, chosen (perhaps naively) for its low cost, availability, and broad light range (visible light spectrum). Since I'm experimenting and learning as I go, this seemed like a reasonable approach. The output of the photodiode feeds an AD8615 opamp configured as a current to voltage converter (transimpedance amplifier). Guarding is provided around the input to minimize noise. Note that the guard trace is tied to the common mode voltage, not to ground. The AD8615 opamp was chosen because of its very low offset voltage and low input bias current. In the configuration I'm using it has a gain of one million, but other gain values are possible with a change of the feedback resistor. Since the output of the opamp is single ended (0 to 3.3V), a TLV431B provides a 1.65V common mode voltage to center the signal. There is a footprint for a low pass filter in the path, but that hasn't been needed. The signal from the opamp is fed directly to the InP pin of the ADA2200.
The ADA2200 requires a clock signal of 10KHz. This is provided by the Teensy3.0. The ADA2200 outputs an Rclk which is used to modulate the light source. For experimenting, I routed that signal to a 74LCV1G66 FET switch. In the current implementation, this signal routes to the PWM input of the LED driver. The ADA2200 also provides a Sync0 signal to drive an A/D converter to sample the ADA2200 output (the recovered signal). The Sync0 routes to an interrupt on the Teensy3.0 so it can do the sampling. The output of the ADA2200 is on VoutP and VoutN. These outputs can be sampled as either the raw signal, or after 10Hz LP filters. I am experimenting to see which signal is the most useful.
My Lock-in Amp design includes an LED and drive circuitry for it. I intended this to be useful as an experiemental light source to stimulate the photodiode, snd it works for this. But I layed out the circuit board so that the LED could be removed. This takes a saw, but it can be removed. Indeed, the pictures of the spectrophotometer show it removed. Connectors P1 and P2 are not actually intended to be connectors (although they can be), but indicate where the Lock-In Amp and the LED circuitry can be separated. Use a hack saw to cut between these two connectors.
The Lock-In Amp is designed to stand on edge so the photodiode can look directly at a light source, so the interconnects are in a row along one edge of the board. Right-angle gold square pin headers are used to mount the Lock-In Amp on a breadboard and eventually on a circuit board.
The Teensy3.0 is used to program the ADA2200 via the SPI bus, to provide the 10KHz ClkIn signal, and to digitize the output as clocked by the SyncO signal. The software to do this has been created using the Arduino environment, so it's easy to understand and modify. The Teensy3.0, Teensy3.1, or Teensy3.2 can all be used. I used the Teensy3.0 simply because I had one and it did the job. I will make the software available on github. (TODO)
The circuit board was designed using KiCAD and fabricated by OSHPark. (TODO: add OSHPark link to order board.) The parts list, with DigiKey part numbers, is posted above. I created a solder stencil using my Silhouette Portrait and 2.5 mil Mylalr. With the stencil, I put on solder paste, placed SMT parts, and used the Reflow Chateau oven to solder it. The through hole parts and the photodiode were added later. I couldn't convince myself that the photodiode would stand up to the reflow process, so I hand-soldered it.
Future improvements:
- Make the photodiode amplifier have a selectable range of gains. Plan is easy, god lives in the details - especially guarding the input.
- The ADA2200 provides a common mode referrence signal to use to center the input (output of the opamp). I haven't tried using that.
- There is a lot to know about the ADA2200! I have only scratched the surface and can see there are many more experiments to be done to get the most out of the part.
Useful references:
Data sheets, MS-2624 from AD, Max tia app note. Photodiode. (TODO)
Signal Definitions and connector pinout:
1 ClkIn 10KHz input clock from Teensy3.0 2 Gnd Ground 3 Sync0 ADC Sample clock to Teensy3.0 4 /CS Slave Select for SPI 5 SCLK SPI Clock 6 MOSI SPI Master Out Slave In 7 RCLK_MISO Reference Clock out and SPI Master In Slave Out (SW selectable) 8 Gnd Ground 9 OutNV Inverting Output after 10Hz low pass filter 10 OutNS Inverting Output 11 OutPS Non-Inverting Output 12 OutPV Non-Inverting Output after 10Hz low pass filter 13 Gnd Ground 14 3V3 3.3V supply -
First Data Collection
08/09/2016 at 03:55 • 0 comments![]()
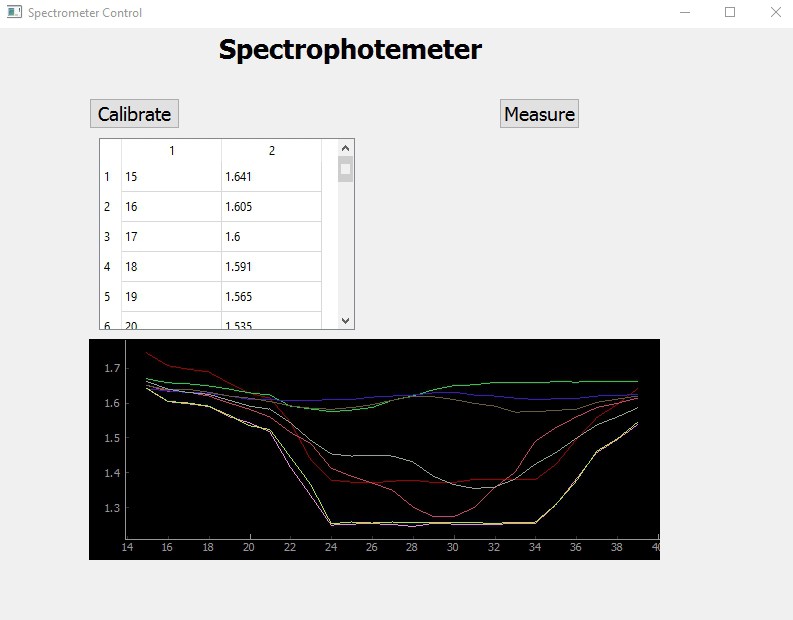
Here's the results from a bit of work with pyqt and pyqtgraph. The X axis is the angle of the diffraction grating as it sweeps the spectrum from red to blue. The Y axis is the response of the photodiode with higher values being less response.
The bottom pair of lines in the plot are the calibration runs with plain water. The red line is a run using plain water, but through the translucent sides of the cuvette and shows a reduction in transmittance, but the same shape as the calibration runs. ("Calibration" here just means "reference" since I have no method of actually calibrating the device.) The other lines are the responses to various food colorings that I happened to have, and varying concentrations.
I find these results very encouraging! Since I now believe this thing will actually work and may be very useful, I now plan to concentrate on getting the documentation into place so that others may duplicate the unit. Perhaps others may give me guidance on writing usable software for various applications.
-
Building a Control Interface
07/22/2016 at 22:06 • 0 commentsNow that the basic hardware is working, I need to be able to collect and analyze data. While I considered using a graphics panel, and may yet do that, there are a lot of unknowns to sort out first. Seems that collecting the data with my lap top will be the most flexible way to do that.
To that end, I'm developing a UI using Py-QT and pyserial. I considered using Processing because of its easy multi-platform capability, but python should fill the same role and has better tools for designing the interface. This effort will take a few weeks, I expect.
Once I can easily capture and display data, I'll develop a calibration routine and evaluate the angular motion needed to sweep the spectrum appropriately.
-
New Black Enclosure
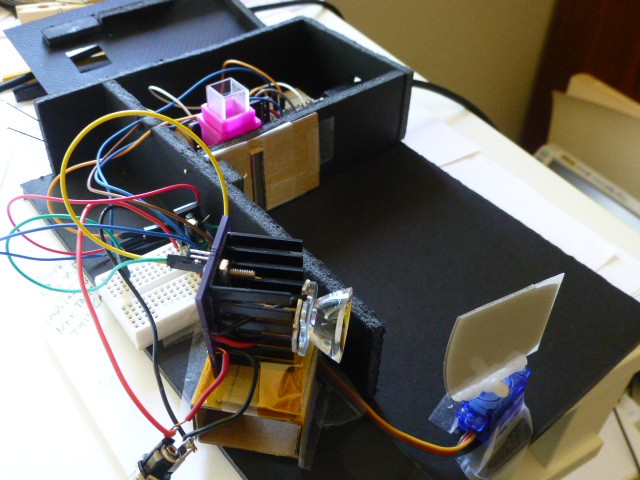
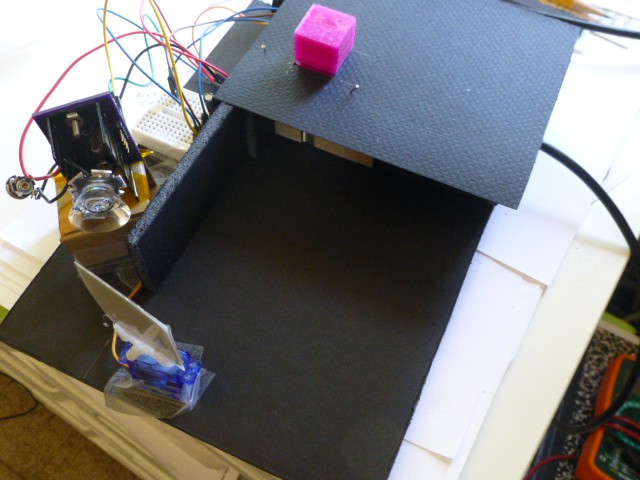
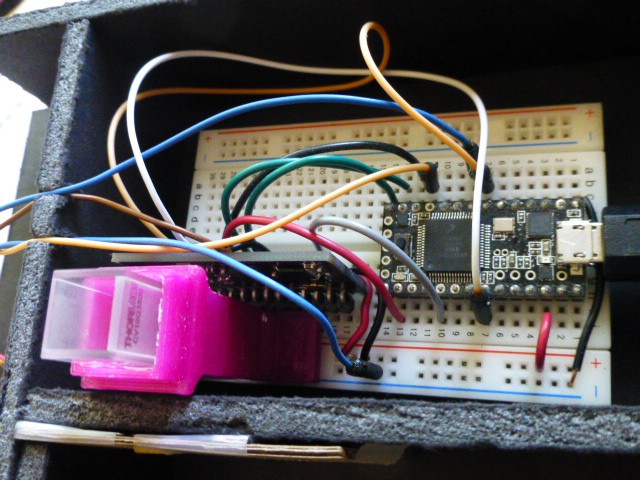
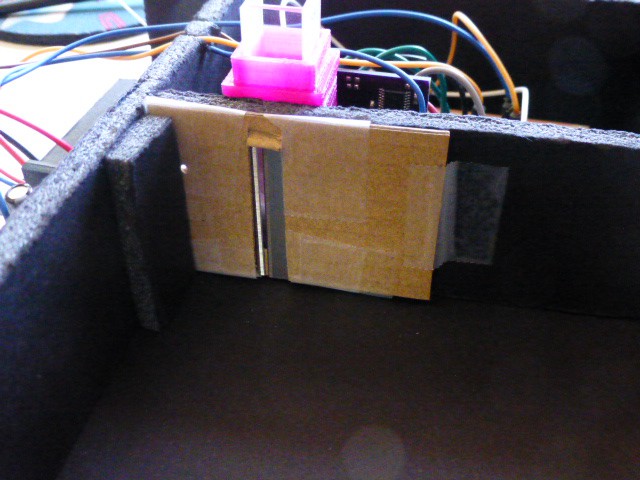
07/19/2016 at 04:01 • 0 commentsFollowing are pictures of the new enclosure, It's made of black foam core board and has a black poster board cover. The goal is to keep out extraneous LED light. While I was at it, I mounted the cuvette holder onto the breadboard right in front of the photodiode. The cover has a lip on it to block light at the seams. Eventually, I will put tape or sealer around the edges to block as much light as possible.
The cuvette holder is held in place with two-sided tape and a hole is cut in the cover for it. The lid blocks light from the LED, but could be improved if it were black.
![]()
![]()
![]()
![]()
To test the enclosure, I put the grating at 27 degrees (mostly yellow light through the slot), filled the cuvette with plain water and collected 40 points. The average value was 1.03 volts. Then I put a drop of greenish-yellow food coloring in the water (partially blocking yellow) and read 1.22 volts. Next, I tried a drop of blue food coloring (which should block yellow effectively) and read 1.60 volts. Finally, I tried clear water again and read 1.03 volts.
I find this pretty encouraging! Now I need to create a program for the pc that will sweep the LED and collect a sequence of data. Then I can try characterizing some samples.
-
Gathering Data Leads to New Structure
07/18/2016 at 04:06 • 0 commentsTime to collect some data and let it guide development! I was using the setup shown in the earlier picture, and wanted to verify that I could still get a valid signal from the Lock-In Amp. Earlier experiments with a smaller LED showed things to be working.
All the necessary functions are under control of the Teensy 3.0. The Lock-In Amp (ADA2200) needs both configuration and a clock. Configuration is done using the SPI port. The ADA2200 data sheet gives the codes for configuration. (The Arduino sketch for all of this will be attached.) The FrequencyTimer2 library is used to create a 10KHz clock.
The ADA2200 will divide the 10KHz clock by 8 to get a Sample Clock and by 64 for the Reference Clock. The Reference Clock modulates the LED driver and the Sample Clock is fed back to the Teensy to trigger A/D sampling of the signal produced by the ADA2200.
With all the signals hooked up, I tried collecting data. Nothing! The signal was at the maximum and nothing I could do would make it change!
Time to get out the scope. Checking the clocks showed them all to be as expected. Probing the signal from the Lock-In Amp showed it to be pegged as expected. But then further probing made the expected signal appear. Seemed that just touching the Lock-In Amp board made the signal appear. WTFO?! At first I suspected that the capacitance of my finger was affecting things, but further tests showed this wasn't the case. To make a long story short, I realized that when I blocked light from the LED that wasn't coming through the slit, I got better results.
And of course that makes perfect sense! Should of realized it much sooner. Any light from the LED that reaches the photodiode is sensed as signal! That's because it's modulated by the Reference Clock and measured by the Lock-In Amp as signal. That is, it's correlated noise - indistinguishable from noise. Experimenting further with a shield over the sensor showed significant improvement in getting a reasonable measurement.
Time to build a new enclosure to properly shield the sensor!
Spectrophotometer
Spectrophotometer design with a sensitive detector, bright light source and a sample holder. Easily and inexpensively built.