-
Rebuild Server to .NET Core with improvements
03/04/2017 at 06:45 • 0 commentsI am doing a major re-write of the server code for the HomePortal automation system.
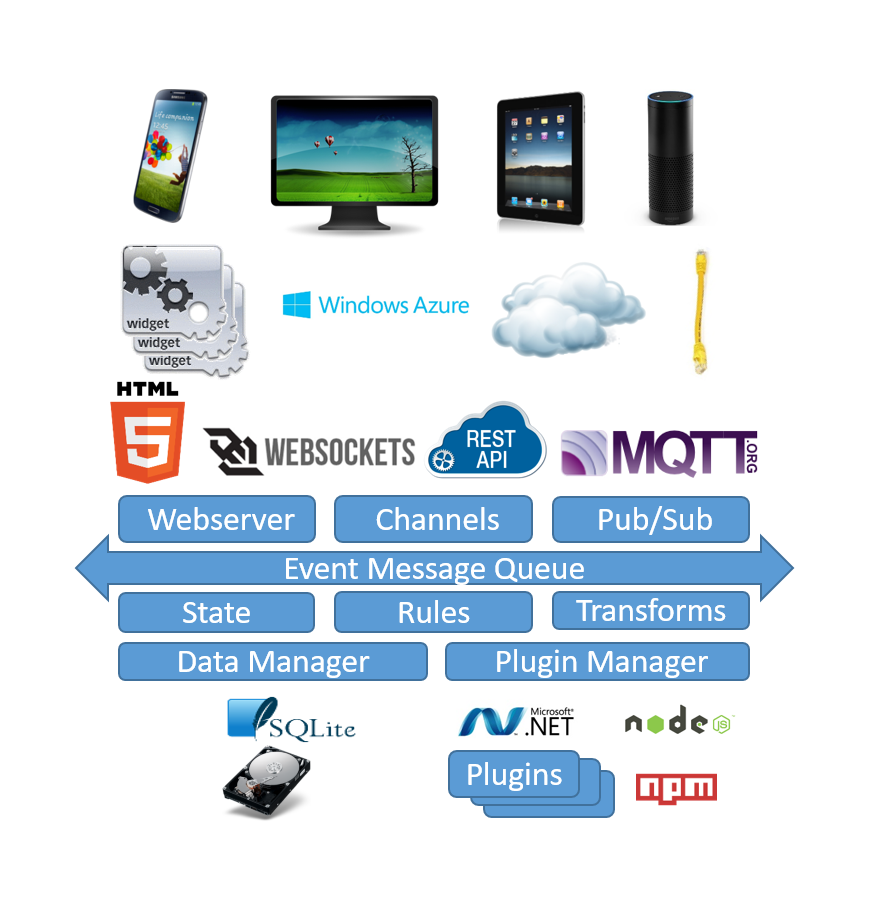
The new version will have the following (most architectural) features:
1) Written in C# instead of VB.NET. No real benefit to be gained in swapping languages except that C# is a better supported language, and as I also write in C and JavaScript it is easier to jump between languages. Although I think VB is an expressive language, I do find C# enjoyable to
2) Using the new Microsoft .NET Core open source technologies. This will make the solution truly portable across different operating systems easily and being open source makes .NET (and solutions like HomePortal) accessible to a wider audience. This will be the first (significant) .NET Core home automation system available.
3) Using modern frameworks. The VB version is around 5 years old when there wasn't frameworks like Entity Framework and logging frameworks that the new .NET Core HomePortal version is using. I expect to retire about 50% of the codebase due to this, and it will be easier to maintain, faster and more accessible to others who may want to extend the solution.
4) More consistent use of design patterns like PubSub, MVC and plugin architectures. The extensibility of the solution is significantly improved (eg. to add another plugin language like Python) by adding more features through 'Extensions' which are .NET Core DLLs that can be added to the main program and bound at runtime. It will also be possible to replace the default functionality with your own (eg. a different rules engine) by dropping in a new rules DLL.The plugins are even simpler to use, with pub/sub interfaces and are compiled at startup and the code will be editable in the client.
5) Integrated security. The VB.NET version does not have security built in, and the new Core version has a security authorization / authentication layer in the subscribe function that controls the access to channels.
6) MQTT pub/sub for browser access (still via websockets) with a simpler and more consistent implementation. REST and Sockets interfaces will remain and additional interfaces can be added via extensions as the event driven architecture is consistently accessed vis publish/subscribe.
7) Not for the initial release but the next version will have Iotivity support (for device discovery and taxonomies), voice support (Cortana skills) and AI using LUIS cognitive services and Bots.
8) Use of InfluxDB as the timeseries message store, which should speed up queries and history requests (for graphing) as well as provide additional history functionality applicable to timeseries datasets (ie. recording sensor events)
The VB.NET version has a lot of functionality to be ported, however I do think the effort will be worth it as the solution will be faster, more reliable and more extensible. I will do a proper open source launch when it is completed (ETA 2 months - I'm about 40% through the porting).
You can see the work in progress in my GitHub folders: https://github.com/deandob/HAServer
If you have any feedback or ideas about the new version, do post comments.
-
Online Demo
01/02/2017 at 04:27 • 6 commentsBeen a while since I posted an update.
The software has had numerous fixes including better compatibility for Firefox and Chrome browsers.
If you are interested in seeing a fully functional online demo system running where you can interact with preconfigured screens and also create / edit your own screens, please post a comment as I'm considering deploying the server into the Cloud if there is enough interest.
-
Architecture
08/08/2016 at 13:16 • 0 commentsA well thought out architecture and API is critical to the performance, flexibility, maintenance and extensibility of any software solution.
The general design breaks the solution into 3 main subsystems:
- Front end user interface. HTML5 / JavaScript leveraging Twitter's Bootstrap front end framework, using HTML objects to embed widgets as active and passive elements into HTML5 screens, and uses websockets to communicate to the automation engine using a topic based publish / subscribe model.
- Automation engine. This is the brains of the system using Visual Basic .NET and uses event driven messages that pass through several modules including a state store, database, rules processing and console.
- Plugin Manager. This is the integration layer that connects to the external world using Node.JS or .NET and uses a plugin design so that connection semantics to each device / service are managed in discrete JavaScript modules.
Events & Message Queue
Events are the heart of the automation engine where all events are represented as messages managed by a message queue. Being event driven enhances performance and allows use of modern design patterns like publish / subscribe and modern tools like Node.JS / JavaScript (which are inherently asynchronous) and .NET async.
The message format is critical to ensure it is rich enough to cater for all types of messages and not too big to be difficult to work with and consume space. The format chosen is topic based similar to MQTT messages, and has proven to be very durable and flexible, as follows:
<NETWORK> / <CATEGORY> / <CLASS> / <INSTANCE> / <SCOPE> / <DATA>
- Network allows partitioning of messages and segmenting of networks if implemented in a large environment with several hubs (I only use one hub so the network name is common for all messages).
- Category is the general type of message, eg. SYSTEM for system messages like timers, LIGHTING for all messages related to lights. There is an editable category list that covers all general automation and other categories.
- Class is the entity that is interacting with the automation system and generally is matched to the plugin which represents the device or service being integrated with. For example, I use CBUS as my lighting automation system so there is a CBUS message class instantiated from the CBUS plug-in that deals with the semantics of connecting with the CBUS interface (serial with an ASCII protocol).
- Instance is the interface on the class entity, and there may be many of these. In the CBUS example all the lights have a unique instance name (eg. Master-Bedroom). The interface definition is managed by the plug-in.
- Scope defines the type of message sent to/from the instance. With the CBUS example, when a light switch is toggled on the wall, the CBUS plug-in receives this message from the CBUS interface as a update and fills the scope field out as STATE_CHANGE. It also allows the instance to have several functions (eg. can be used to send commands as well as status).
- Data is the value of the message and for the CBUS example of receiving an update that someone switched the light on will have the value of 100 (100% dim level). All values are managed and stored as strings but the rules and transformation modules will recognise numbers within strings.
Scheduling is performed via the rules engine using time based triggers.
HTML5 widgets and plugins subscribe or publish to channels. Channels are bi-directional names for message class instances used with widgets and plugins. For example, a light widget would subscribe to the LIGHTING/CBUS/Master-Bedroom channel and all messages on that channel will be sent to the light widget and it can also publish messages on that channel (eg. widget can turn on the master bedroom light).
Why Microsoft .Net as the platform?The automation engine is written in Visual Basic .NET for several reasons but mostly legacy.
The code started as VB 6 in its first version back in 2003, when it was small system not unlike the average DIY home automation software (eg. hard coded, monolithic design, single interface). Although re-written and re-architected several times, there is still some of the original code present, and there was never a compelling enough reason to switch to another language or development platform. The next version will be ported to C# only because Visual Basic isn't a dominant language like it was (although I do like the expressiveness of VB) and it is easy to convert as the .NET runtime is consistent.
JavaScript / Node.JS might be an obvious language given the plug-ins and front end are written in JavaScript. However .Net is a more robust runtime, with better error handling, multi-threading and better language semantics. The message management is multi-threaded and an important part of the architecture that couldn't be implemented as well with Node.JS (Node has other advantages which I'll discuss in the project log about the plug-ins).
Why not Java so it can run on Linux? No reason except that my background is with .Net not Java and I don't see any advantages of Java as a development platform to better solve home automation use-cases. The next version of this system will be ported to .Net Core which is the Open Source implementation of DotNet just released and will run on Linux if needed. I live in the Microsoft ecosystem for my day job and prefer tools like Visual Studio and Windows, but also recognise the power of Open Source so ensured there is nothing in the design or implementation choices that would hinder running on a Linux server.
Also, popular fully featured home automation software are written using different platforms and although the high level architecture of this system isn't much different to some of the other fully featured HA software hubs, there are significant differences in the implementation. For example, widget based HTML5 front end, .NET automation engine and Node.JS for integration seems to be unique and bring advantages compared to other home automation software.
-
Automation Engine
08/08/2016 at 11:05 • 0 commentsThe automation engine uses Microsoft .NET and runs on the home hub server providing and orchestrating all the automation services for the user interfaces and plug-ins. This is the most complicated sub-system and runs the following services:
- Message management. Handles the incoming and outgoing messages via a multi-threaded message queue.
- Database management. SQLite is used as the relational data store as it has decent performance and functionality without the need to administer the database.
- State store. Maintains the state of the messages so that message state persist after the message has passed through the message queue.
- Rules module. Every message handled by the central queue is passed through the rules module where the trigger rules are compared and if matched, triggers any associated events.
- Transformation module. Transformations are similar to rule triggers except they apply calculations to the triggered message and act as virtual devices.
- Queries module. Provides the ability to store and execute queries on current and historical data.
- Console. Event logging and debug messages, displayed on the server console or remotely.
Lets have a closer look at the implementation and lessons learnt of a couple of these features not discussed in other logs.
Database and Queries
The SQLite database stores all non system messages in the database as a time-series log (time as the index) using the raw message format. Each message category (eg. Lighting) has its own SQLite file and as the database structure is simple performance is good even with categories with 10's of thousands of messages logged. Database size grows over time - for example polling the solar inverter every 6 seconds for current power generated quickly adds up even if we are only sending messages when the state changes. The relational aspect of SQLite is used for the rules module, where an automation event is associated with triggers and actions, cached in memory when the automation engine starts and edited by the settings function on the HTML5 client.
SQLite has a rich SQL syntax that means queries can be built to answer simple questions like who keeps turning lights on at 3am in the morning, or more complex ones like has the average power increased this month compared to last month. Queries can be run using the current state (from the state store) or historical (from the database) transparently and like transformations can use aggregate time-series functions like average, max and min.
Rules Module
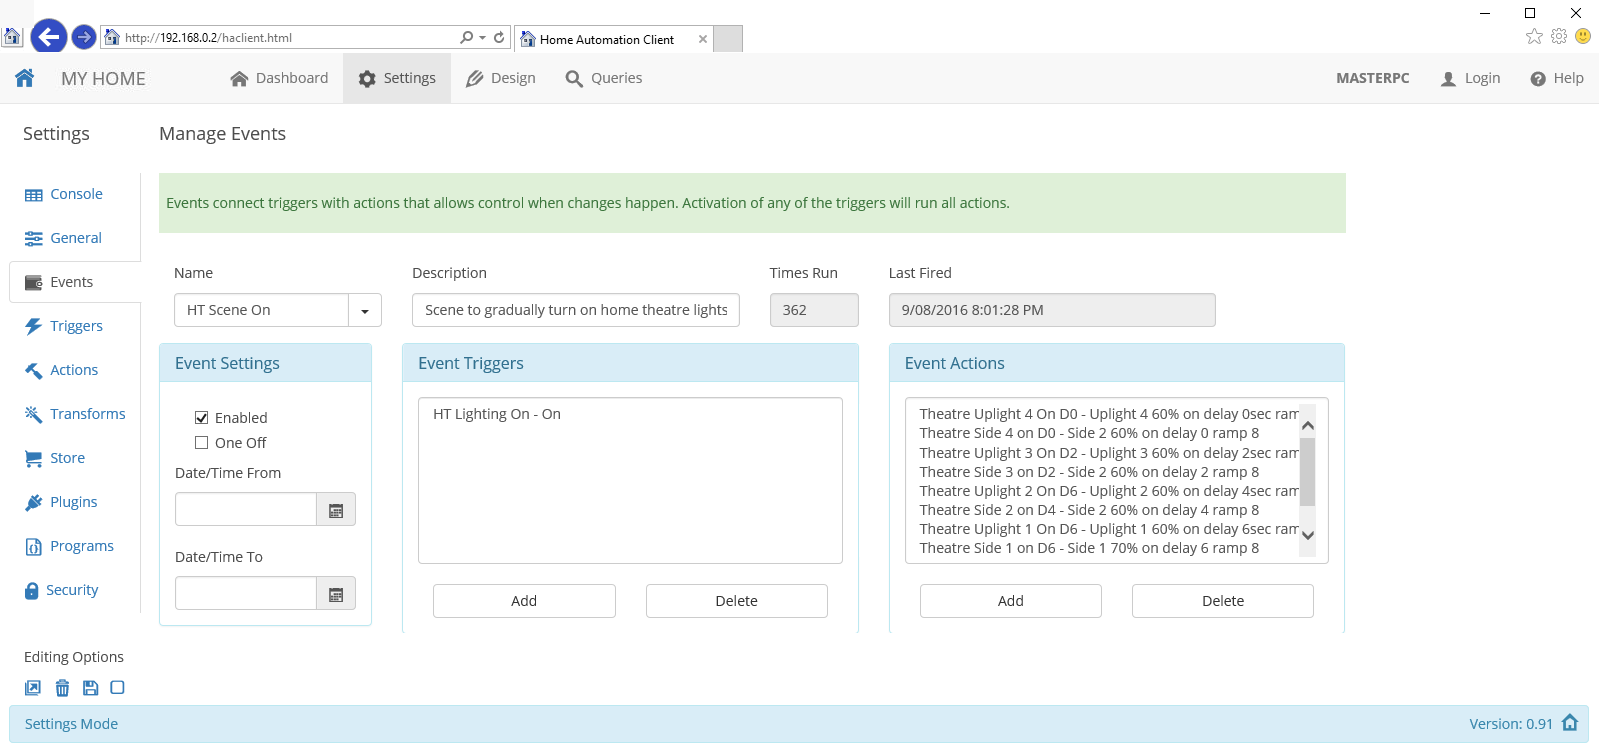
Rules are managed through events, which have associated triggers and run associated actions when fired. Below is an event screen (click for higher resolution), which automates the CBUS lights in my home theater when a CBUS light switch is pressed (triggered by the relevant light switch ON message, then runs actions to manipulate 8 banks of lights to ramp up the lights slowly from the front to the back over 15 seconds - a custom light scene),
![]()
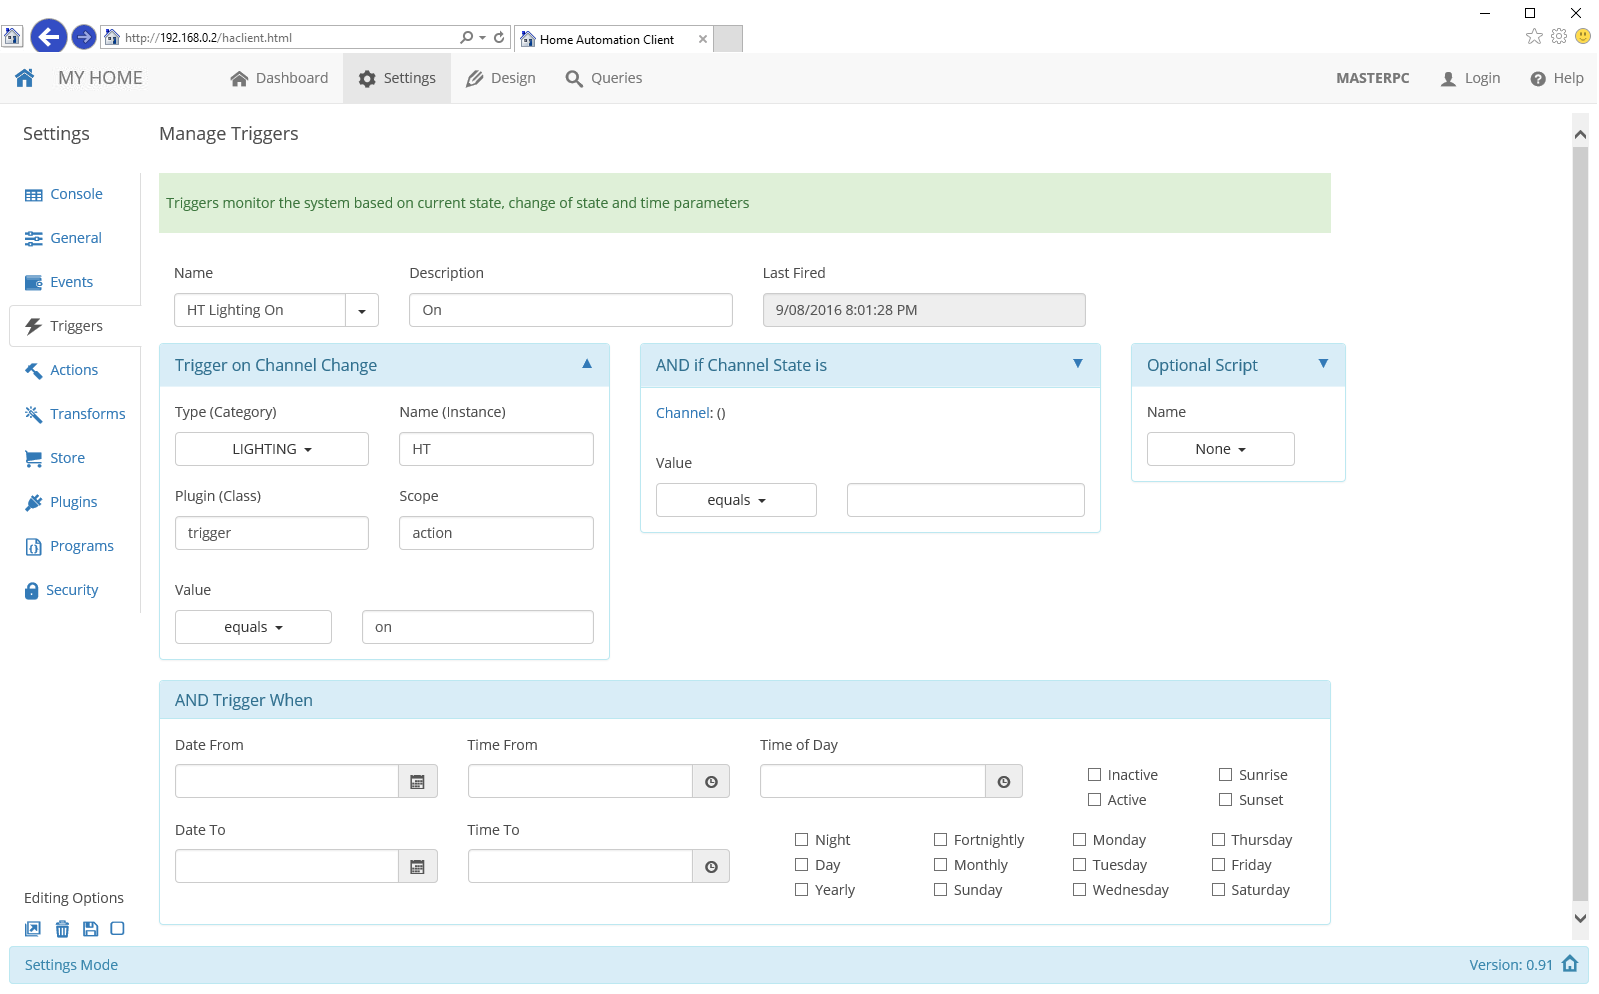
The rules module is constantly evaluating new messages for a match against a trigger. Triggers are flexible and can capture state changes as well as date / time changes (eg. sunset, specific time of day or day of week) or both together (to create AND conditions). Below is the trigger record (click for higher resolution) that is listening for the CBUS light switch that the event above uses to fire the lighting scene actions.
![]()
Events can associate with multiple triggers to create OR conditionals (activate with any of the triggers firing). Events can also have multiple actions associated with them so actions and triggers can be reused in multiple events.
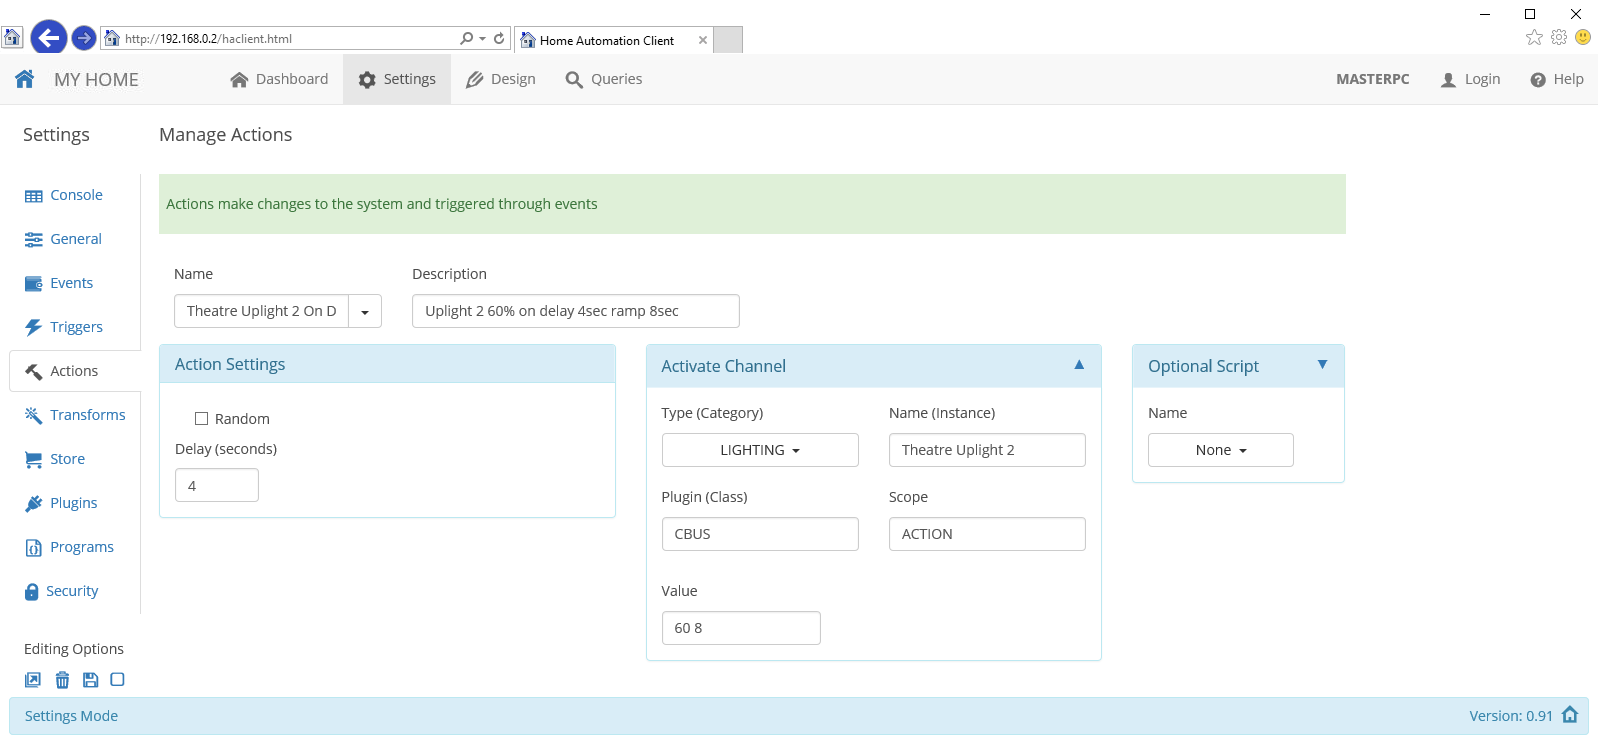
Triggers are defined by the message taxonomy and wildcards are allowed (eg. trigger on all Lighting messages). Actions either create new messages or run a script. Below is an action record that activates one of the dimmers in my home theater (click for higher resolution).
![]()
Transformation Module
Transformations are a powerful and unique feature of the automation engine. A transformation will transform raw messages from a plug-in into higher level abstractions by applying user configurable functions to generate new messages, effectively creating a 'virtual' device. While it is possible to do similar by hard coding functions into a plug-in (plug-ins can subscribe to messages as well as publish), transformations do it in a more elegant way by creating transformation rules that are simple to setup and edit. A transformation can work on current state information or can use historical data to calculate aggregate functions like sum, average, min, max over specified timeframes (eg. calculate the average power use over the last year, or the maximum temperature yesterday).
Take an example scenario of monitoring power. My home uses 3 phase power and has sensors to monitor all 3 phases. I don’t really care about the individual phase power consumption but I do want to know the total power consumption. So I configure using a transform a virtual device to be the sum of all three phases and each time the power of a phase changes, the total consumption virtual device changes real time. I can utilise the events from the virtual device the same way as real devices (eg. for history graphs or in a power meter widget). Going further with this concept – I also have solar on the roof so I can create another virtual device that uses total power events from the total power virtual device and subtracts the solar power generated so I know total power drawn or fed into the grid. The utility company will pay me 2x the peak tariff as a rebate if I feed power back into the grid, so using another transform I can calculate in real time the savings I am getting back from the utility co, or do history graphs, or create alerts on maximum power use and so on. All this through configuration not hard coding – i.e. an end user can set this up.
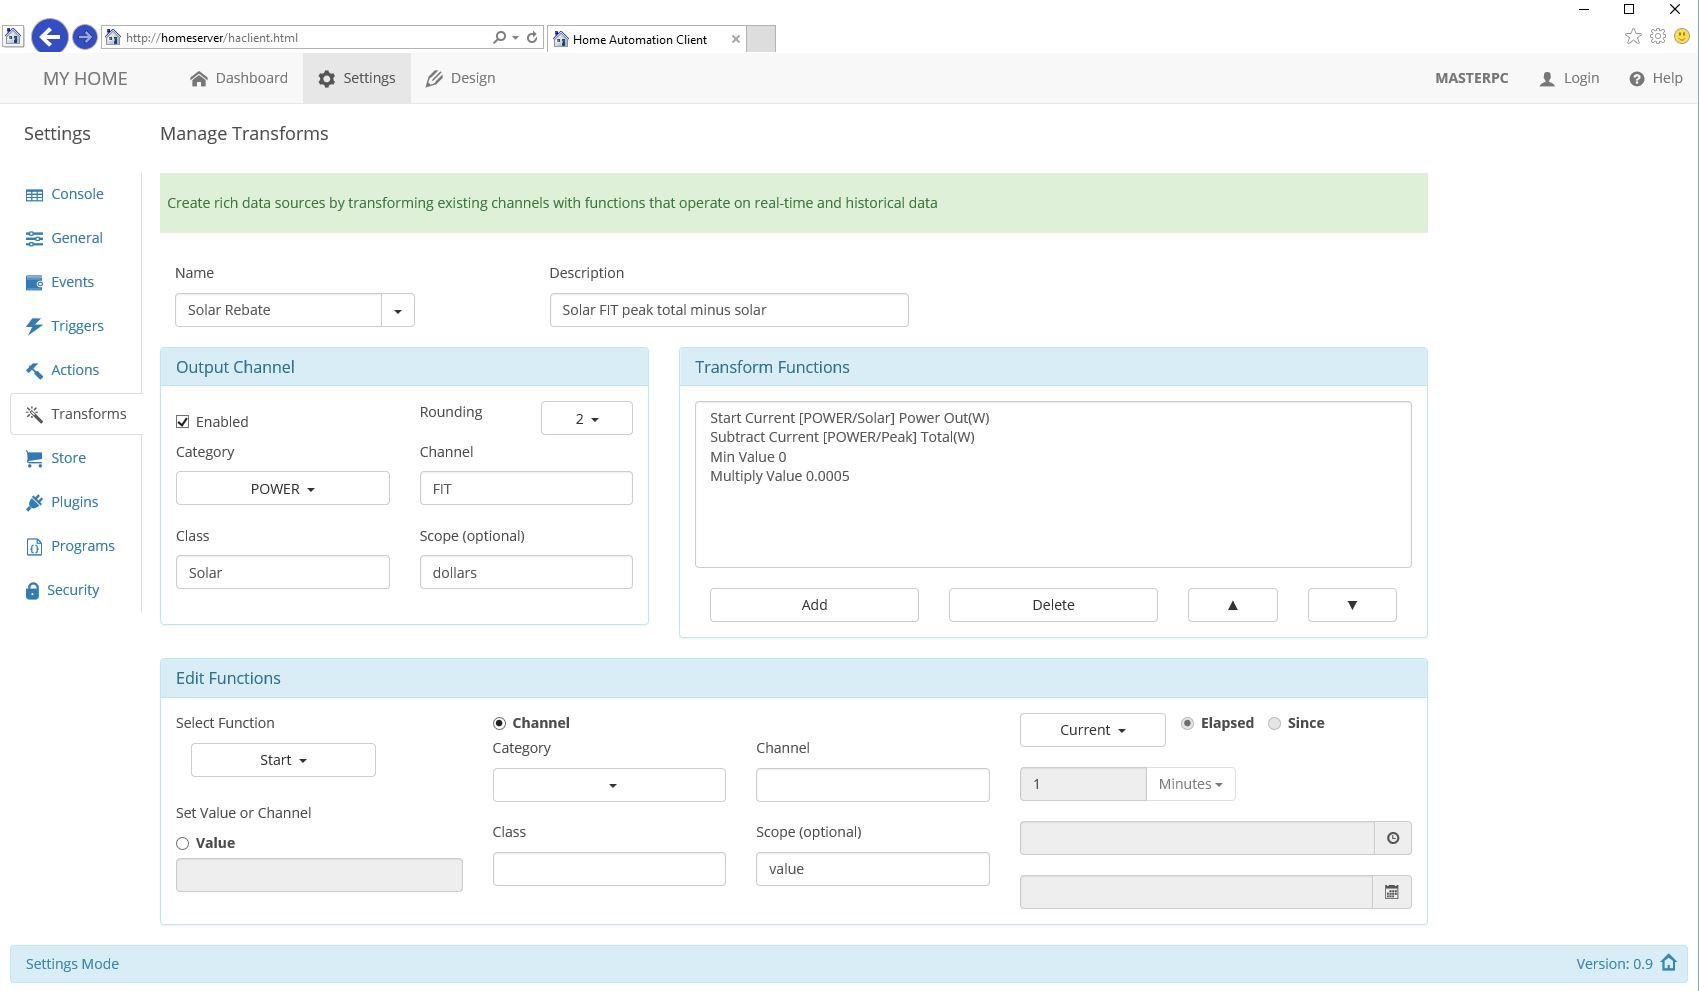
Below is the transformation settings for the solar rebate example (click for higher resolution) which is working in my system today, it creates a new real-time message based on the total power virtual device, subtract the solar power total, don't calculate a value lower than 0 (ie. I won't get money back if I'm consuming more than I'm generating) and multiply by the rebate tariff. Each line in the transform function can be edited in the bottom panel including using aggregate functions like an average value over a selected period.
Transformations have proved to be one of the most useful aspects of this system - turning raw sensor data into useful information, which in the above example has helped me maximise the payback of rebates from the electricity company by managing my energy consumption better.
-
Plug-ins
08/07/2016 at 21:59 • 0 comments![]()
Plug-ins are the glue that binds external devices and services together, monitors and controls them and converts their specific protocols to a common message format. Integration is a key aspect of a home automation system and the plug-in manager makes it all happen.
Design
A modular plugin design is critical for separating the concerns of managing the integration of the device / service with the general services of the automation engine. It also means that we can easily add and maintain the semantics of the device / service we are connecting to.
Converting the format of messages the external device / service uses to a common message format
<NETWORK> / <CATEGORY> / <CLASS> / <INSTANCE> / <SCOPE> / <DATA>
'normalises' the message so that it can be manipulated and integrated with other devices / services. See the architecture log for more description of the message format.
Plugins are isolated snippets of code the perform the following functions:
- Connect, disconnect and authenticate with the device / service
- Provide any specific protocol services needed to communicate (eg. SNMP for routers)
- Monitor the device by collecting status information and keeping relevant local state
- Control the device (if it has actuation)
- Translate the device / service message format into the standard format used by the automation engine
- Handle any error conditions and recovery with the device
- Schedule any tasks particular to the device (eg. poll for status). Any general automation task scheduling is managed by the automation engine not at the plug-in.
Plugins can be written in .NET or JavaScript and are stored in directories according to the plug-in category (eg. Lighting). The plug-in Manager has the task of loading and validating the plug-in, calling any initialisation tasks the plug-in may need and providing the mechanism to communicate between the plug-in and the automation engine via common functions.
Each plug-in has an associated settings file in the INI file format (as it is easy to read & edit) that describes the following:
- Plug-in attributes
- Specific settings required by the plug-in to connect to the device / service
- Defines the pub/sub channel semantics for other plug-ins or widgets to subscribe to.
The settings file avoids the need to hard code parameters like IP addresses so that configuration changes can be made on the fly without restarting. Plug-in settings file can be edited within the automation console.
Plug-ins are not just about devices
Just as importantly as being able to integrate with the hardware devices around the home, plug-ins are also used to connect and consume Cloud services. The weather dashboard outlined in another log is a good example of mixing local weather data from the home weather station with weather information from the Cloud. The combination of the local device data along with complementary Cloud data make for a more engaging and useful user interface.
Another example of integrating Cloud services is being able to pull in stock data from a source like Yahoo Finance. A plug-in connecting to the Cloud works the same way as connecting to a local device, but this time the inbuilt Node.JS HTTP functionality is used to connect. Once a stock feed is running, many things are possible like alerts if the price exceeds a certain range (eg. generate a SMS from a trigger), history graphs or a stock ticker widget.
Why Node.JS is well suited for Home Automation
![]()
One of the main disadvantages of writing my own automation system is that I don't get to leverage a plug-in library from existing automation packages like HomeSeer and OpenHAB. However this hasn't been a problem in practice because of the power and ecosystem of Node.JS.
Node.JS as the platform to host plug-ins has made a huge difference to the plug-in flexibility and enables quick development of even complex device / service integration. The ease of writing in JavaScript & its asynchronous nature along with the almost infinite number of NPM packages available (think libraries for those who know C) is what helps. It means custom plug-in code just concentrates on the device / service integration and the NPM imported packages and Node services handles communication and lower level services like timers reducing significantly the amount of custom coding required.
Most devices use a simple protocol to control them (eg. REST commands) and a lot of the time you are dealing with sensors (ingesting their data) rather than actuators (controlling the device) so you end up with typical plug-in code reading input and reformatting to the standard message format - quite simple and doesn't take long to write. To connect to new devices I start with a template that includes an API to interface with the automation engine.
The Javascript / Node.JS ecosystem is the most active and fastest growing in the developer world today and it gives this automation solution a huge productivity boost - I wonder why other automation packages aren't using it. As an example, say you have installed a new Internet router and you want to be able to monitor line noise and reboot automatically if line speed drops below a threshold. However this router uses SNMP to communicate so how do you do that? Pull in a SNMP module from NPM with a few clicks and your plugin is automatically SNMP enabled and a couple more lines of code to connect and read status by sending an appropriate OID (SNMP message format) to the router, receiving the results back to be sent onto the automation engine. A trigger is configured (in the automation engine) to monitor the router line speed and sends a message to the plug-in to reboot the router with a SNMP message if line speed is slow. Easy with JavaScript, Node and NPM modules!
Plug-in Example
Below is an example of a typical plug-in, it manages the connection to the house solar inverter and monitors the solar power generated in real-time via a serial connection. The serialport NPM module is used to handle communication from / to the serial port. For those who know JavaScript the code below isn't very complicated and didn't take long to write.
The startup function is called when the plug-in is loaded and it initializes the serial port using settings in the settings file. The 'fw' functions are part of the API to integrate the plug-in with the automation engine (eg. access settings, send to the host).
The setInterval function runs at regular intervals (as defined in the settings file) and polls the solar inverter via a poll message sent through the serial port.
The serialRecv function receives the data back from the inverter, does some basic message formatting, and if the value has changed it is sent to the host (via the fw.toHost API function),
"use strict";

// Read power generated by solar panel inverter
var com = require("serialport");
var serialSolar;
var CR = "\r";
var oldData = -99;

// startup function
function startup() {
    var startStatus = "OK"
    serialSolar = new com.SerialPort(fw.settings.comport, {
            baudrate: +fw.settings.baudrate,
            databits: +fw.settings.databits,
            stopbits: +fw.settings.stopbits,
            parity: fw.settings.parity,
            buffersize: 255
        }, function (err) {
        if (err) fw.log(err + ". Cannot open solar serial port, no solar generation functionality available.")
    });

    serialSolar.on("open",function() {
        fw.log("Serial port open on " + fw.settings.comport);
    });

    serialSolar.on("data", function(data) {
        serialRecv(data);
    });

    serialSolar.on("error", function(err) {
        fw.log("Serial port general error " + err);
        fw.restart(99);
    });

    setInterval(pollInv, +fw.settings.pollinterval * 1000, fw.channel0.attrib[0].value);

    return startStatus;
}

function pollInv(cmd) {
    serialSolar.write(new Buffer(cmd + fw.settings.cmdchar + CR), function (err) {
        if (err) {
            fw.log("Serial write error: " + err);
            fw.restart(99);
        }
    })
}

function serialRecv(data) {
        if (data.length > 0) {
            var generated = parseInt(data.toString().split(CR)[0]);
            if (generated < fw.settings.changetol) generated = 0;                        // ignore any spurious watts generated at night
            if (Math.abs(generated - oldData) >= fw.settings.changetol) {
                fw.toHost("Power Out", "W", generated);
                oldData = generated;
            }
    }
}

// Shutdown the plugin
exports.shutPlugin = function shutPlugin(param) {
    //Insert any orderly shutdown code needed here
    return "OK";
}
Plug-in settings fileThe plug-in INI file describes the attributes and settings for the plugin. In the solar inverter example, the file keeps the serial port settings, poll interval, protocol command strings and sets up a message channel called Power Out that sends power data messages as integers between the range of 0 and 10,000 with watts as units. Each channel can have an array of additional attributes as required (here it describes the command to retrieve total power generated).
[PluginCfg] Desc = Read power generated by solar panel inverter Enabled = true [General] ComPort = COM3 BaudRate = 9600 StopBits = 1 DataBits = 8 Parity = none pollInterval = 6 CmdChar = ? ; Dont broadcast any change less than ChangeTol = 10 ; Define the channel characteristics [channel0] Name = Power Out Desc = Current power generation Type = integer IO = output Min = 0 Max = 5000 Units = watts [channel0.attrib0] Name = Power Cmd Type = Command Value = PIN -
User Interfaces
08/07/2016 at 07:32 • 0 comments![]()
The user interface is an often overlooked but highly important aspect of a home automation system. A lot of experimentation and effort has gone into the user interface for the system I'm describing here as it evolved over the years. Initially implemented in Visual Basic Forms which was limited to simple display and control, the next version used Microsoft Silverlight which allowed a more functional interface including animation.
When Microsoft ditched Silverlight I had to re-think the interface again. A native app would have been an easy option but I chose HTML5 which at the time was looking promising and has now evolved to a rich platform for web interfaces and widely implemented now.
Web Interface
The browser is the main interface to the system via a webserver on the hub (an integrated Node.JS Express webserver) which serves up a HTML5 / JavaScript rich client that communicates with the hub server over websockets. The main page displays the header and footer and handles core services like security, navigation tabs and network. JQuery and Twitter Bootstrap libraries are used to make the coding easier. This design pattern is a proven approach for a SPA (single page application) but popular SPA JavaScript frameworks like AngularJS aren't used here as they would complicate things - this system should be considered a framework for home automation as it has an opinionated implementation tuned specifically for home automation use-cases.
What is unique is the use of HTML5 objects to represent all the entities inside a dashboard iframe, there is nothing hard coded, the user picks widgets from a toolbox and drags them to wherever on the screen, resizing if needed and setting attributes via a right-click menu or typing on the widget itself (eg. click on a widget's text and start typing to edit). These widgets can be simple drawing objects like a line or a panel, or richly functional widgets like a graph or lightbulb graphic that subscribes or publishes messages to and from the hub. It is a 'design surface' and works similar to Inkscape or Microsoft Powerpoint giving the user full flexibility about how they want the screen to look. The widgets are fully compliant HTML, CSS and JavaScript leveraging the full power of HTML5 (like SVG for vector graphics) so widgets can look as simple or as complex as you want them to be, including animation.
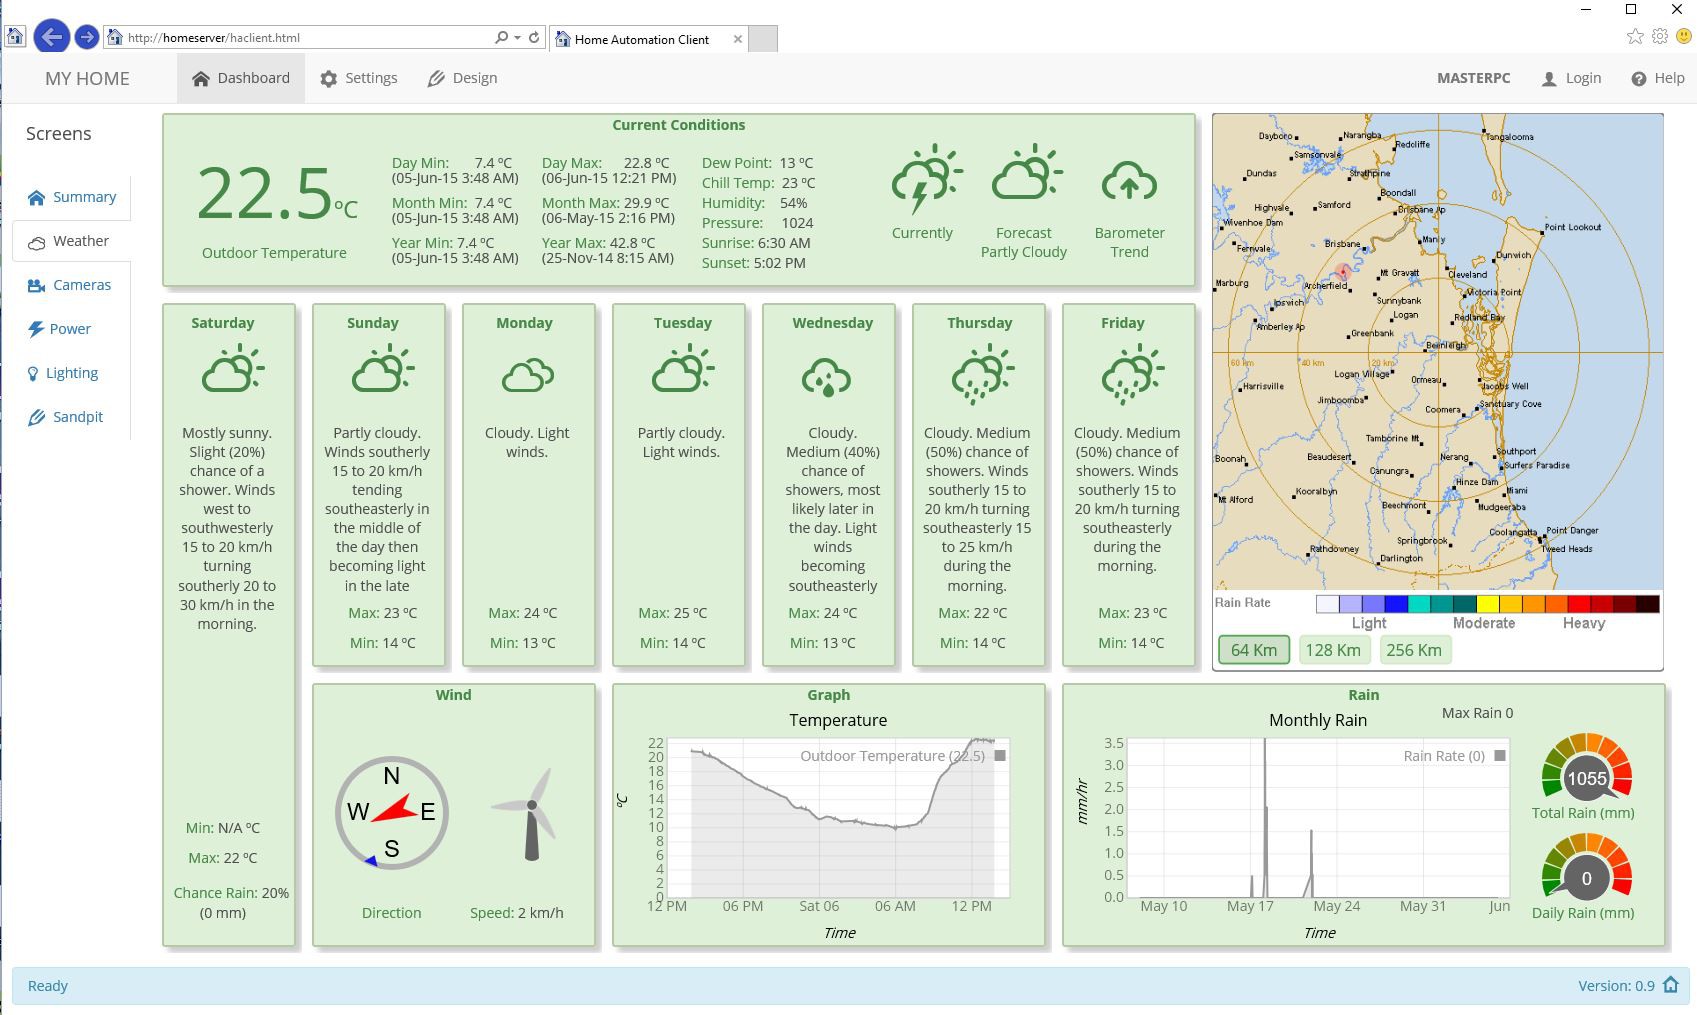
Above is an example of one of the dashboard screens (click to see it in higher resolution). This is the weather tab and it combines feeds from the home weather station (temperature, wind direction and speed, rain and humidity), as well as services from the cloud (the local Bureau of Meteorology 5 day forecast and rain radar), day, month and year highs and lows calculated real time by the transformation module and graphs with data provided by the history (database) module.
The graph widget is particularly interesting as it uses the excellent D3 JavaScript library and the user on a touchscreen can swipe left or right to scroll through history, or pinch to expand the view for more detail. There is also subtle use of animation - the weather radar is a moving slideshow of rain over the last hour, the needle on the dial and compass mimics an analog meter (accelerating from start to final position with some overshoot), the graph line is animated and the windmill rotates proportional to wind speed.
By combining information from different sources with a layout that is sympathetic to the information presented, as well as rich graphics and animation all makes for an intuitive and compelling page. Nothing on this screen except for the header / footer is hard coded - it is all user configured and can be easily re-arranged if needed.
Designing and Configuring Screens
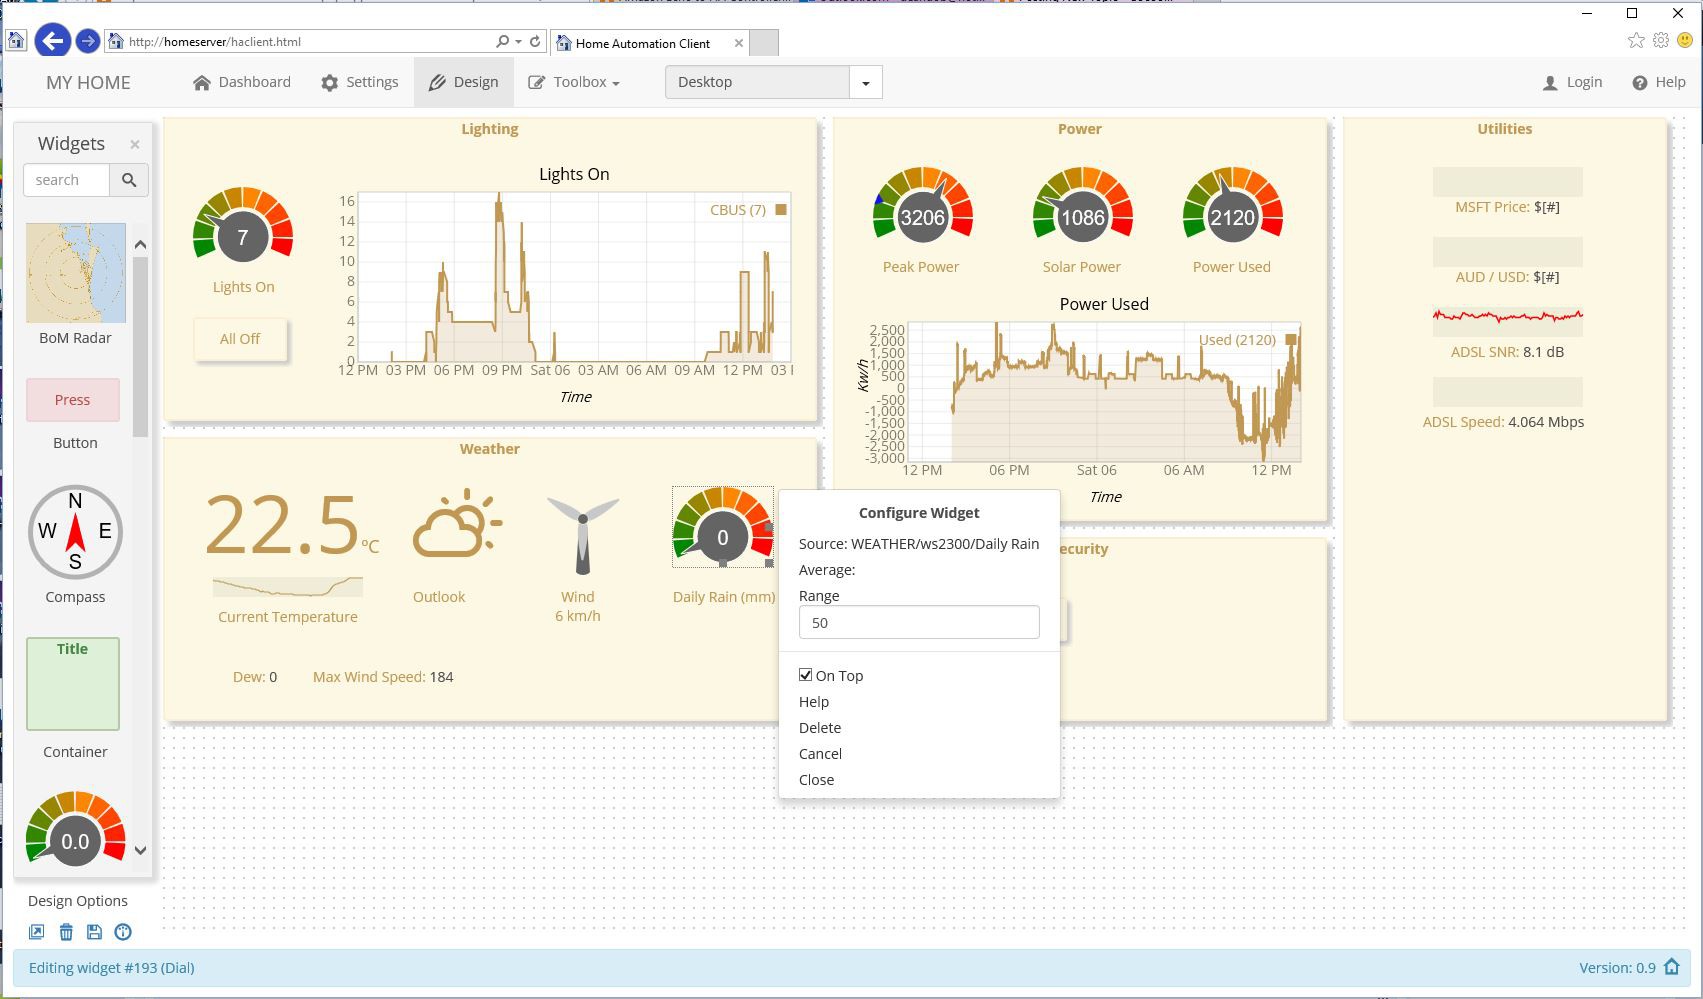
Above is another dashboard screen in design mode for editing (click for higher resolution). On the left you can see the widget toolbox that the user can scroll or search for a widget, drag it onto the design surface and place it or resize it as needed with a mouse (drag the resize blocks on the widget outline). Right click a widget and the widget configuration menu pops up for editing widget attributes as seen with the dial in the center of the screen, with standard attributes like tooltip message if hovering or display on top (if overlapping another widget), as well as widget specific attributes in this case to subscribe to a channel for the dial value and the value range to display.
Widgets
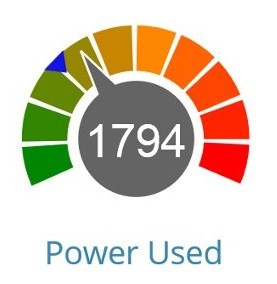
Lets dive deeper into these widgets by taking a closer look at the dial widget as an example of moderate complexity. This dial has 2 indicators, the main needle and a secondary (blue) indicator on the outside of the colored graduations.
Widgets are standalone HTML5 files written in standard HTML, CSS and JavaScript with a little boilerplate HTML and JavaScript. You drop the HTML file into the widget directory (or use the integrated editor available in the settings panel to edit) and it will appear in the toolbox for use.
Below is the HTML code for dial widget.
<!DOCTYPE html>
<html lang="en">
<head>
    <title>Dial Widget</title>
</head>
<body id="body">
    <style>
        body {
            overflow: hidden;
        }
    </style>

    <span id="TBtooltip" data-default="Displays current and average channel values"  />
    <span id="attrib0" data-type="channel" data-name="Source" data-default="" />
    <span id="attrib1" data-type="channel" data-name="Average" data-default="" />
    <span id="attrib2" data-type="input" data-name="Range" data-default="100" />
    <span id="ontop" data-default="true" />

    <div id="group">
        <svg id="widget" width="100" height="80" style="position: absolute; left: 0px; top: 0px; z-index:4">
            <style type="text/css">
                text {
                    font-family: "Helvetica Neue", Arial, Helvetica, sans-serif;
                    font-weight: normal;
                    font-style: normal;
                    font-size: 20px;
                    text-align: center;
                    pointer-events: none;
                }
            </style>

            <g id="svgGroup" style="position: absolute; left: 0px; top: 0px;">
                <g id=" noScale">
                </g>
                <g id="scale">
                    <path id="seg1" fill="none" stroke="rgb(0, 134, 0)" d="M13.46,66.27 A40,40,0,0,1,10.1,52.79" stroke-width="20" />
                    <path id="seg2" fill="none" stroke="rgb(50, 134, 0)" d="M10.01,50.7 A40,40,0,0,1,12.18,36.98" stroke-width="20" />
                    <path id="seg3" fill="none" stroke="rgb(100, 134, 0)" d="M12.91,35.02 A40,40,0,0,1,20.27,23.23" stroke-width="20" />
                    <path id="seg4" fill="none" stroke="rgb(150, 134, 0)" d="M21.72,21.72 A40,40,0,0,1,33.1,13.75" stroke-width="20" />
                    <path id="seg5" fill="none" stroke="rgb(200, 134, 0)" d="M35.02,12.91 A40,40,0,0,1,48.6,10.02" stroke-width="20" />
                    <path id="seg6" fill="none" stroke="rgb(255, 134, 0)" d="M50.7,10.01 A40,40,0,0,1,64.33,12.66" stroke-width="20" />
                    <path id="seg7" fill="none" stroke="rgb(255, 100, 0)" d="M66.27,13.46 A40,40,0,0,1,77.79,21.23" stroke-width="20" />
                    <path id="seg8" fill="none" stroke="rgb(255, 70, 0)" d="M79.25,22.72 A40,40,0,0,1,86.82,34.37" stroke-width="20" />
                    <path id="seg9" fill="none" stroke="rgb(255, 35, 0)" d="M87.59,36.32 A40,40,0,0,1,90,50" stroke-width="20" />
                    <path id="seg10" fill="none" stroke="rgb(255, 0, 0)" d="M89.95,52.09 A40,40,0,0,1,86.82,65.63" stroke-width="20" />
                    <polyline id="avg" points="44,0 56,0 50,8 44,0" fill="rgb(20, 20, 230)" stroke-width="0" style="display: none" transform="rotate(-112, 50, 50)"><title id="avgtool">Average: 0</title></polyline>
                    <path id="TBNeedle" fill="rgb(100, 100, 100)" stroke="rgb(255, 255, 255)" stroke-width="1" d="M24.39,54.51 A26,26,0,1,1,27.6,63 l-20,4 Z" />
                    <text id="TBNumVal" x="36" y="58" fill="rgb(255, 255, 255)">0.0</text>
                </g>
            </g>
        </svg>
        <svg id="needle" style="position: absolute; left: 0px; top: 0px; transform-Origin: 50% 62.5%; z-index:2">
            <path id="svgNeedle" fill="rgb(100, 100, 100)" stroke="rgb(255, 255, 255)" stroke-width="1" d="M24.39,54.51 A26,26,0,1,1,27.6,63 l-20,4 Z" />
        </svg>
        <svg id="text" style="position: absolute; left: 0px; top: 0px; z-index: 3">
            <text id="numVal" x="36" y="58" fill="rgb(255, 255, 255)">0.0</text>
        </svg>
    </div>

    <script src="../widgetFramework.js"></script>
</body>
</html>
The <span> tags are not exposed in the user interface and are used to describe the widget semantics to the dashboard framework and settings edited through the right click widget edit menu.- The first span holds the text for the tooltip popup when a mouse hovers over the widget in the toolbox in design mode (displaying the tooltip is handled automatically by the dashboard).
- The second and the third spans describe the two automation channels that this widget subscribes to - the channel that the dial needle responds to, and a secondary indicator that spins around the edge of the dial to represent an average value.
- The last two span descriptors are settings for the dial range (eg. 0 - 100 for scaling the dial value over the swing range of the needle) and if the widget should be in the foreground or background when rendered (eg. a container widget should be in the background).
The dashboard framework will expose these settings when you right click the widget when in design mode using an attribute menu, and the menu behavior is defined by the 'data-type' (eg. a channel list so that the user can select a channel which are subscription / publish feeds from the server, or an input to prompt the user to enter a value). These settings are stored on the server and the dashboard framework will customise the widget based on these settings when loading at startup.
The rest of the HTML is embedded SVG which is a vector graphics language used by modern browsers to draw sophisticated shapes.
- The first section describes the font for the number display in the middle of the dial.
- The second bit with the <path> tags draws the outer colored segments of the dial, the inner needle, outer secondary indicator and center.
Any vector graphics drawing app can be used to draw the widget shape (eg. Google's svg-Edit) then you simply copy the SVG code into the widget HTML. I like SVG as you can create visually pleasing and sophisticated widgets and they scale nicely if the user adjusts the widget size, but you could also use the HTML5 canvas commands for simpler graphics without the added complexity of SVG.
The final script tag brings in some of the common dashboard framework functionality and makes it easy for the widget to communicate with the framework through a separate javascript file that all widgets share.
Here is the widget JavaScript (not shown in the HTML above).
        var needleID = document.getElementById("needle");		    // id of the path to rotate
        var svgNeedle = document.getElementById("svgNeedle");		// id of the path to rotate
        var numID = document.getElementById("numVal");		        // id text field
        var svgText = document.getElementById("text");		        // id of text SVG
        var avgID = document.getElementById("avg");                 // id average marker
        var oldVal = 0;

        // Called from framework when widget starts
        function widgetStart(param) {                               // widget specific startup
            range = parseInt(_attribs[2].value);
            if (_attribs[1].value !== "") avgID.style.setProperty("display", "inline");
            // Hide the svg used to display the widget in the toolbox for proper drag/drop (can only drag id=widget SVG element) & put dial face in background
            document.getElementById("TBNeedle").style.setProperty("display", "none");
            document.getElementById("TBNumVal").style.setProperty("display", "none");
            _widgetID.style.setProperty("z-index", "1");
            return true;
        }

        function startDesign() {            // called when switching to design mode
        }

        function endDesign() {            // called when switching to design mode
        }

        function startEdit() {              // called when editing started
        }

        function endEdit(param0) {                                  // called when editing finishes
            if (_attribs[1].value !== "") avgID.style.setProperty("display", "inline")
            else avgID.style.setProperty("display", "none")                             // Only display average marker if channel is set
        }

        function scale(scaleX, scaleY) {    // manage scaling
            numID.setAttribute("transform", "scale(" + scaleX + "," + scaleY + ")");
            svgText.setAttribute("transform", "scale(" + scaleX + "," + scaleY + ")");
            svgNeedle.setAttribute("transform", "scale(" + scaleX + "," + scaleY + ")");    // scale needle
        }

        // Called from framework for incoming channel events
        function feed(channel, scope, data) {
            var numeric = parseFloat(data);
            if (isNaN(numeric)) return;
            if (channel === _attribs[0].value.split("/")[2]) return rotateDial(numeric);
            if (channel === _attribs[1].value.split("/")[2]) return setAvg(numeric);
        }

        // Called from framework for initial channel status
        function ini(channel, scope, data) {
            return feed(channel, scope, data);
        }

        // Set the average indicator
        function setAvg(avgVal) {
            document.getElementById("avgtool").textContent = "Average: " + avgVal;
            if (avgVal > range * 1.05) avgVal = range * 1.05;                       // allow a little overrun
            if (avgVal < range * -0.05) avgVal = range * -0.05;                     // allow a little underrun
            var angle = parseInt(avgVal * 227 / range - 114);
            avgID.setAttribute('transform', 'rotate(' + angle.toString() + ' 50 50)');
        }

        // Rotate dial between old and new
        function rotateDial(newVal) {
            var textVal = newVal;
            var newVal = Math.abs(newVal);
            if (newVal > range * 1.05) newVal = range * 1.05;                       // allow a little overrun
            if (newVal < range * -0.05) newVal = range * -0.05;                     // allow a little underrun
            if (range > 10) {                                                       // format displayed range
                numID.textContent = Math.round(textVal);
            } else {
                numID.textContent = Math.round(textVal * 10) / 10;
            }
            numID.setAttribute("x", (document.getElementById("widget").clientWidth / 2 - numID.getBBox().width / 2));       // Adjust number to be center
            needleID.style.setProperty('transition', 'transform ' + Math.abs(newVal - oldVal) * 2 / range + 's cubic-bezier(0.680, -0.550, 0.265, 1.550)');
            needleID.style.setProperty('transform', 'rotate(' + newVal * 223 / range + 'deg)');
            oldVal = newVal;
        }
Lets go over these functions and describe their use.- The 'widgetStart' function is called by the framework when the widget is first loaded into the dashboard and all the initialization code goes here. The _attribs[] array data is provided by the dashboard framework and stores this widget instance's setting (eg. if there is no secondary channel set when the widget was setup during design mode, it won't display the secondary value indicator).
- The empty functions below the widgetStart function are optional and will be called when the dashboard enters or exits design mode, and when starting or finishing editing the widget properties in the designer. This allows the widget to do different things during design time and can be very useful for more sophisticated widgets (eg. add more design time functionality in addition to the standard design features all widgets inherit from the framework). In this example, if the secondary channel isn't set, the secondary indicator marker on the dial is hidden, a small but nice touch possible with only needing a line of code.
- The 'scale' function handles how you scale the widget HTML/SVG entities when the user edits a widget and uses the mouse on one of the scale 'handles' to expand or contract the widget size. The framework will automatically scale simple widgets but sometimes you need the scaling logic to be different which you can implement in this function. Here a CSS transform function is used on the needle and text.
- The 'feed' function is called by the framework when there is an event that the widget has subscribed to. Here we direct the incoming message depending if it is for the primary channel (attrib0 - the needle) or the secondary channel (attrib1 - the secondary blue indicator).
- The 'ini' function is called once loaded to provide the initial data. The automation framework maintains state of all events so when the browser first launches the framework sends the current channel state to the widget via this function. So it is similar to the feed function (that receives all real-time events) but is separate as you may want to do some initial work on the state data. Here we don't care, so we call the feed function to display the initial value
- The next two functions are specific to the dial widget, and animate the needle and secondary indicator. Here we take advantage of CSS3 functionality by using a nice Bezier curve to vary the acceleration rate of the needle so it feels like a real dial needle - it accelerates quickly from 0, and if the dial has to swing a long way on the dial it will overshoot the mark a bit and smoothly return to the true setting.
The above may look a little daunting at first glance but anyone who can do basic web development can tackle this - it isn't that much code to create a graphical, functional and animated widget as most of the heavy lifting is done by the dashboard framework behind the scenes or HTML5 functionality. All with standard HTML/CSS/JavaScript so anything you can do in HTML5 can be used in a widget, enabling you to utilize the full power of the web ecosystem for the dashboard.
Remote Access
Being able to access the automation system when away from home is a fundamental feature. Instead of having to punch a hole in the home internet router firewall it uses a web service in the Cloud (Microsoft Azure in this case) to act as the remote web server and to accept and proxy the websockets call back to the home hub server. The hub server calls out to the Cloud web service to setup a permanent websockets channel between the home hub and the Cloud.
This approach has a number of advantages:
- No need to setup complex firewall rules on the internet router, which can be troublesome or insecure
- HTML files that run the dashboard including widgets are available in the Cloud making for faster performance, especially if your home has a slower internet connection.
- The Cloud Service can act as a gateway for integrating with other Cloud Services, like the Alexa voice service.
GitHub repository sync is used to keep the files in sync between the home hub and the Azure web service.
Security is also important as you don't want unauthorized access to the house information or even worse control of devices like the front gate. Better security is on the to-do list, currently I use a simple password and rely on obscurity. Security will be based on device token authentication which also caches username, once a device is authenticated it will reuse the token so that you don't always have to logon to access the system which would be annoying, although it assumes the authenticated devices are secure.
Mobile
Being able to access the home automation system on a smartphone is a common requirement. I spent some time investigating the best way to have a mobile interface as rich as the one developed for the web. Should I use a mobile framework like Xamarin or build a native app? What about making it 'responsive' (adjusting for the small form factor) by replacing Bootstrap with a UI library that was designed for mobile? I wasn't keen on doing too much development specifically for mobile and especially to support multiple mobile platforms.
Then I realised that all the effort that went into the flexibility of the desktop / tablet interface was just as appropriate (if not more so) for smartphones. No need for a native app with offline ability as you need to be connected to the web to get to the home automation system anyway, and a well written HTML5 web app will be as responsive and functional as a native app and work on any mobile platform. All I had to do to optimize for smartphone use was have the dashboard recognize the smaller screen size and use dashboard screens setup for mobile (exactly the same as a desktop dashboard screen except the screen width is smaller), and even the Bootstrap functions like the navbars being responsive switched automatically to suit the smaller screen width. Even the dashboard design functionality works on the smartphone however a desktop is better due to speed and better control of the UI.
As all the front end code is written in standard JavaScript without the overheads of a framework like AngularJS performance on the phone is good. The remote access infrastructure outlined in the section above is used by the mobile browser the same way as the desktop / tablet browser.
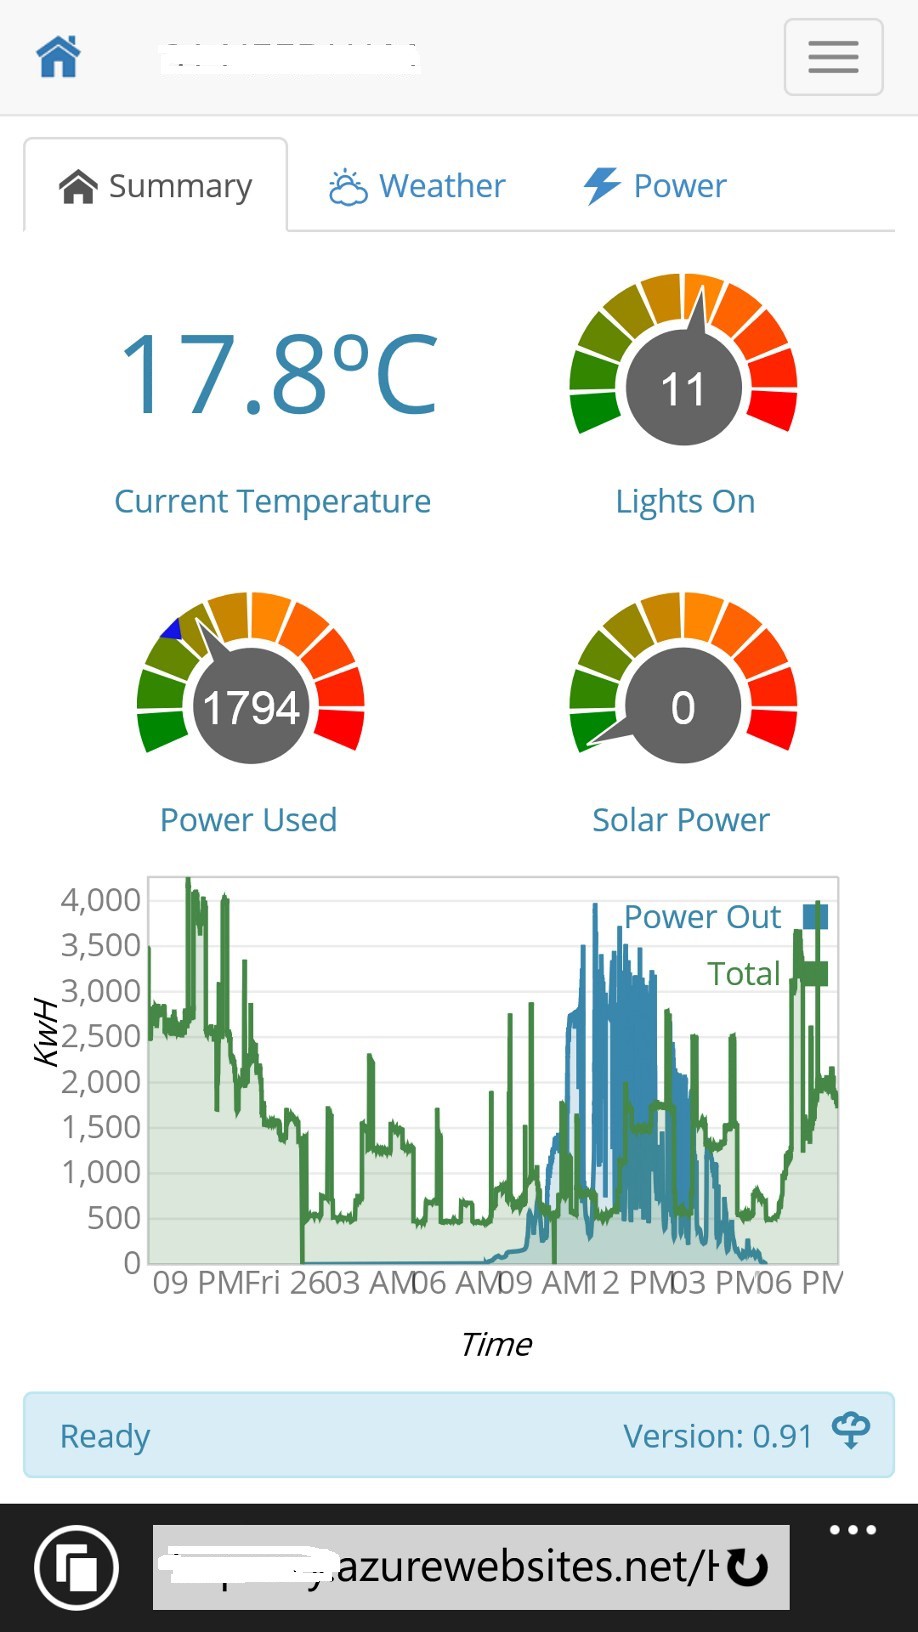
Below is a picture of a mobile screen (fully user configurable just like the desktop browser screens), the graph is showing the day history of power use (green) and solar power generated (blue - it was a cloudy day).
![]()
Conversational InterfaceVoice is the most natural way for us to interact with others, and clearly is going to be the future when you see concepts like Iron Man's Jarvis. That future is almost here (the voice recognition and synthesis at least) as the quality of voice recognition in the last 5 years has jumped significantly with services like Siri, Cortana and Alexa. I have an Amazon Echo and am constantly amazed at how well it understands me, even from afar, the error rate is very low. I don't think that Cloud Services are a good fit for the automation engine but the sheer compute power of the Cloud is perfect to improve the quality of voice recognition and it shows. Even the latency is pretty good but there is still an (acceptable) pause.
My Alexa connects to the home hub via Microsoft Azure Web Services used for remote access which converts the speech strings into the home automation message format. At this point it is pretty basic (your sentence needs to be structured so that the class and instance message fields can be translated - although synonyms help). This is just the start and I intend to continue experimenting and expanding the interface so that it moves past voice control / command recognition to a proper conversational interface, using services like Microsoft's CRIS.
The Room as the Interface
The last part of the vision for the user interface is using the room as the user interface. This part of the solution has had several prototypes but not in full time use yet. The concept is to have a 'mini hub' in each room that orchestrates the activities in the room, as follows:
- Audio amplifier to power in-room speakers for music and voice synthesis
- Motion sensors and proximity sensors
- Security sensors like window open sensors
- Microphone for speech recognition
- Camera for a video intercom
- Small touchscreen
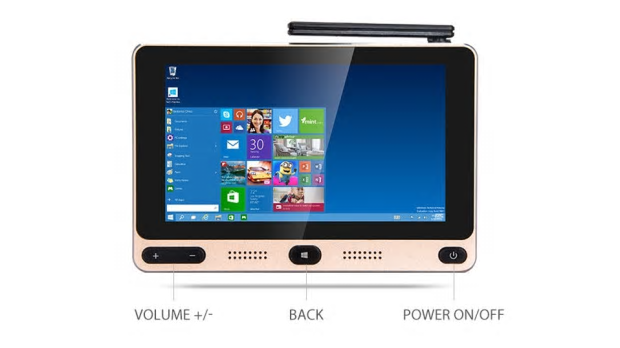
A Raspberry Pi could fill this function and I have been prototyping the intercom and have PCB designs ready for the audio amplifier and Power over Ethernet (see my other hackaday projects here and here). The prototype I have in mind is the size of a light switch with a 5" LCD touchscreen, mounted next to the light switches and uses the same HTML5 dashboard but with screens designed for the form factor (similar to the smartphone screens). The LCD touchscreen driver is what is in development at the moment. Another interesting alternative is a small form factor PC running Windows 10 (full not the IoT version) with an integrated capacitive touchscreen that I have on order (GOLE1 for $79).
![]()
Summary
This approach to the user interface has meant that I can address many of the key points outlined earlier for a successful home automation system - user personalisation, integration and transformation of raw data to create useful information, infinite layout possibilities, available via multiple channels like voice, mobile through the use of very rich and functional display entities (widgets). The web interface is expressive, easy and fun to use - it has been interesting seeing how my kids and wife knock up their own screens with their interpretation of how they want to manage the house.
HomePortal
Home Automation software hub that unifies home sensors and cloud services with a flexible and easy to use browser interface
