-
Time and Energy and Cost Potential
07/14/2018 at 21:20 • 0 commentsThis is the biggest one yet to this energy reclamation method: how valuable is it?!
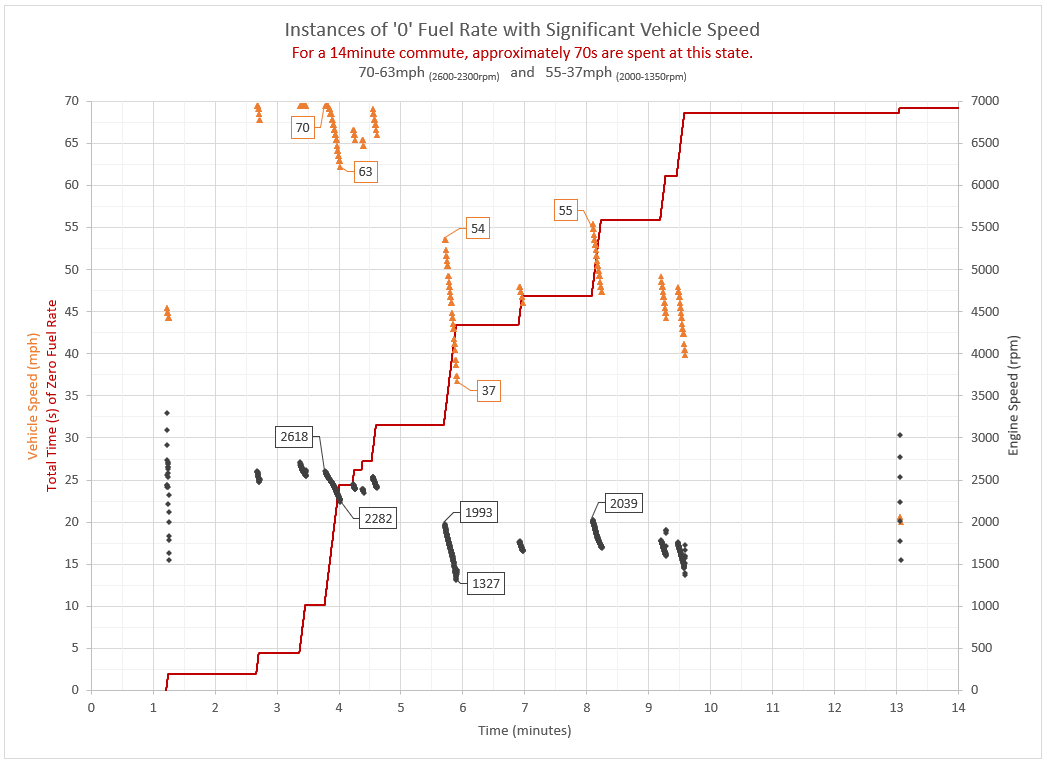
I recorded data from a typical commute ( approximately 14 minutes) with speed limits ranging to 70mph. Next, I wrote a small filter in MS Excel to only show me the instances where the vehicle had speed (>0mph) and also reported '0' fuel consumption. Here it is:
And here's what it means:
TL;DR - 8% of my commute time is spent coasting to stop or turn.
At times when I was coasting from a higher speed to a lower speed (orange triangles in the plot), the engine speed is clearly tied to the vehicle speed - probably indicating that the transmission (torque converter?) is directly connecting the engine to the wheels. As shown, there are times when a complete coast does not result in the duration of the acceleration being useful for energy reclamation (although the specific fuel rates during these times are similar to idle conditions). As I left my A/C and Fan ON for this entire trip, the AC's load (as discussed previously) is significant. Meaning - a system that loads up the alternator to recover electrons does seem feasible.
Here's the problem, though:
I don't know how much energy my A/C is used. I need to know this to accurately correlate an A/C load to and electrical charging load.
SO.... let's do some online research.
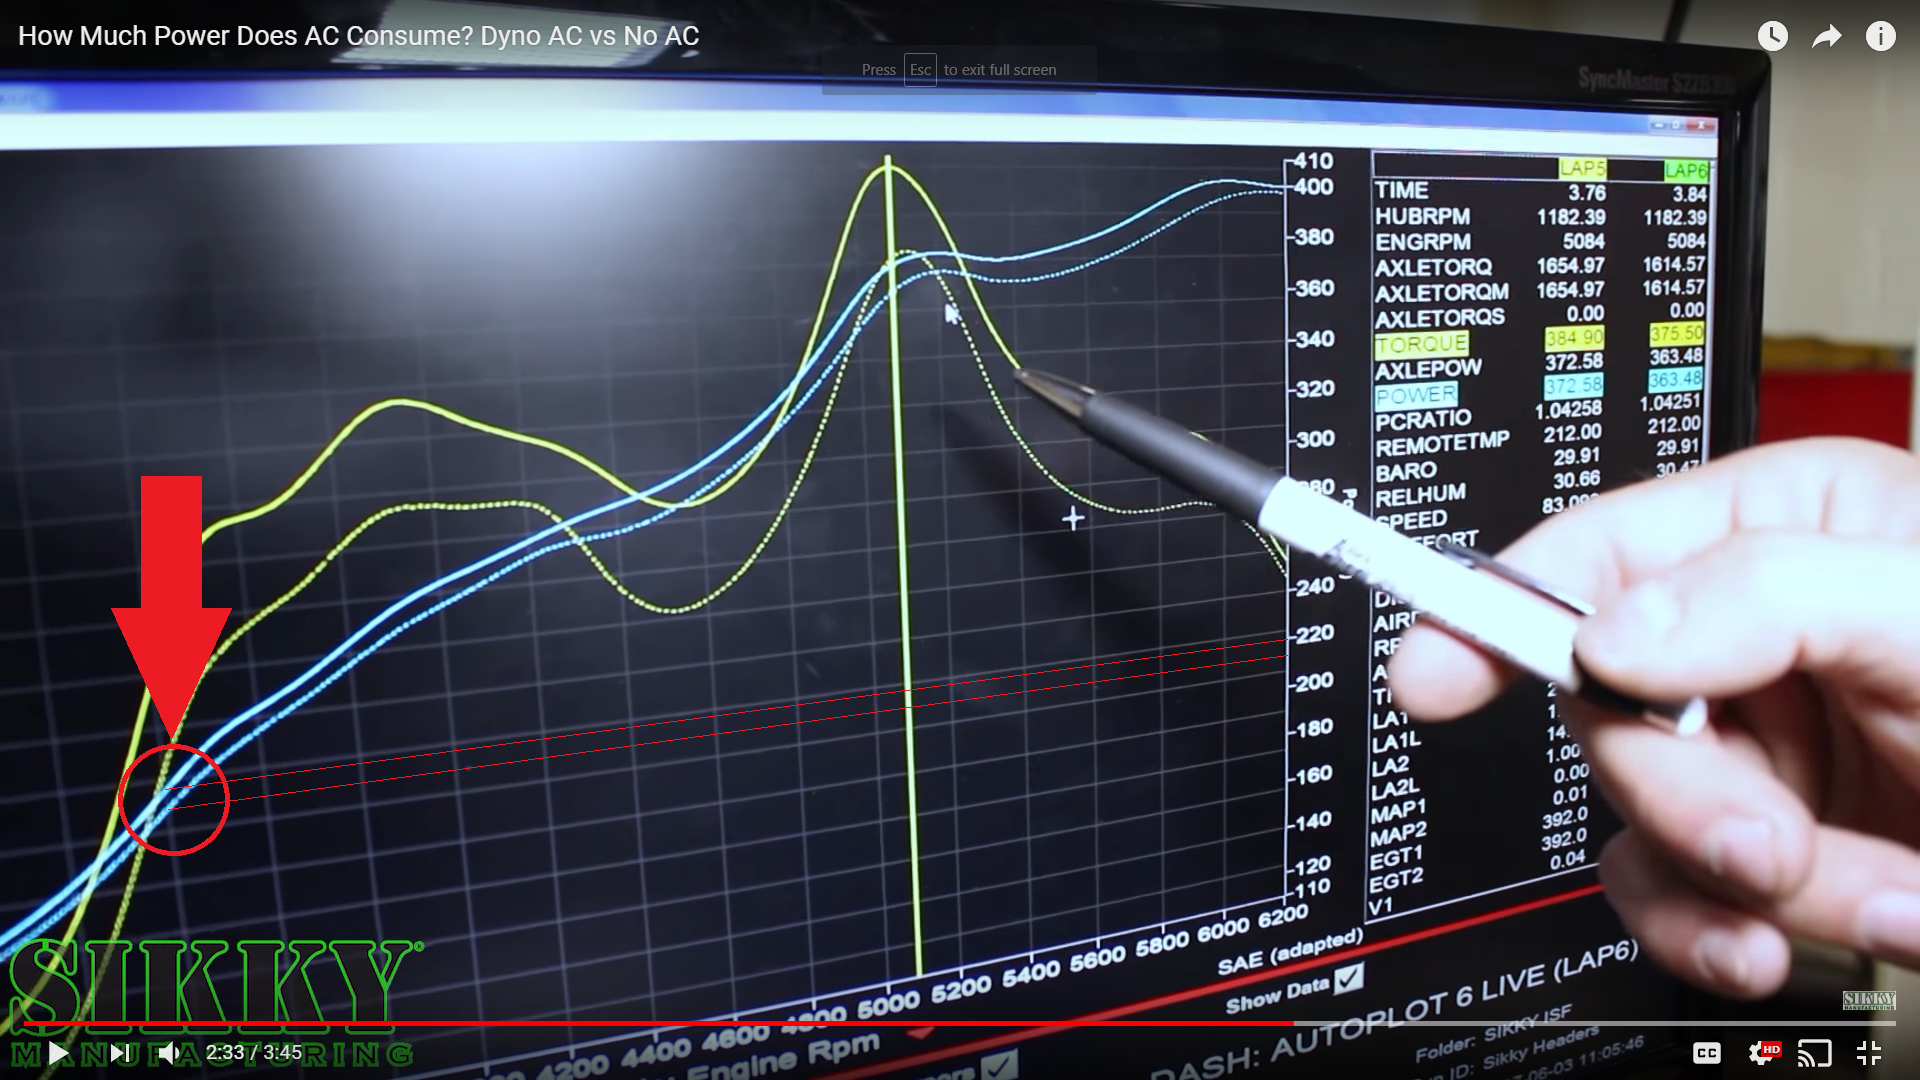
The guys over at Sikky Manufacturing reported around 10HP of loss while the engine was under load.
![]()
Canada's Government estimates 1-2L of additional fuel use per 100km driven. If we take the low number and assume that's while driving at 100km/hr that means 1L/hour. Dangerously extrapolating this to my vehicle (Rav4, averaging 25mpg in the summer) means about 0.26gallons, driving at 62mph, for an hour. The guys over at ecomodder.com use the conversion that 1 gallon (US) is approximately 33 kWh.
Taking this all back together: 8% of my commute time could be energy recovering; my one-way commute (rounded up) is 0.25 hours. Therefore, 8% of 25% of 33kWh = 0.66kWh which is approximately 2,376kJ of energy. If this was to be evenly collected over 70 seconds: ~34kJ/s = 3.4kW = 4.5HP. Coincidentally, if I had used the higher 2L/hour metric it works out to be the same as what Sikky Manufacturing was estimateing around 10HP.
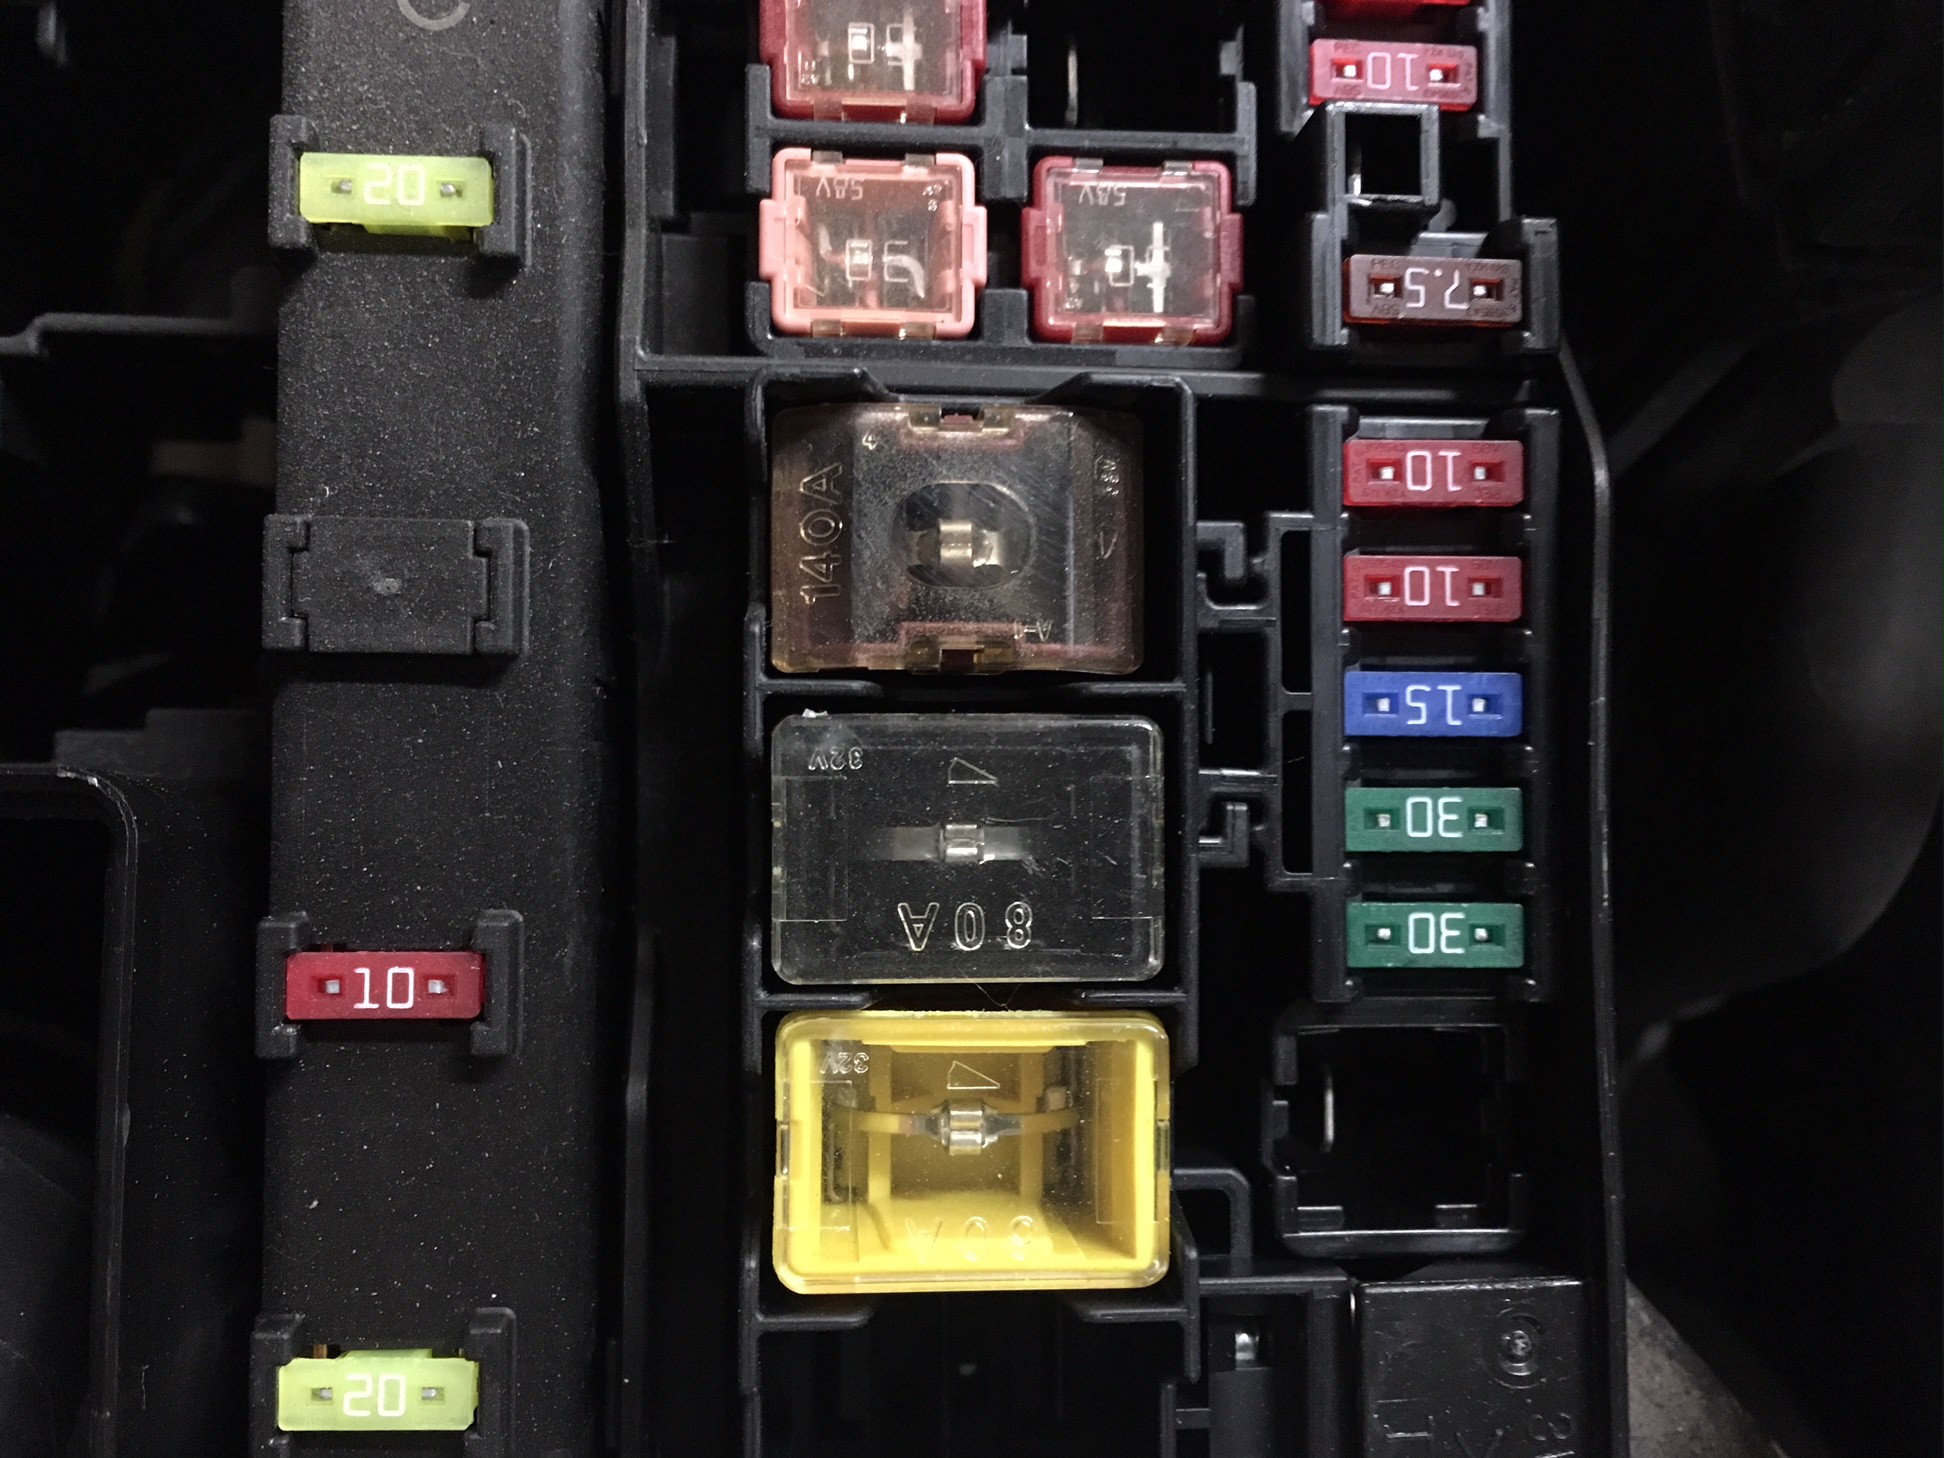
What rate can I actually reclaim energy at? Here's the main alternator fuse on my vehicle:
![]()
It's clearly rated to 140A. Let's say I COULD pull 140A at 12VDC under these situations: 140x12= 1.6kW rate. This is about half the rate of energy seemingly available.
Never the less, 70 seconds at 1.6kW at, say, 90% DC-DC efficiency charging a LiPo battery is 0.28kWh (280Wh). That's the equivalent of completely charging this Greenworks 4.0Ah battery up during a morning commute [if it could actually charge at that rate ] !!
![]()
(image courtesy of Amazon.com)
Finally, let's convert that 0.28kWh to my equivalent residential mains electricity cost:
1kWh = $0.135
0.28kWh = $0.04/commute savings! = 1 free McDonalds Coffee nearly every month.
(p.s. - someone can check my math, if they'd like)
-
Free Energy, it exists and I found it!
07/14/2018 at 03:44 • 0 commentsWell - sort of. It's not free: I already paid for it in conversion, I'm just donating it to the atmosphere as heat in braking (if not recovered). But I was able to identify the specific condition in which fuel consumption is minimized (reportedly to zero) and yet I was enjoying the nice benefit of full Air Conditioning when it was 95F outside.
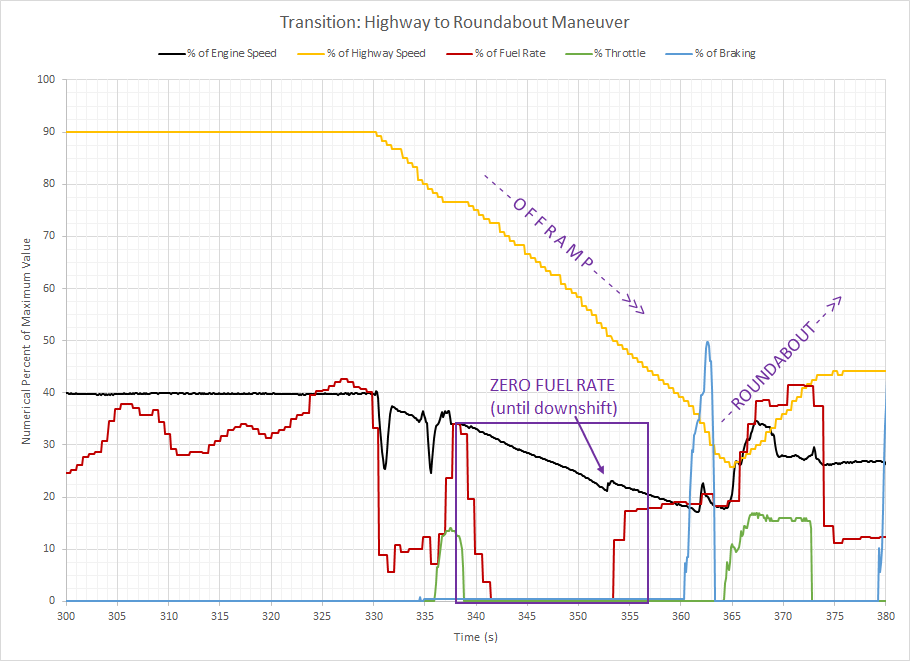
How? - As suspected, during the transition from a higher speed (highway) to a lower speed (offramp into a roundabout), there is a short but clear segment of time in which there was no reported fuel consumption use. In practicality, I can assume the fuel injectors are still firing away, but the amount of fuel must be incredibly low....OR Toyota is lying to me over the CANbus.
Take a look at the plot below (analysis, too):
![]()
Analytical walk-through:
The area in concern is within the purple box in the plot above. Here we see the vehicle speed decreasing (from highway speed) on the offramp. From 341 to 353s (12 seconds total) there is zero reported fuel consumption. As mentioned previously, I had the Air Conditioner ON and the Blower Fan at maximum (which should suggest the highest temperature differential meaning a higher auxiliary load). While 12 seconds of energy recover doesn't sound like much - for someone who does a significant amount of back-country road driving, this could easily add upto minutes for a daily commute. Another interesting point is that at which the transmission downshifts (assumingly out of over-drive, being a 5-spd automatic). From here forward, fuel is clearly being consumed. I'm curious - If I had shifted from 'D' to '4' and forced the engine into a typical engine-brake scenario, what would the fuel consumption look like? Performing this operation would most certainly increase engine speed, which may increase alternator or A/C loads.
Next task(s):
A. Identify average fuel consumption rates (FCR) throughout an example commute.
B. Correlate the avg. FCR to the stationary testing benchmark to the zero fuel rate time (with A/C on).
Future task: experiment with the shift-out during a coasting operation.
-
What effects does the A/C have on fuel consumption?
07/14/2018 at 03:10 • 0 commentsThis is a pretty obvious one - we all know A/C will harm fuel economy. But - what if there are select circumstances where the A/C is 'free', as it's power input from the engine is much less than the engine's current output state.? Specifically - I am referencing coasting to a stop or to make a turn. This becomes a little more complicated in an automatic transmission, as the engine is not always directly coupled through the transmission to the wheels (ie. torque converter). On a manual transmission vehicle, this would be easy to test. Nevertheless, having only an automatic vehicle, perhaps it will still be possible.
Having already connected to the vehicle's CANbus, it is simple to perform repeatable experiments and look at the [engine's] output response.
Test Procedure Overview:
1. Bring vehicle to normal operating conditions and document:
>> I drove the vehicle home from work (~25minues); outside temperature was 95F;
2. Place the vehicle in Park. At a controlled rate, apply an auxiliary load against the engine with the following components: Headlights, Interior Fan, Air Conditioner (enable button).
3. Measure the engine's speed and reported fuel consumption rate.
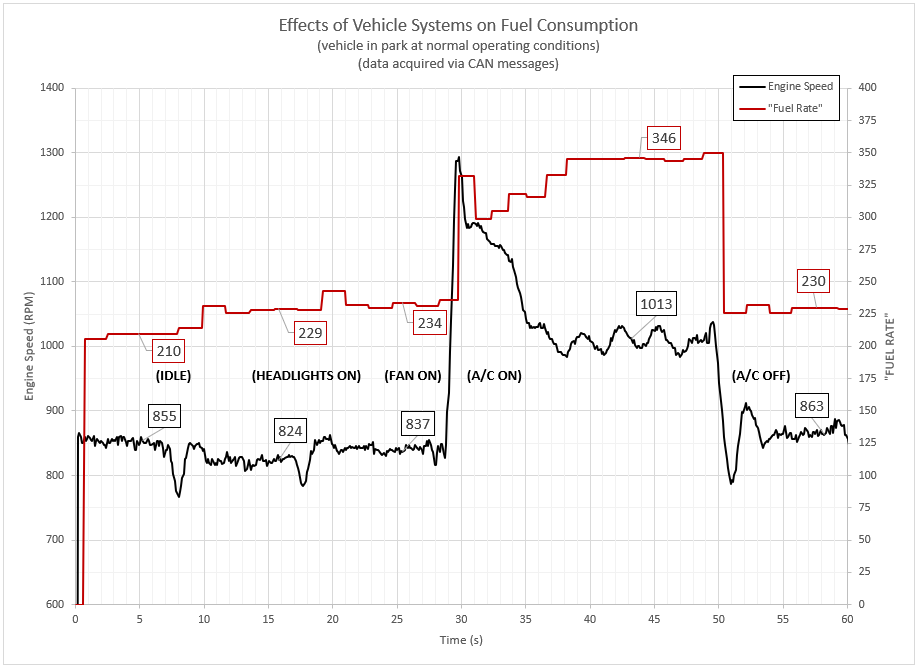
Using the same CANbus-based method as the previous log post, I was easily able to apply an auxiliary load on the engine using all (3) auxiliary load methods above. Now is an appropriate time to note that many of the data sets obtained are expressed unitless, as a 'percent of maximum' value in order to display them harmoniously on a single plot. Additionally, I do NOT yet know the unit on fuel consumption - so I will be using it relatively, not absolutely.
Summary:
Average Engine Speed "Fuel Rate" Load(s) Applied 855 210 None (baseline) 824 229 Headlights ON 837 234 Headlights ON + Interior Fan ON 1013 346 Headlights ON + Interior Fan ON + Air Conditioner ON Plot:
It is clearly evident that both an electrical and mechanical auxiliary load against the engine increase the fuel consumption rate, as expected. What is unexpected is that the engine appears to slightly 'bog down' from both electrical loads whereas it surges upwards with the A/C engaged.
Notes for a [next?] step: Investigate any published documentation on alternator speed vs. output current (or power).
-
Connecting to the CANbus
07/14/2018 at 02:54 • 0 commentsStep 1. Connect to the vehicle CANbus.
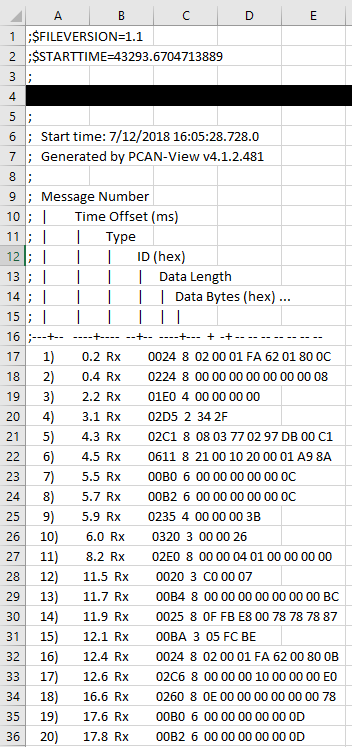
This was relatively simple. I have some basic CAN background experience from my employment. For the purposes of this project log entry, I used a P-CAN USB adapter (gridconnect.com) along with an old OBDII to DB9 connector that I used 5 years ago to read engine diagnostic codes (back with the old ELM OBDII systems). Unfortunately, the DB9 pinnout was very wrong (should have checked first) and when I initially connected the vehicle's OBDII port to the P-CAN tool, I generated 3 dashboard trouble lights. I made a quick DB9M-DB9F adapter that corrected the pinout error...Honestly - I'm not sure why the old cable had the pinout incorrect. Once connected (500kpbs), I recorded a brief CAN trace using P-CAN Basic and then opened it in MS Excel. As shown below, each CAN message contains a timestamp (from the tool), the message ID (which is typically related to some measurable parameter), as well as the data.
Now the harder part comes into play: what do the messages mean?
The vehicle I'm using for this project is a 2011 Toyota Rav4.
I only found one other individual who has looked at late-model Toyotas, as published at the University of Tulsa: Toyota CAN messages. This is exactly what I needed to begin with.
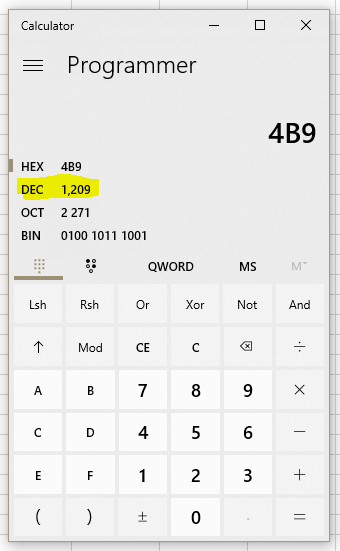
After a little MS Excel manipulation, I was able to sort the data and pick out the meaningful messages. For example, engine speed is extracted from message [HEX] I.D. 0x2C4, with Bytes 0 and 1 (concatenated) then converted into a decimal format as shown below. Note - the order in which the two bytes are concatenated are critical. As an example, 04B9 HEX = 1209 DECIMAL.
Step 1. complete.
-
What are auxiliary engine loads?
07/14/2018 at 02:14 • 0 commentsThe purpose of a test is to accept or reject a hypothesis.
In order to test my project's hypothesis, there are a number of approaches I can undertake which may aid in accepting or rejecting the proposed hypothesis.
First, let's consider engine braking in general. The most notable use of engine braking is large commercial [diesel] trucks with heavy payloads (typically towing. In this application, in order to preserve brake life, the engine is placed into a lower gear which, in turn, increases engine speed (without much, if any additional fuel), resulting in the engine converting the vehicle's kinetic energy into 'air' compression within the engine's cylinders.
I suspect that instead of converting kinetic energy to compression - it (the vehicle's kinetic energy) can be recovered by an auxiliary load on the engine. In industry, these loads are either auxiliary (intentional as a value-add to the engine's primary power output function) or parasitic (unwanted, typically wasted and dissipated as heat).
The first task is to identify how much auxiliary load I can place on the engine under controlled conditions, and what the fuel rate response looks like.
To do this, I need to:
1. Measure engine speed
2. Measure fuel consumption rate
3. Apply an auxiliary load(s).
Regenerative "Braking" via Vehicle Alternator
Utilize the existing onbaord vehicle alternator to recover energy to a secondary battery during highway offramp coasting operations.
 Michael