I finally figured out the cause of the noisy pH measurements. The nutrient solution was being affected by an intermittent very high resistance connection to ground. Breaking the connection to ground fixed the problem.
The picture below shows the original noisy pH measurements on the left, pH measurements mostly saturated at the ~pH 2 circuit minimum in the middle after changing to a new pH probe, and the now valid non-noisy pH measurements on the right. In the middle, the actual pH was above 7, but it saturated to around pH 2 due to the unintentional ground connection.
So how did a high resistance connection to ground cause these faulty readings? To understand this, you need to understand that a pH probe is basically a battery in series with a VERY large resistance. The voltage on the battery changes with the pH. The probe voltage drives an amplifier input that draws so little current that the large probe resistance doesn't affect the voltage measurement that much. The pH probe is in electrical contact with the solution, so if you ground the solution, the pH probe reading gets shifted.
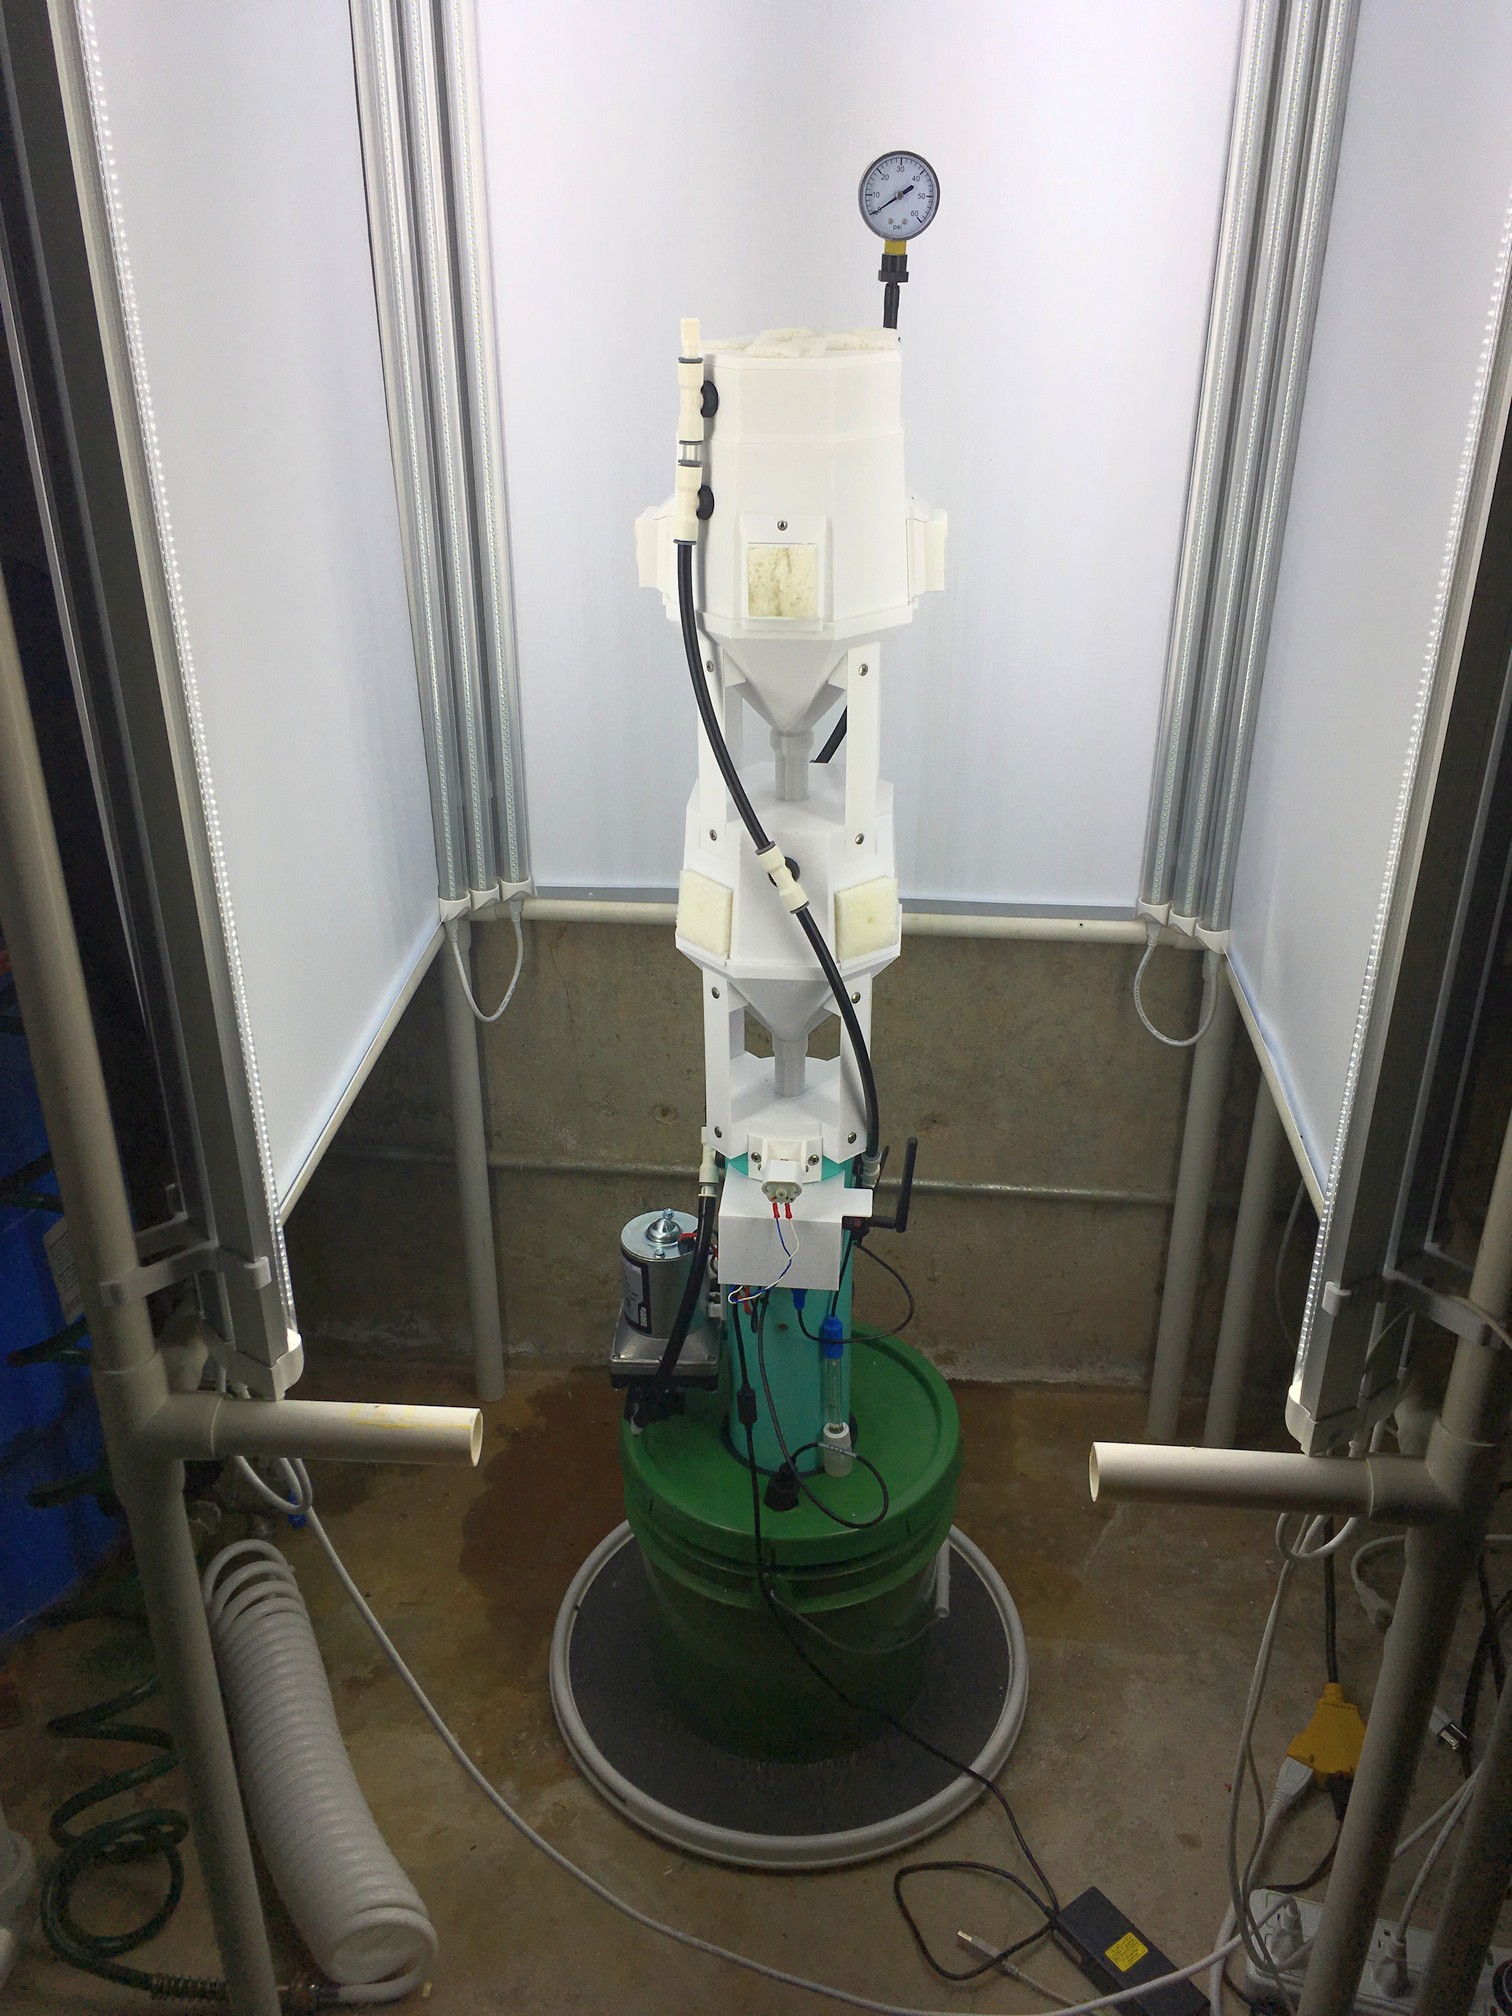
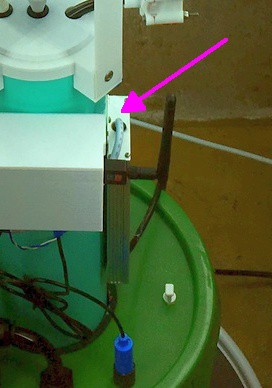
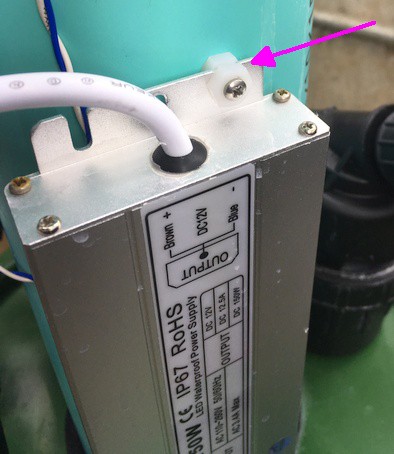
So, where was the connection to ground coming from? From the screws that hold the power supply to the support pipe indicated in the photo below. The screws at the top and bottom of the supply go all the way through the pipe wall. The connection was from the grounded case on the power supply, through the screws, down the wall on the interior of the pipe, through the nutrient solution, and finally to the pH probe.
The tricky part is that the connection inside the pipe depends on the conductivity between the screws and the surface of the water. This depends on how wet the inside wall of the pipe is. The pipe wetness depends on how it gets splashed from water coming from above. Because splashing is pretty random, the conductivity is pretty random. The measurement system is designed with pH 7 at 2.5V and ground is 0V, so connecting the nutrient solution to ground makes the measured pH artificially lower than it really is.
In order to fix the problem, I isolated the screws holding on the power supply using nylon nuts and heat shrink tubing as shown below. After this modification, the pH noise is gone. The changes on the right hand side of the graph are caused by actually adding pH down solution, not by intermittent ground connections. The takeaway is, when making very high resistance measurements, always make sure that there are no stray lower resistance connections.
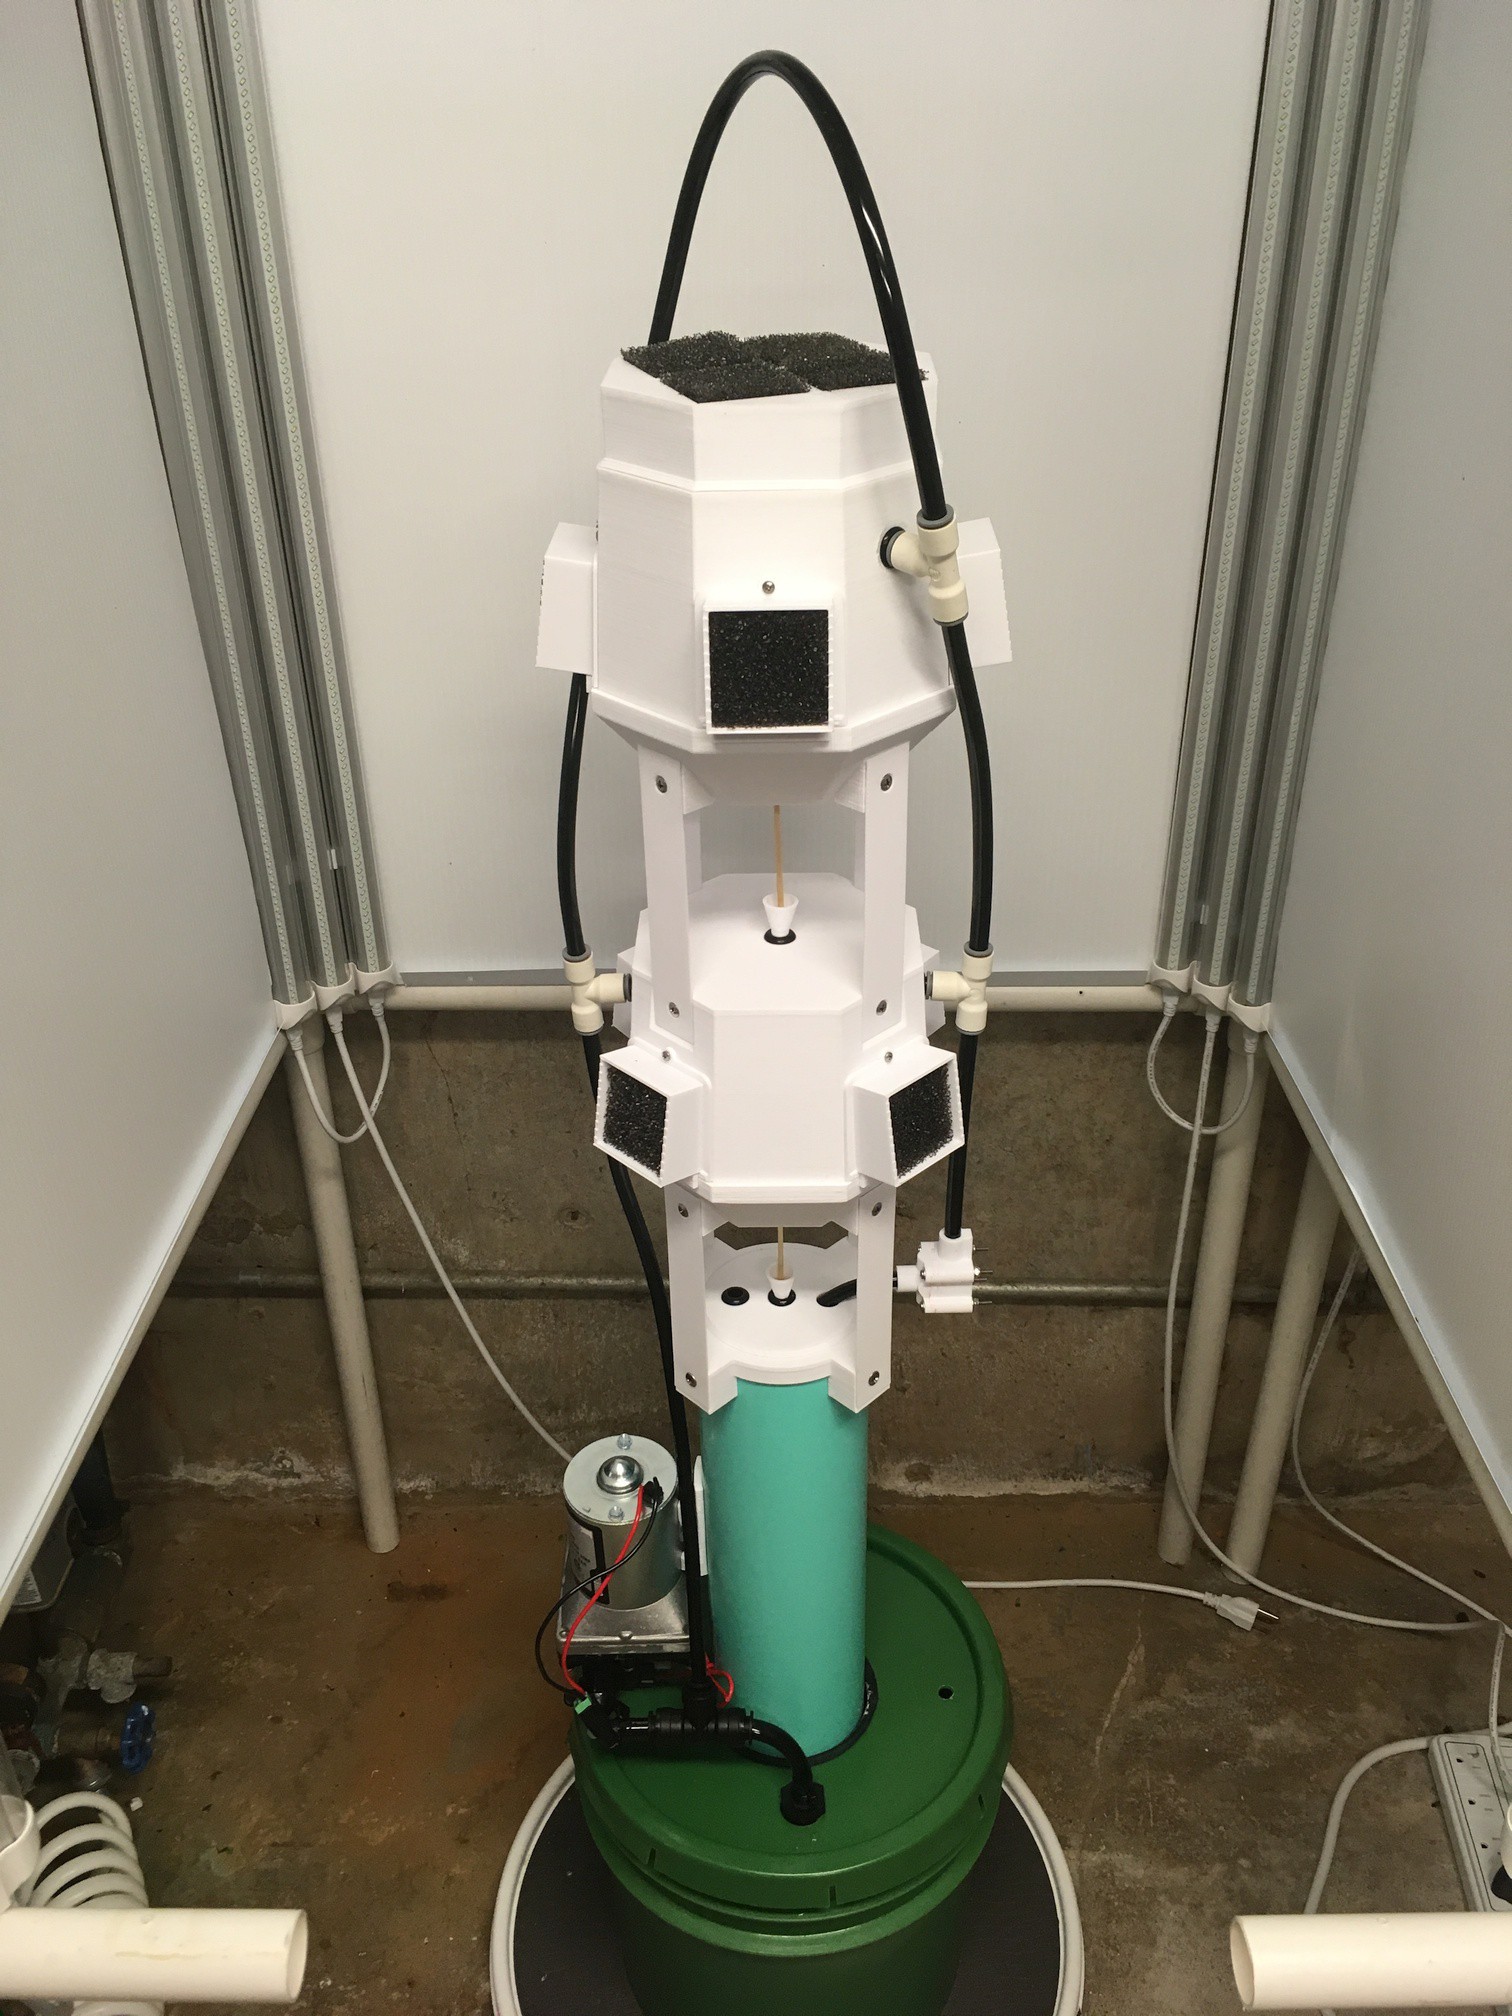
This is the new cost reduced version of the system. It has lower cost sprayers that actually have a better spray pattern, a lower cost valve, and a different flow setup. If anyone wants to hear more about it, leave a comment and I'll fill in the details.
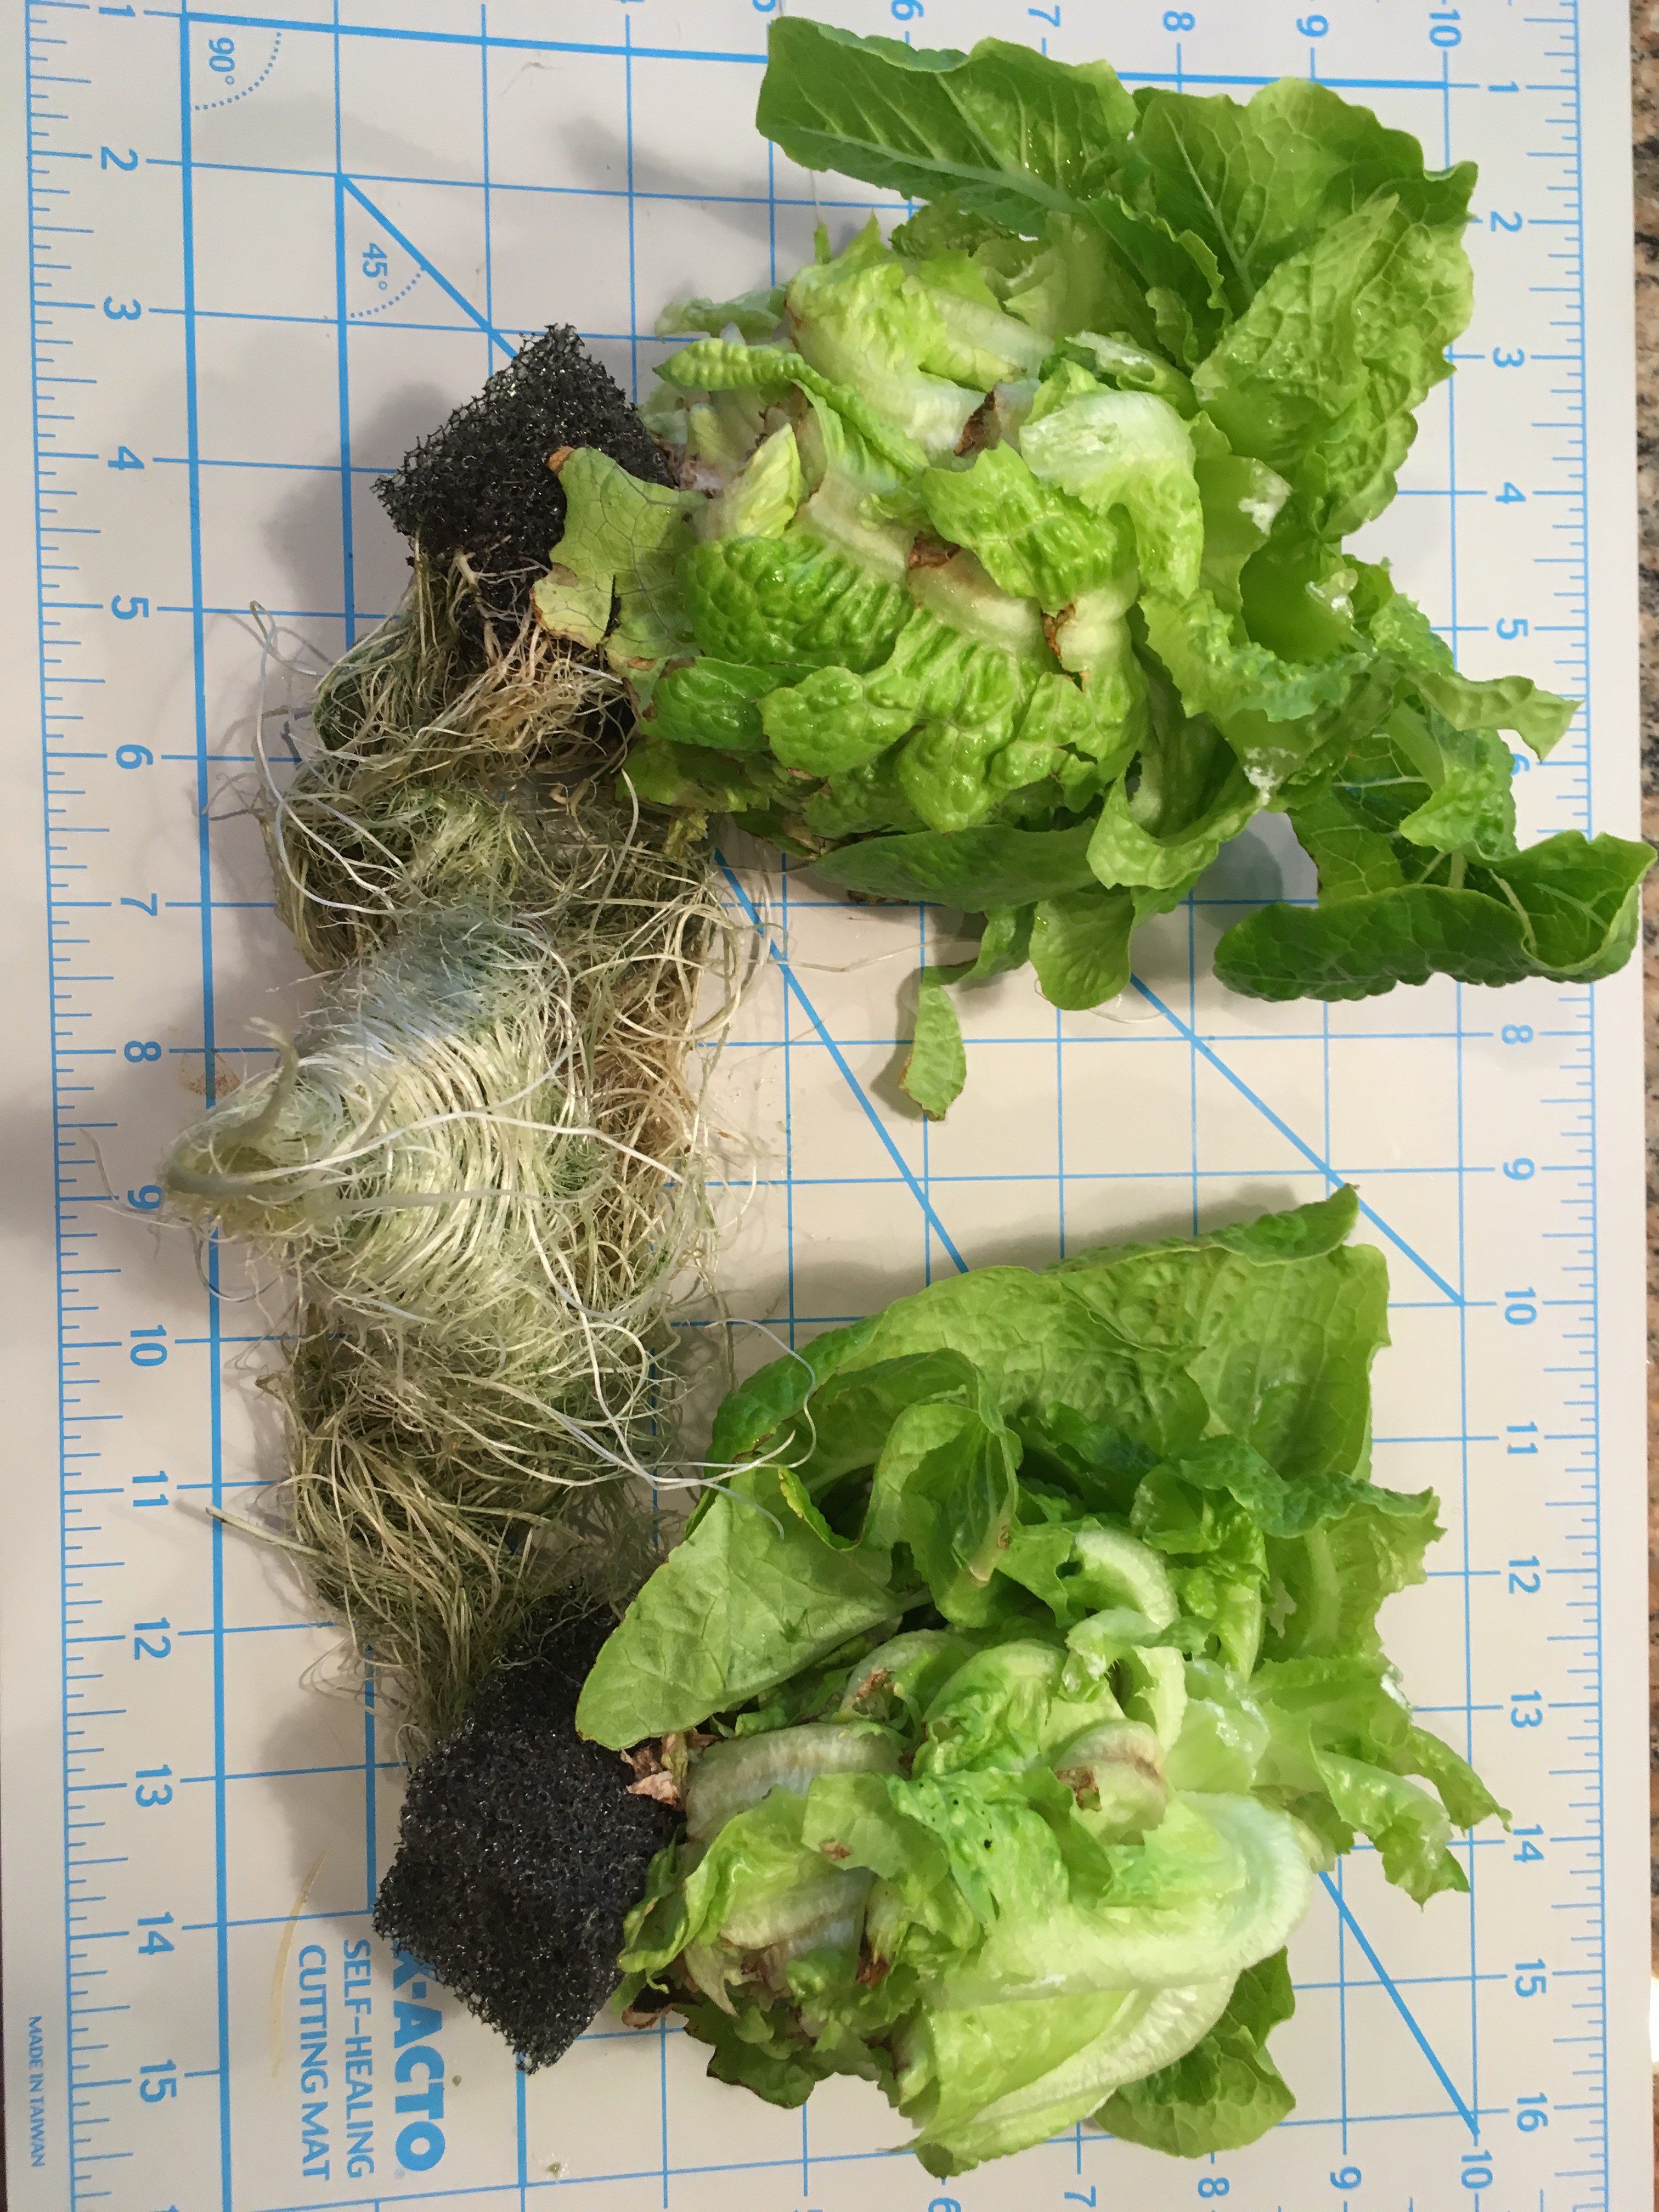
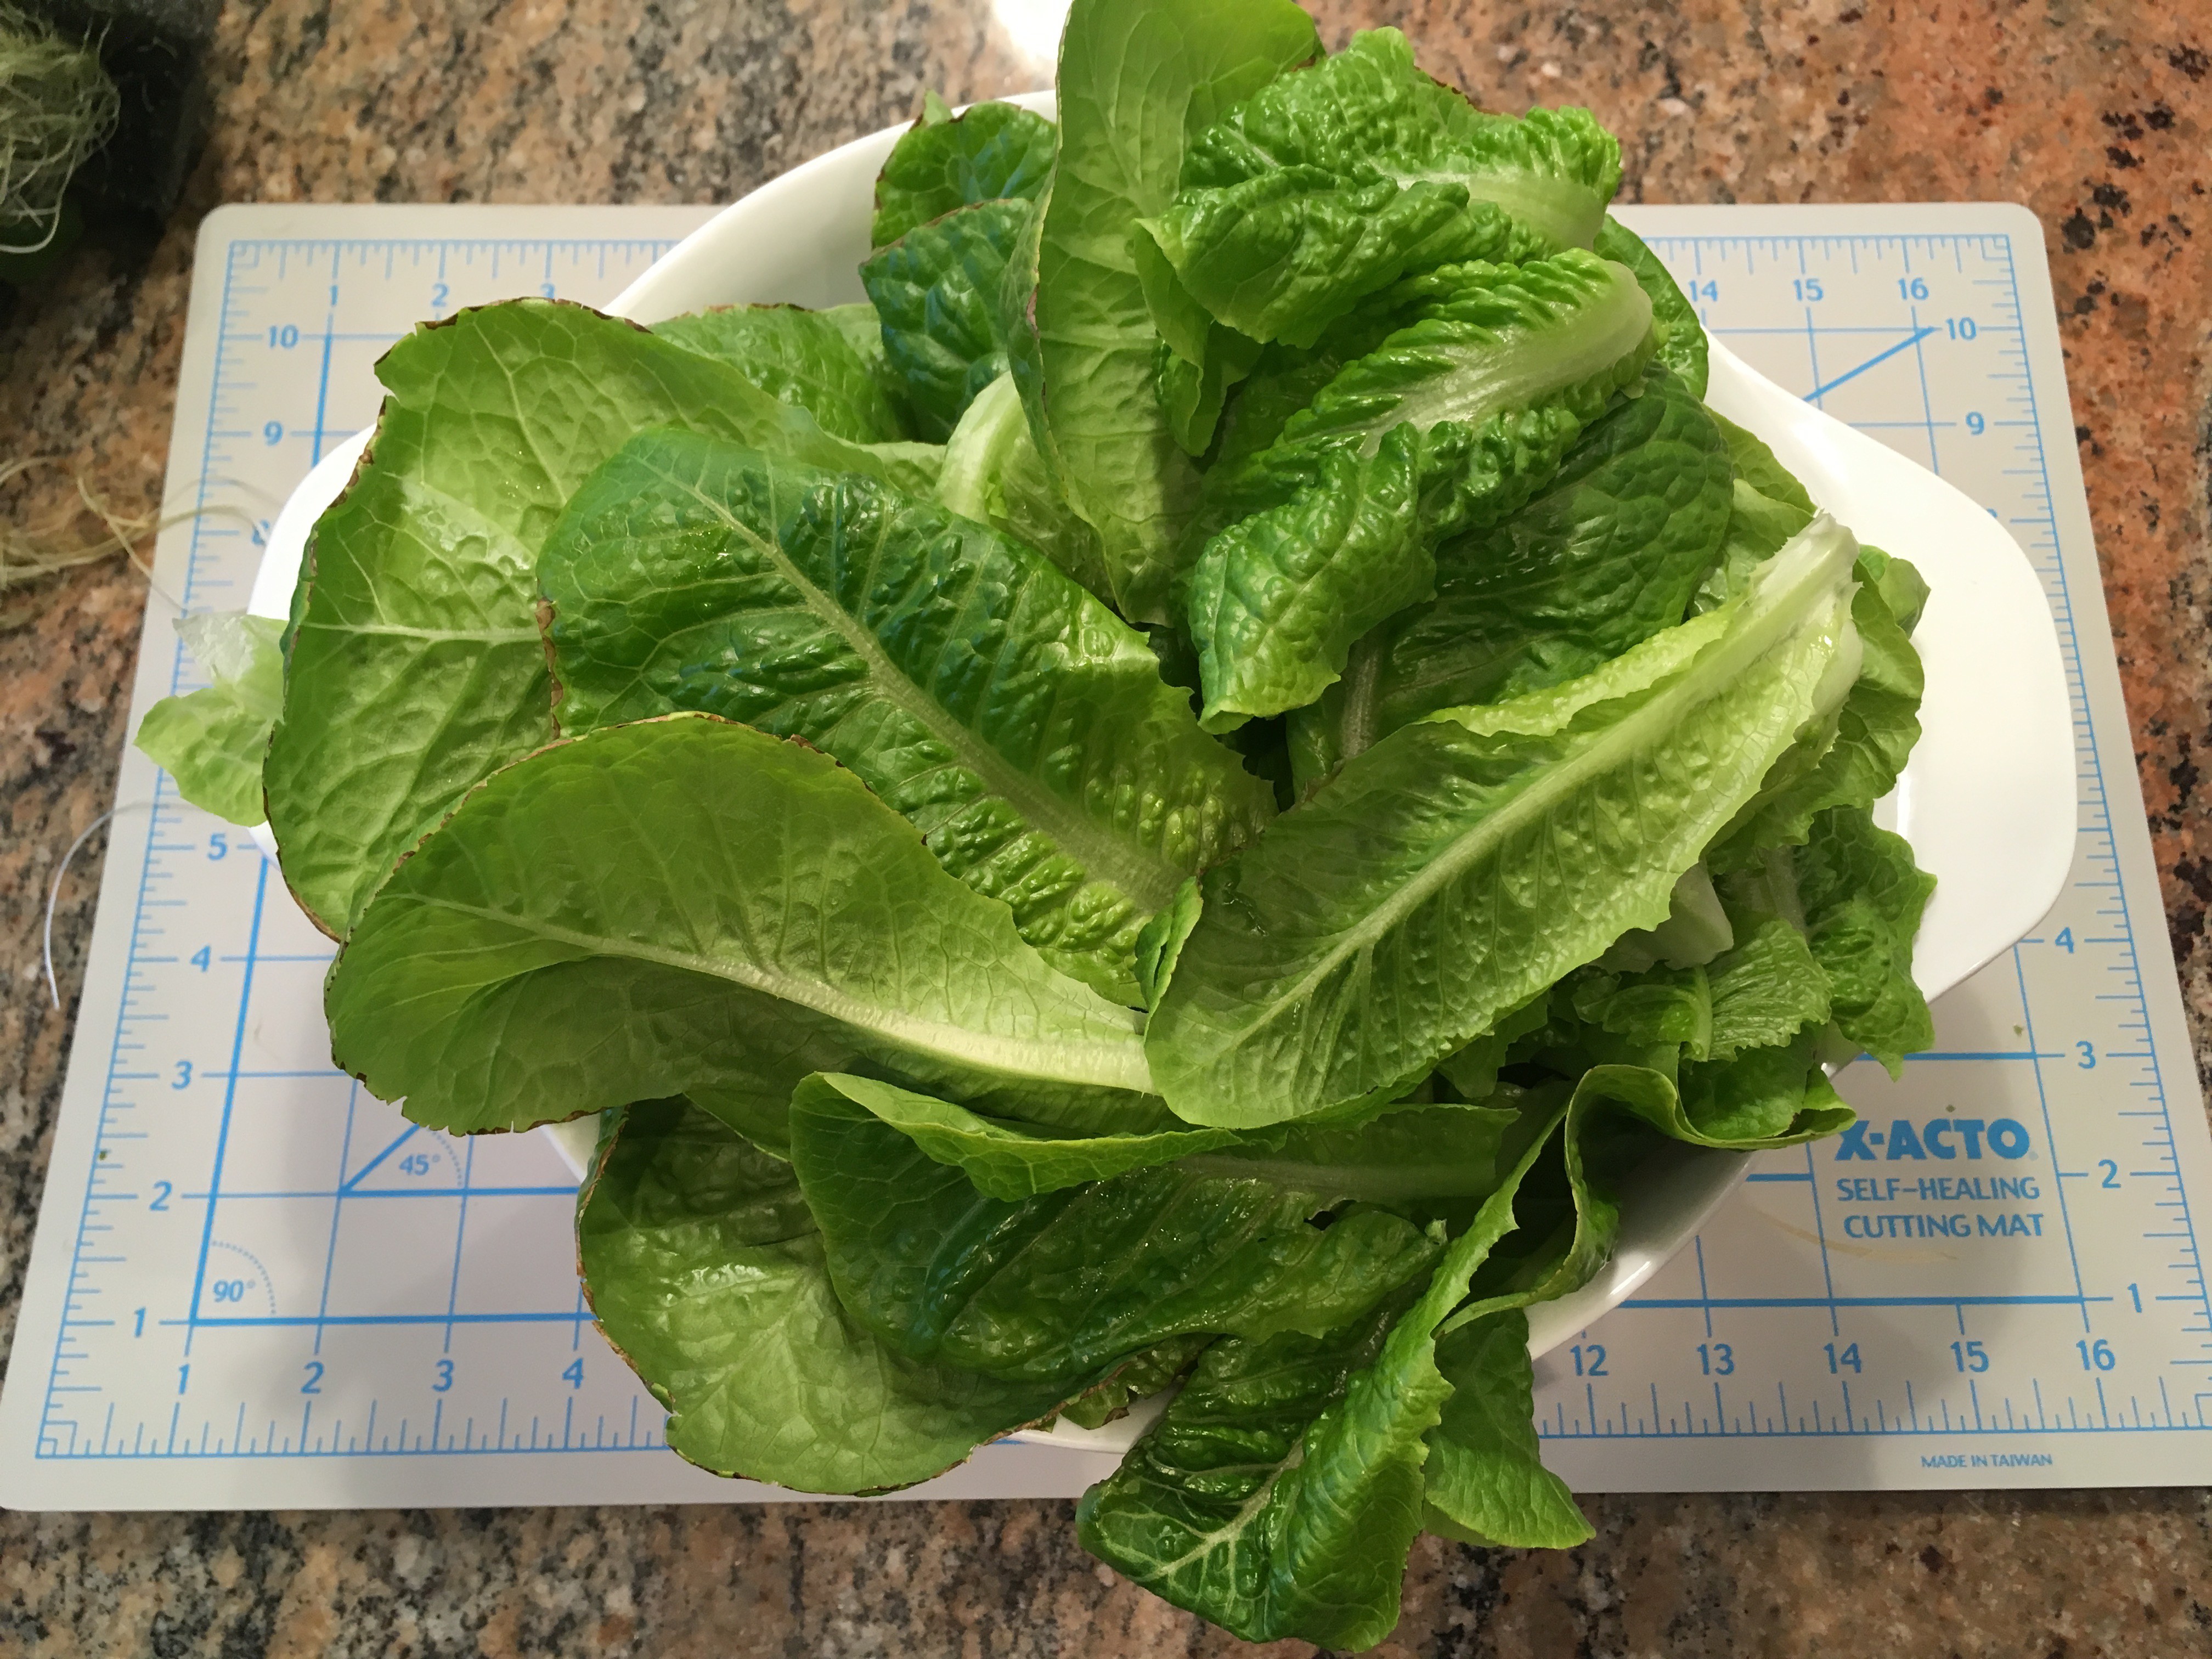
We've had many tasty salads over the holidays! Below are the remains of the last two plants from the current test crop, which I pulled about 10 weeks after sowing. The leaves from the last picking are in the second photo.
The plant photo shows how the roots took on the shape of the bottom of the pod, as they spiraled around the surface. Any roots that grew through vertical tubes between pods were occasionally pruned. The roots got a bit damaged when the other two plants in the pods were removed early, due to their bolting. The lesson is to make sure to match the lifecycle of the plants in one pod.
I'm still getting some leaf tip burn and have not determined why. Truthfully, I have been working more on system design than nutrient optimization, so I'm fairly sure that it can be corrected.
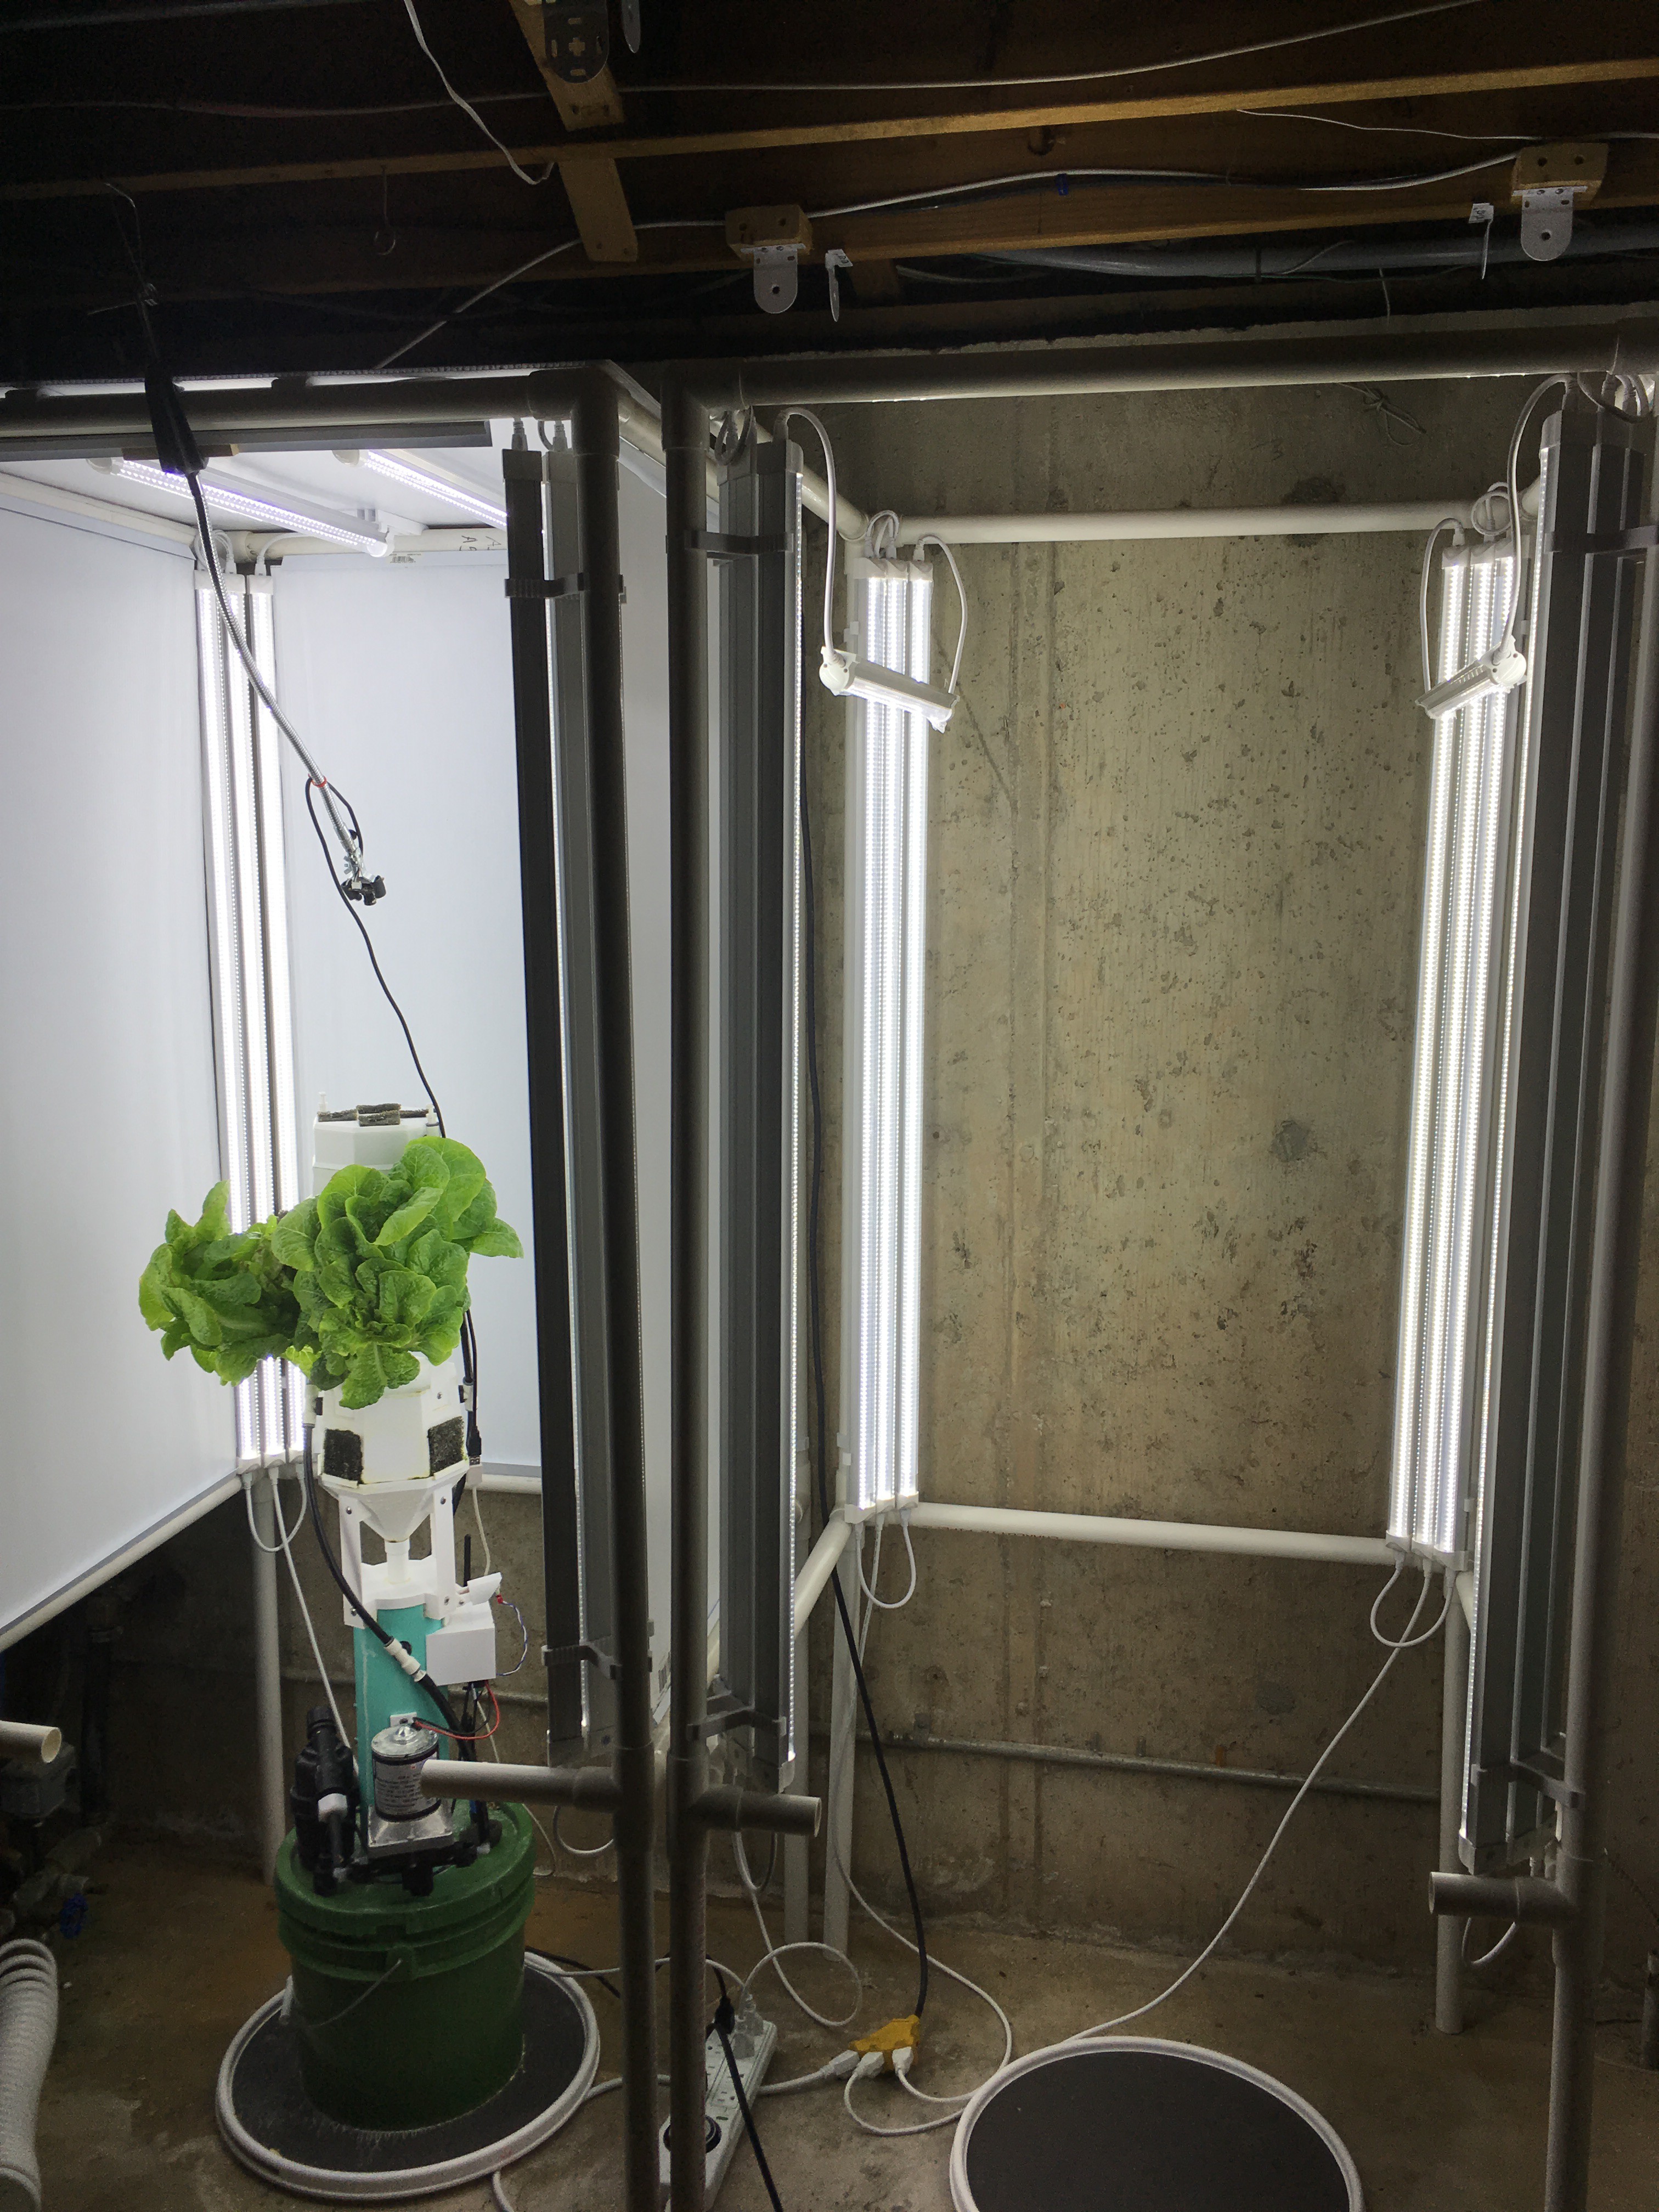
As shown below, I'm working on building a second test cell for A/B testing of nutrient levels. The second system will of course be "New and Improved!". The biggest update is a simpler control valve design that costs less to make and should also be more reliable. I've also made some small modifications to be control board design and will be having new PCBs made soon. I will be documenting the new system in project logs as I build it.
Finally, if you've made it this far, please consider posting a question or comment. Interacting with potential future users will help me tailor the final design.
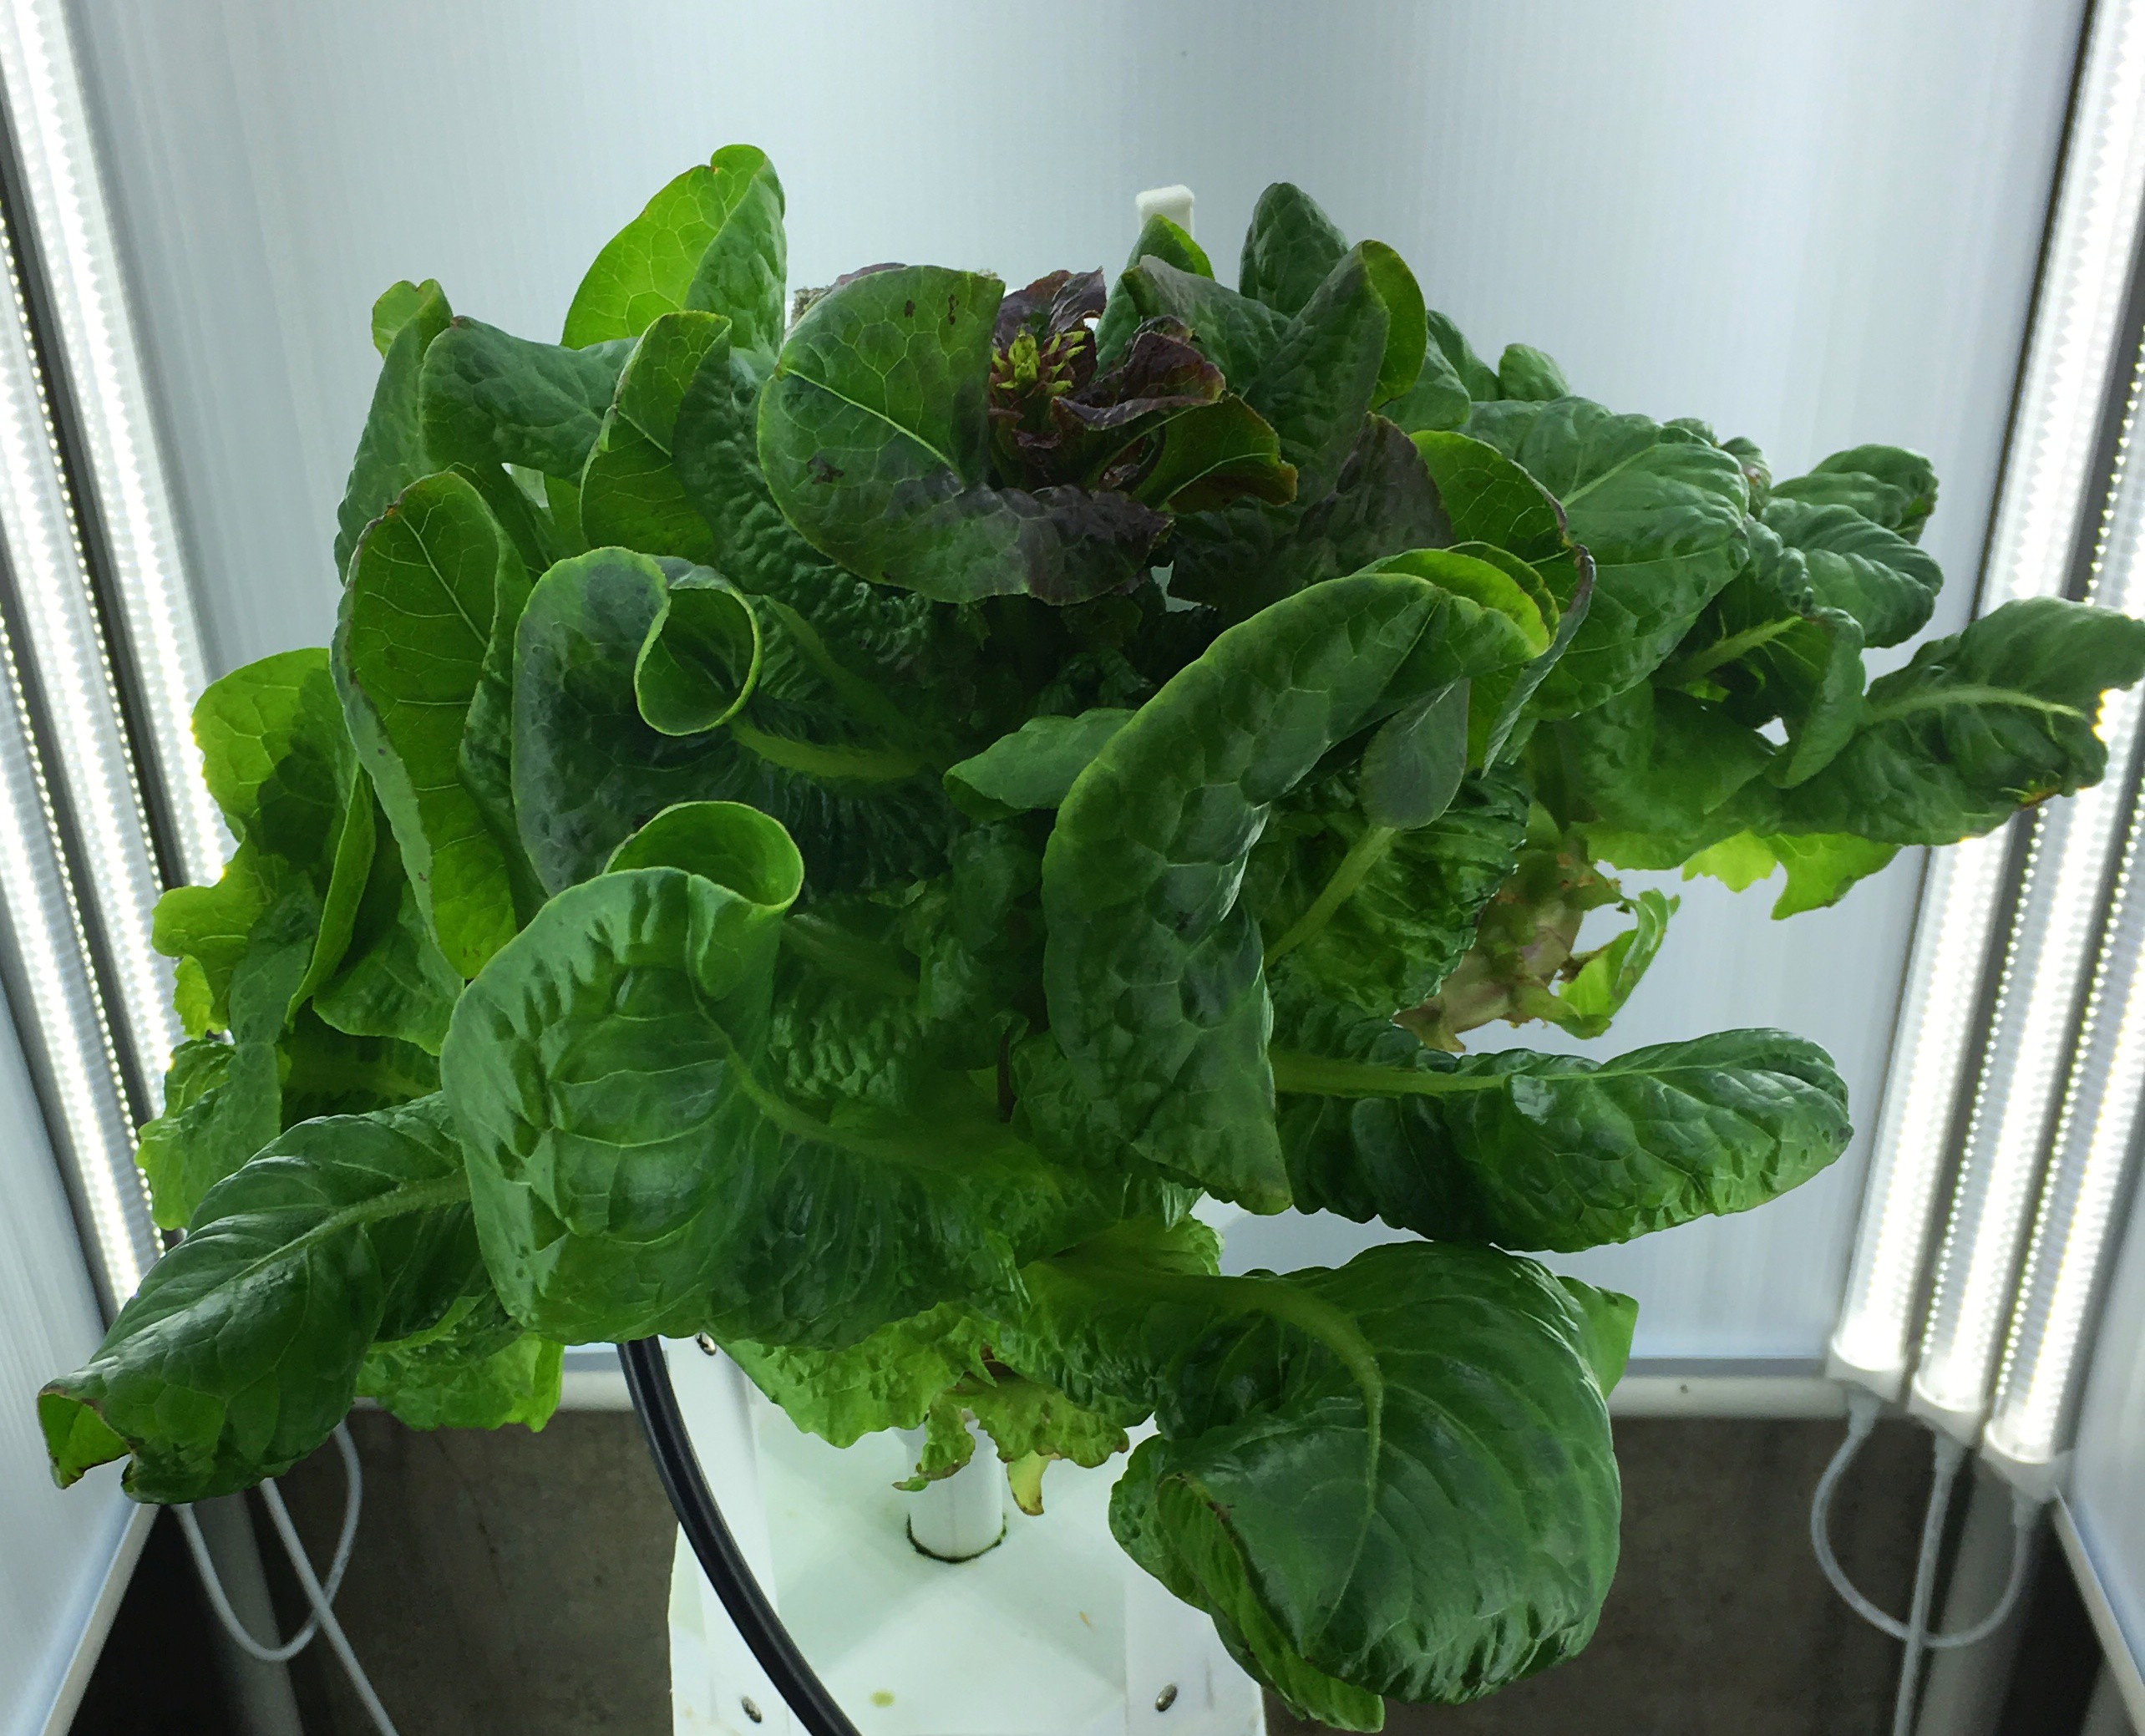
Just a quick look at the current state of the lettuce. The six week plant (facing forward) is doing really well. This is after picking the rear leaves three times. On the five week plant on the right, you can see the post-picking bare stalk. This plant isn't doing quite as well. I have been trying to keep the calcium in the nutrients boosted, but the there is still a little of tip burn on the leaves. Optimal fertilizer levels are still a work in progress. While the front and left are buttercrunch, the green leaf lettuce on the left and back of the system do not have significant tip burn.
This particular buttercrunch lettuce seems to like to grow vertically, even though it starts out horizontally. The stalks take a 90 degree turn just outside the pod. Other types have grown more towards the light than just up.
Just a quick picture to show off the tremendous root growth. The plants are about 5 weeks old except the one on the bottom of the frame which is six weeks old. Click on the picture and zoom in to get a good view of how dense the roots are.
You can see that there is some algae on the sides near the top, but it's a lot better than the previous system.
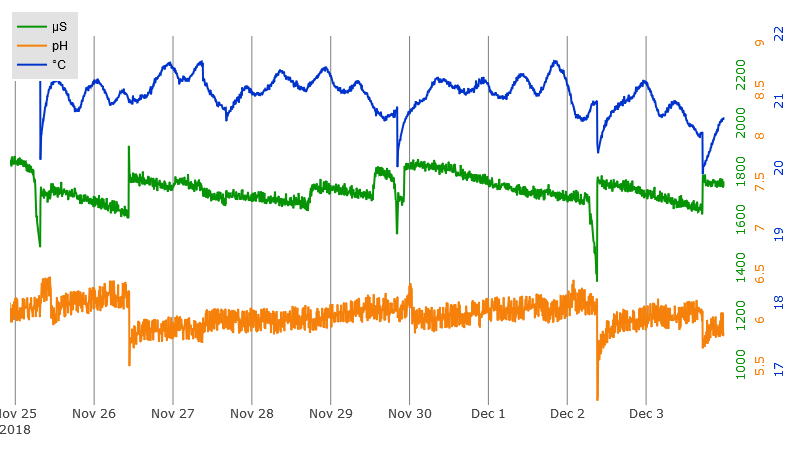
So far I have not changed the water from the original fill. I've been adding Calcium/Magnesium and a bit of regular fertilizer, and adjusting the pH by hand after monitoring the plots. Below is a screenshot of the plot from the last 8 days. The EC takes a dive when the water level gets below the level of the sensor, so you can tell that you need to add water. The temperature goes down when you add water. You can also see the EC/pH spikes where the fertilizer and pH were adjusted. The pH tends to rise as the plants exchange H+/OH- ions to take up the nutrients.
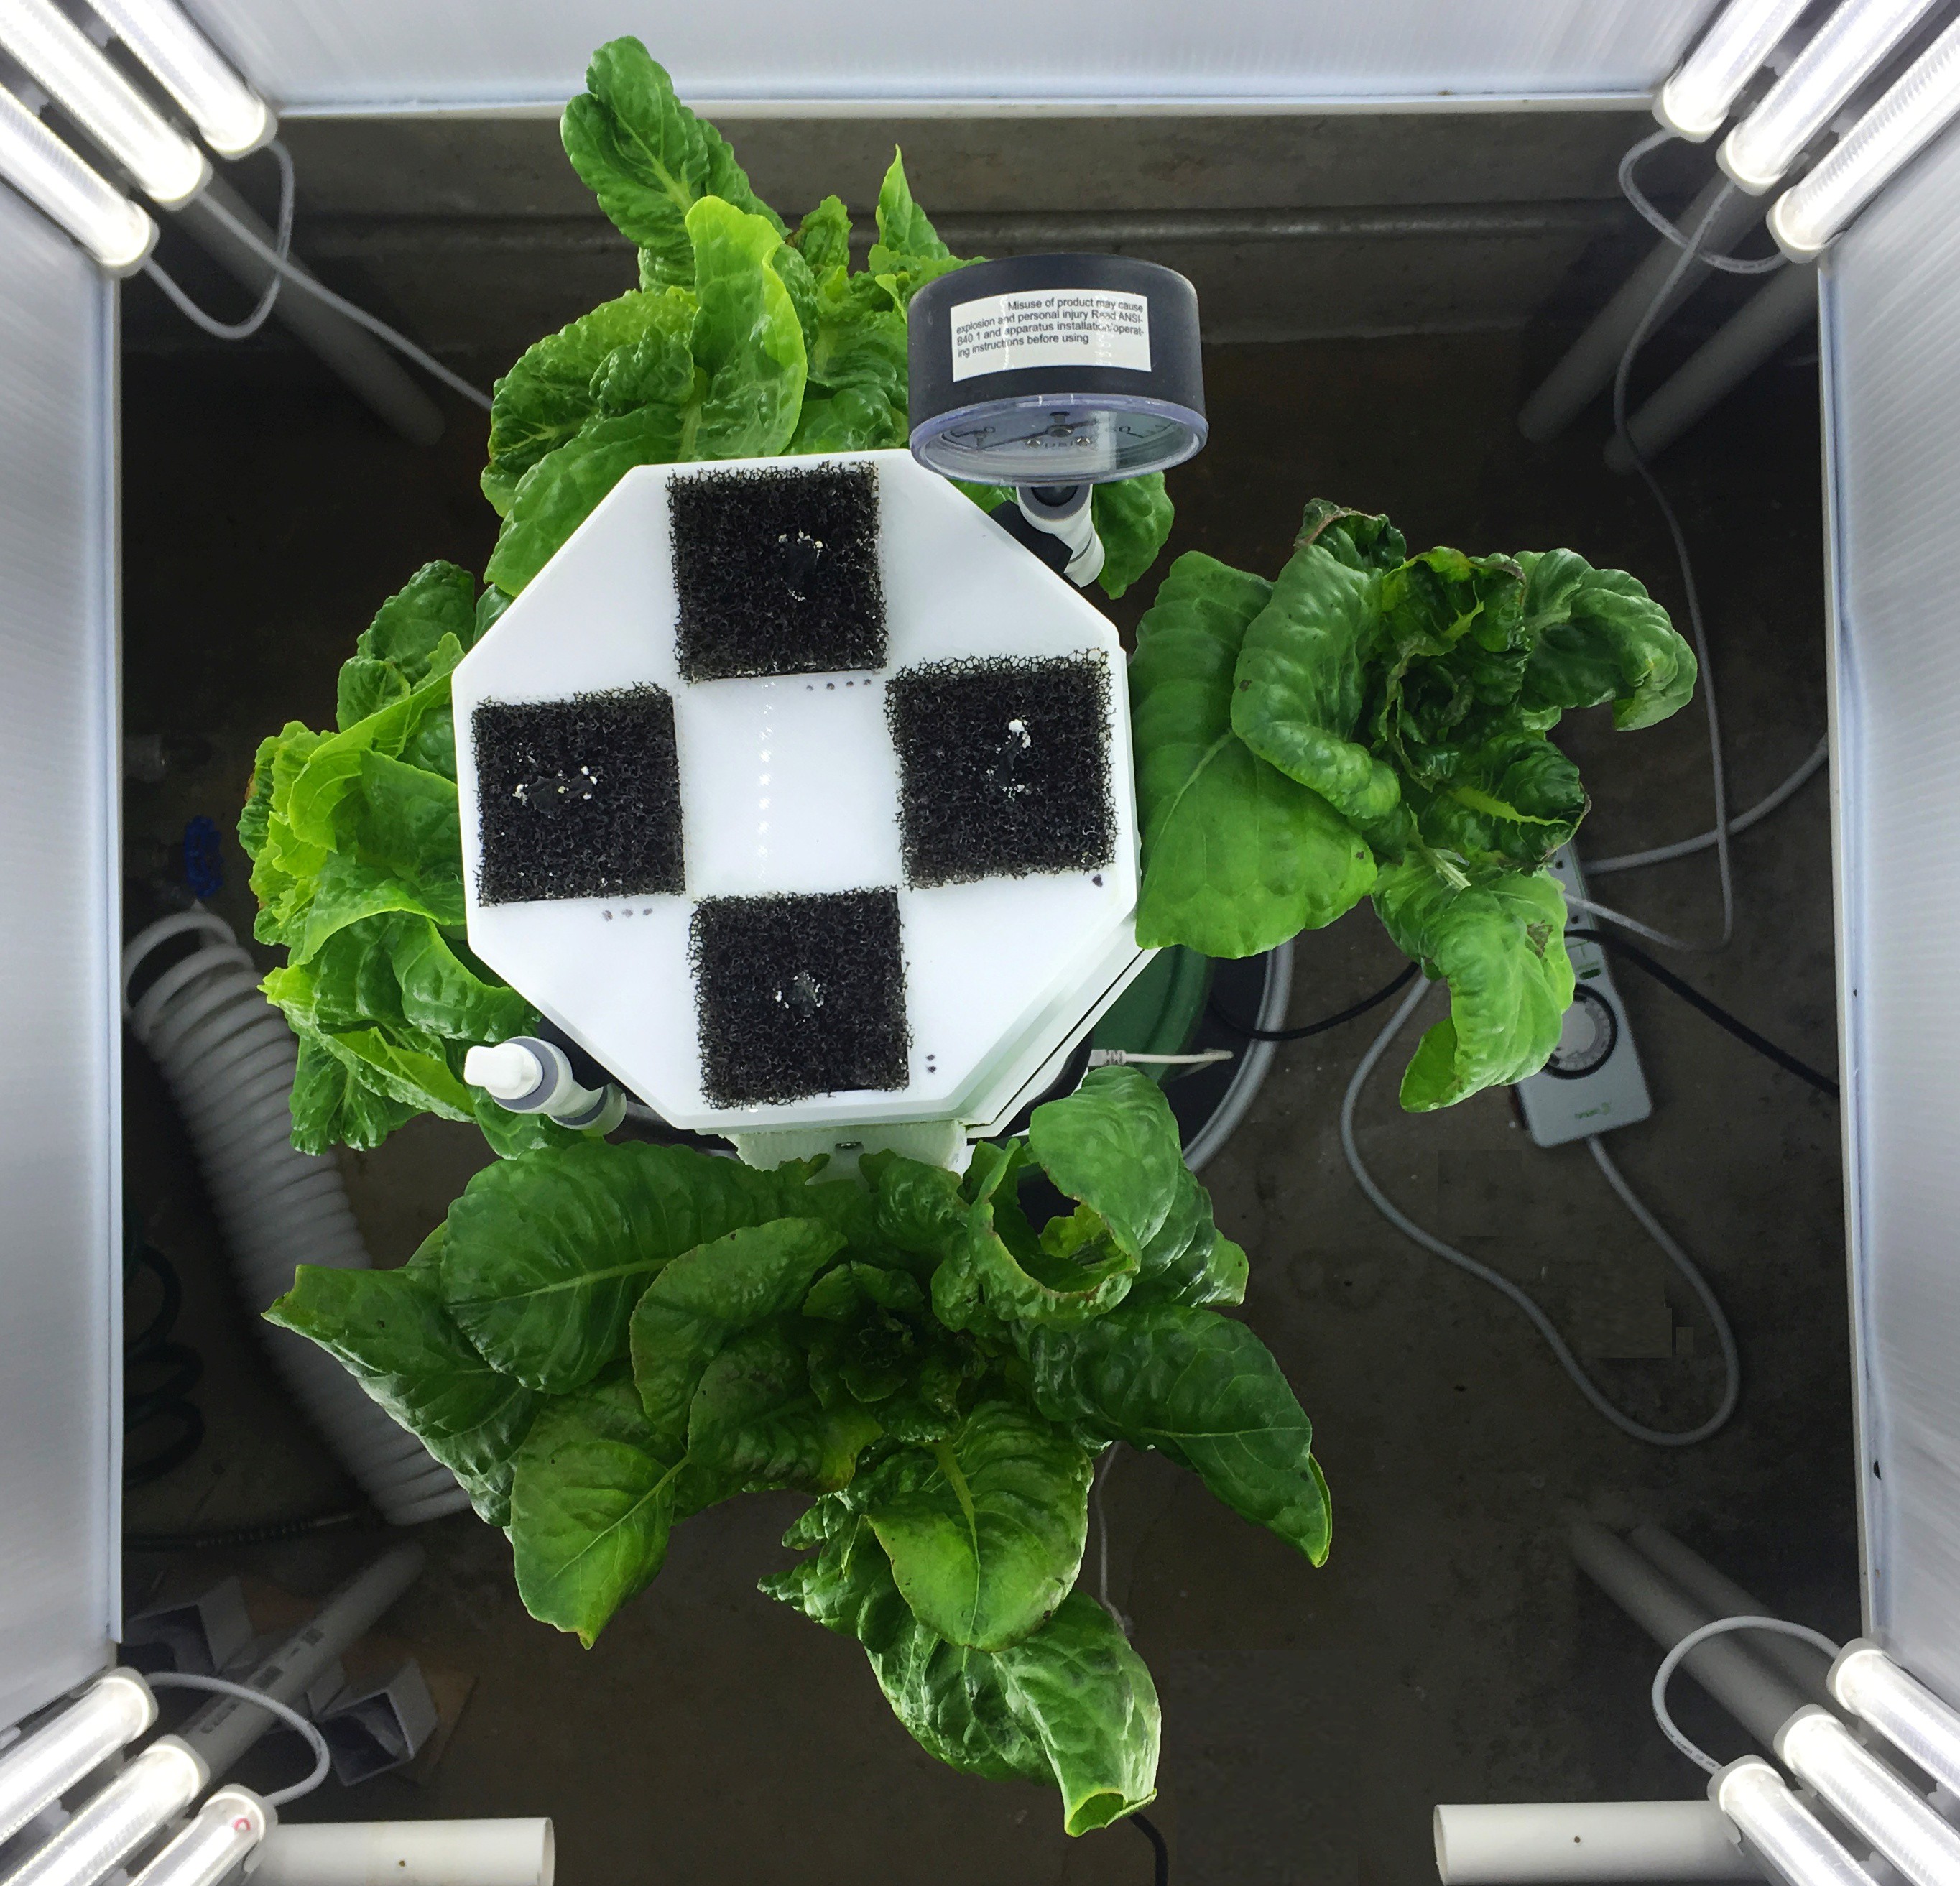
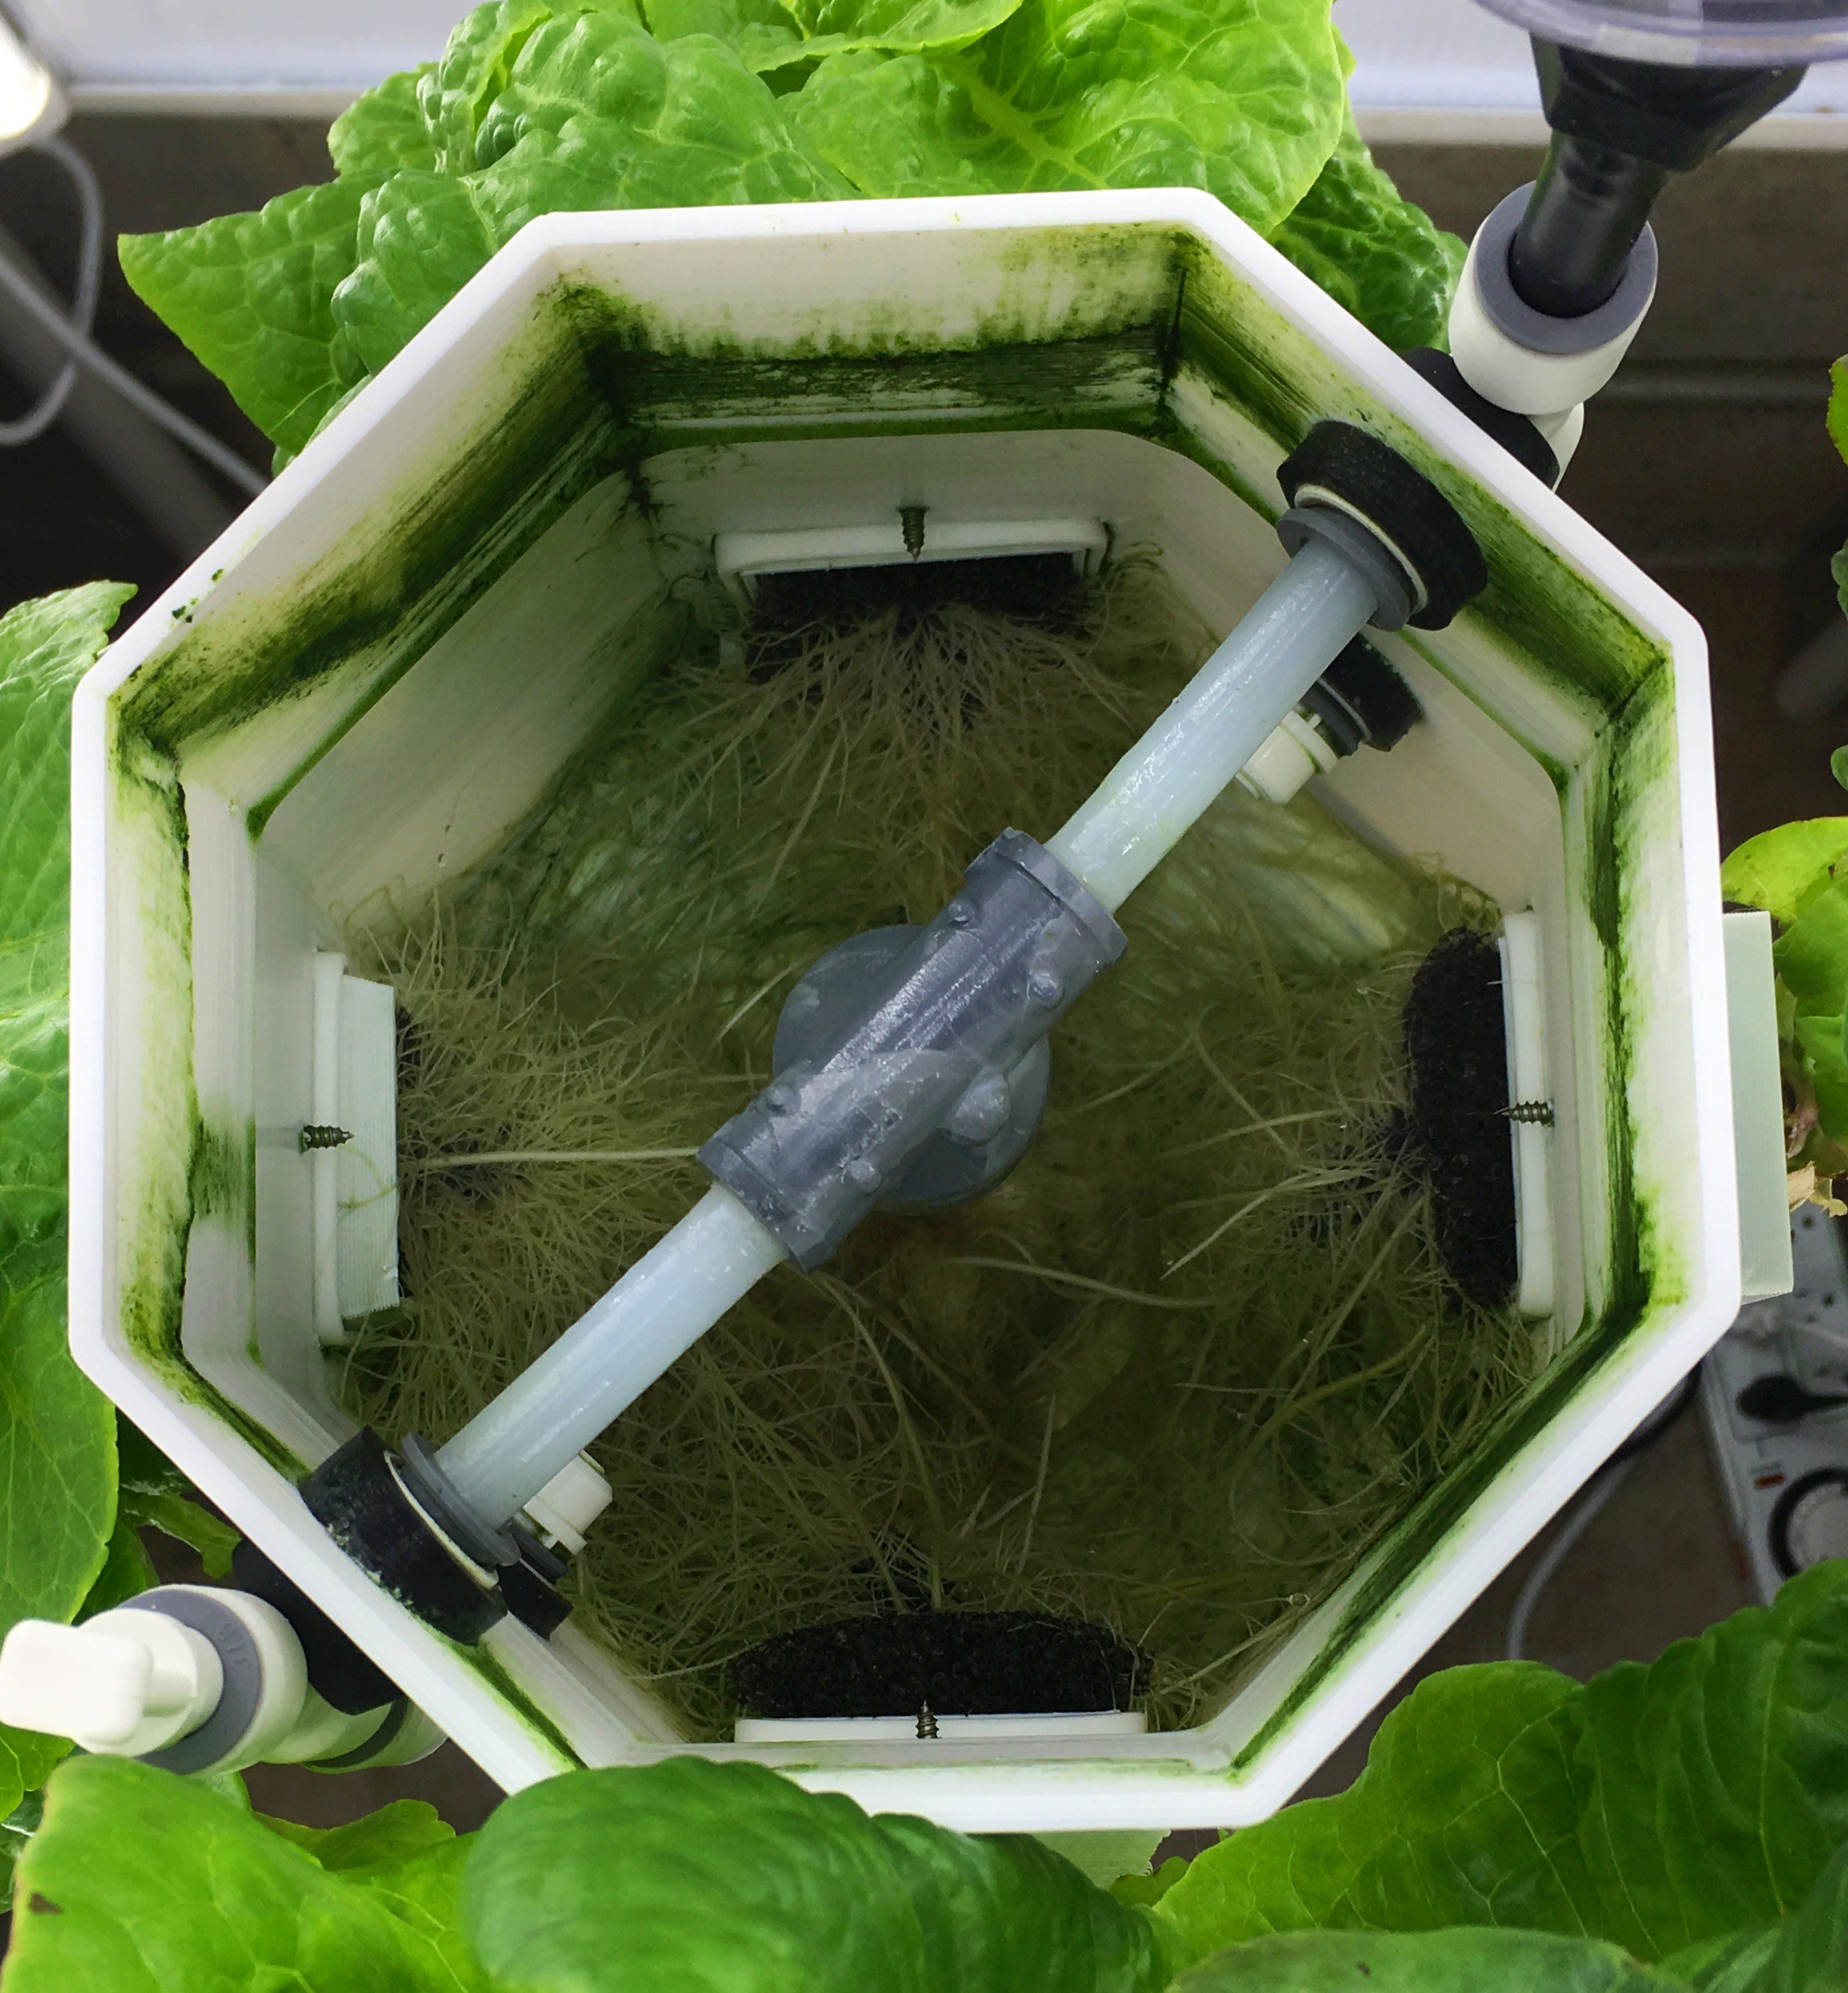
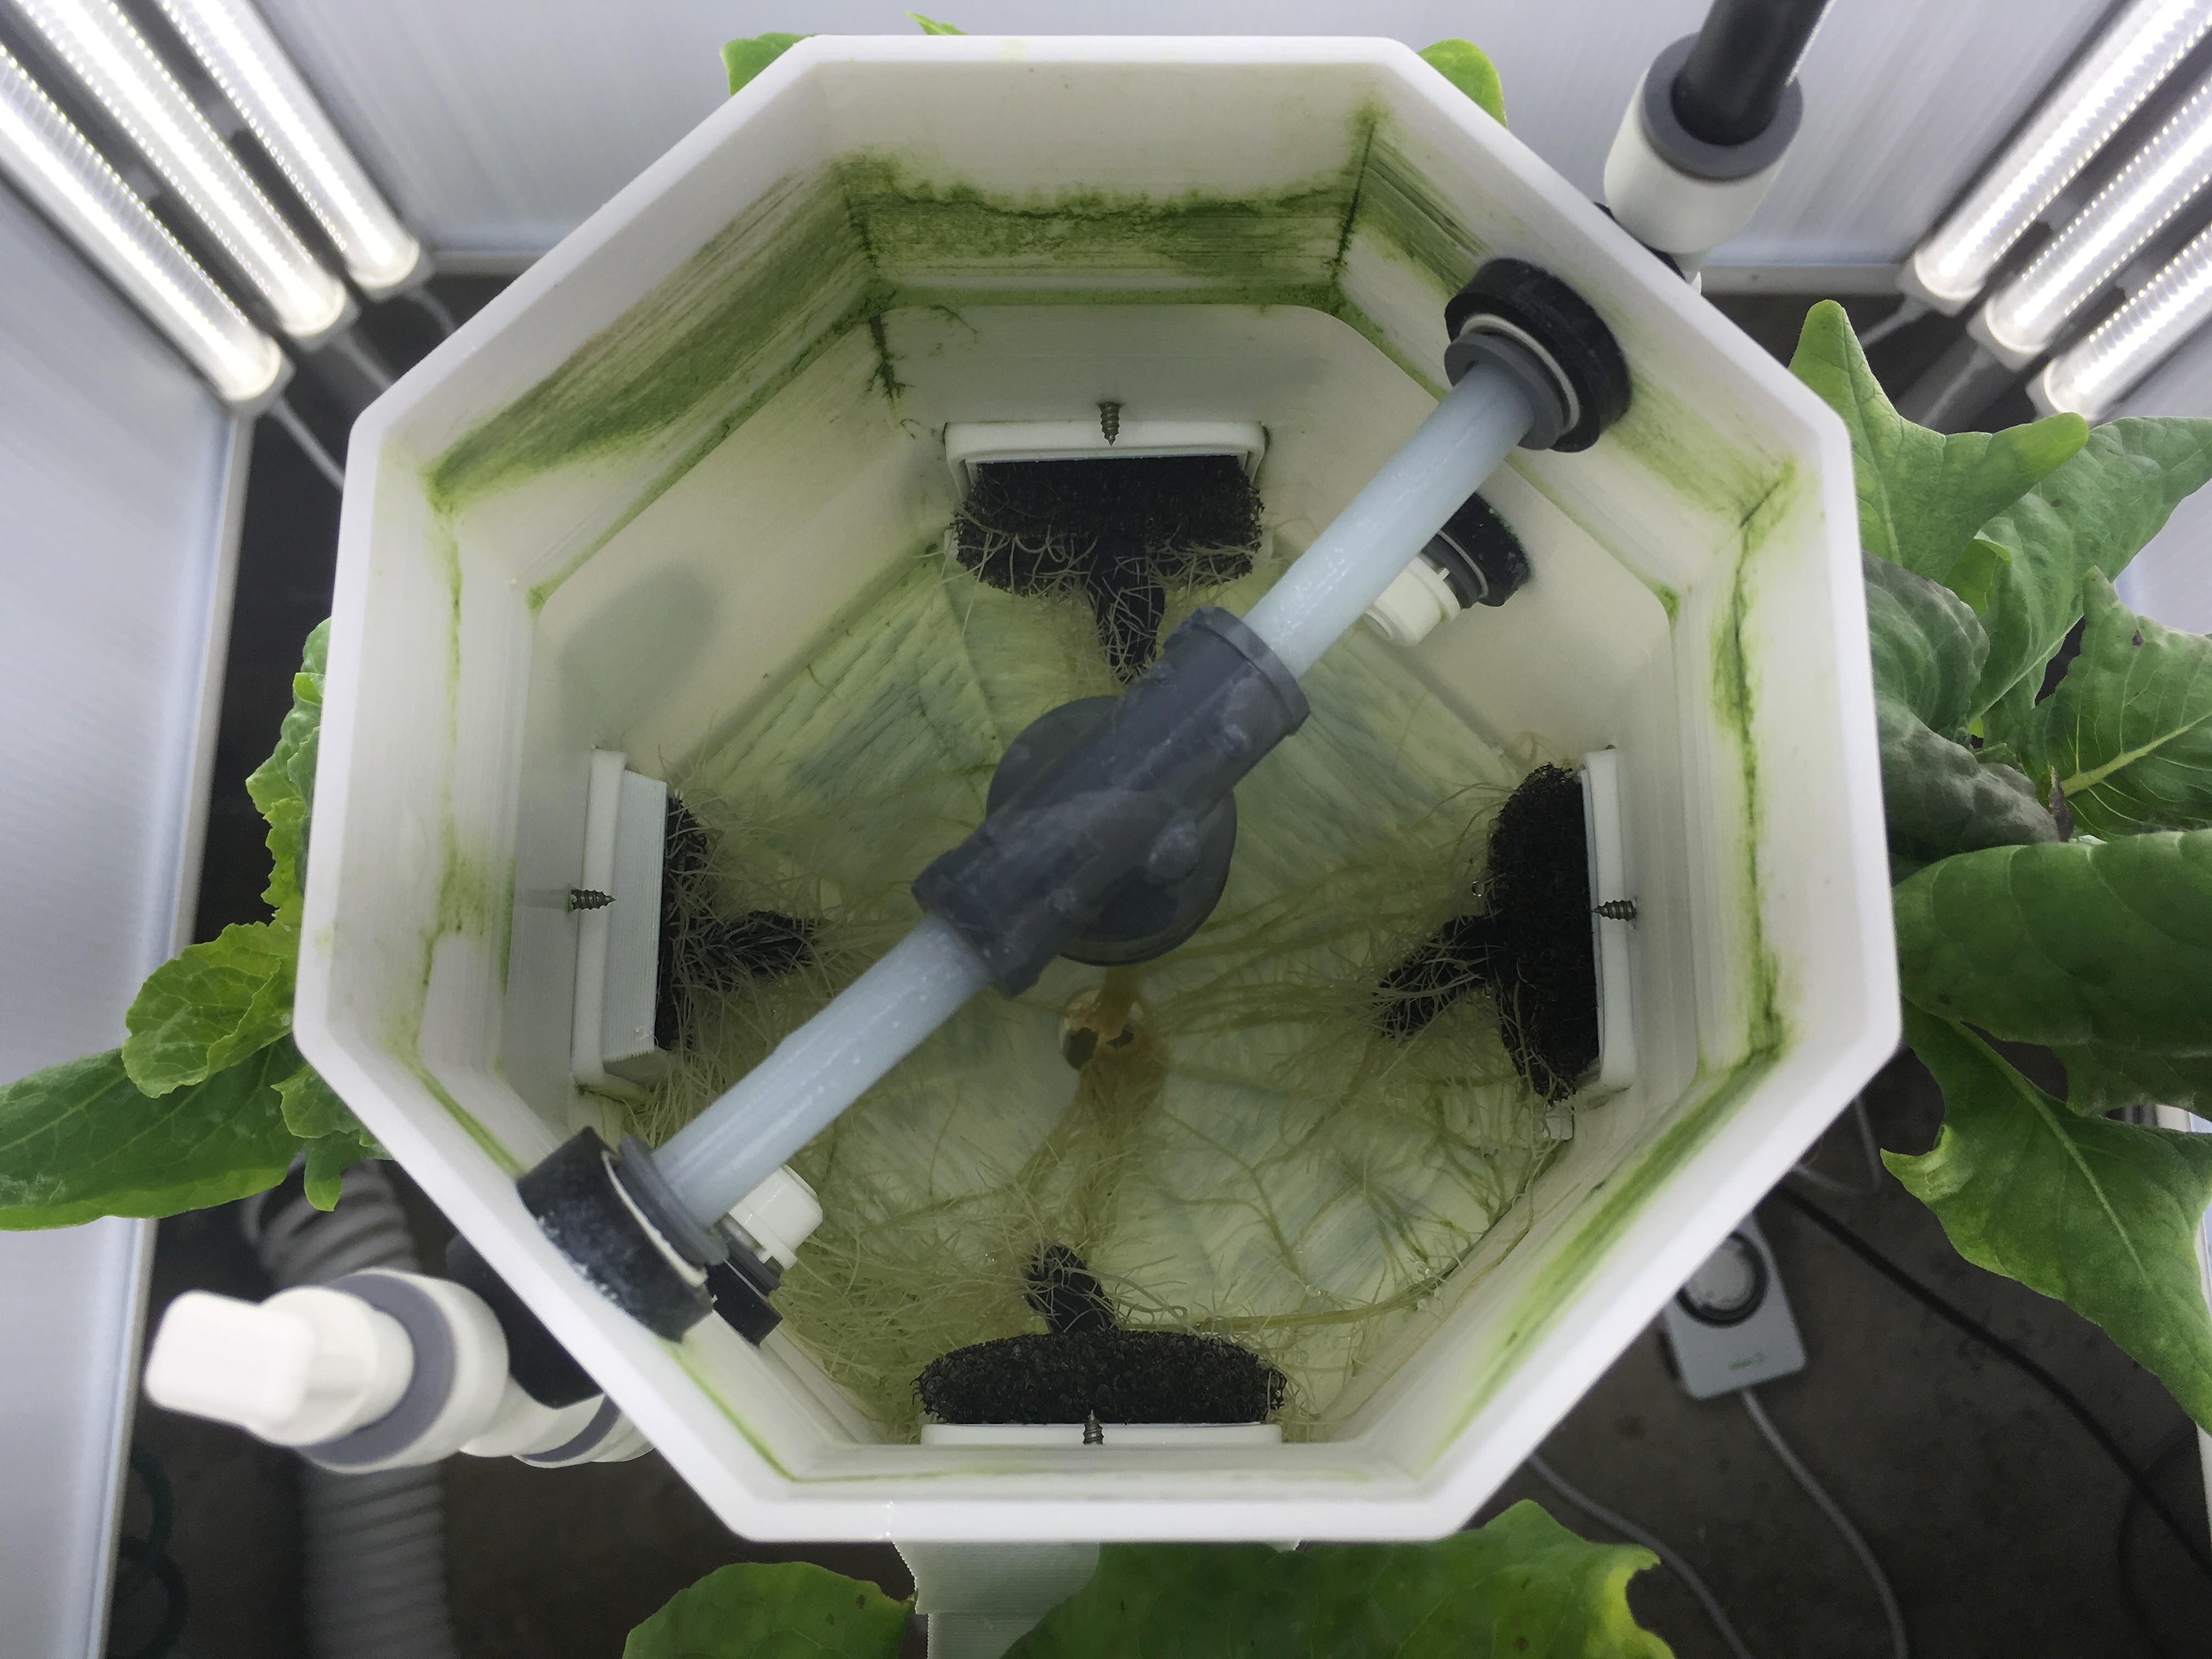
The new crop has been growing for about 4 weeks now. The photo below shows a view looking down on the system with the plant starter top plate removed. You can see the extensive root systems the plants have developed.
I also thought this photo which shows a birds eye view of the system was pretty cool. The white spots on the center of the foam blocks are from the water in the nutrient solution evaporating at the end of the wick, leaving behind the dissolved solids.
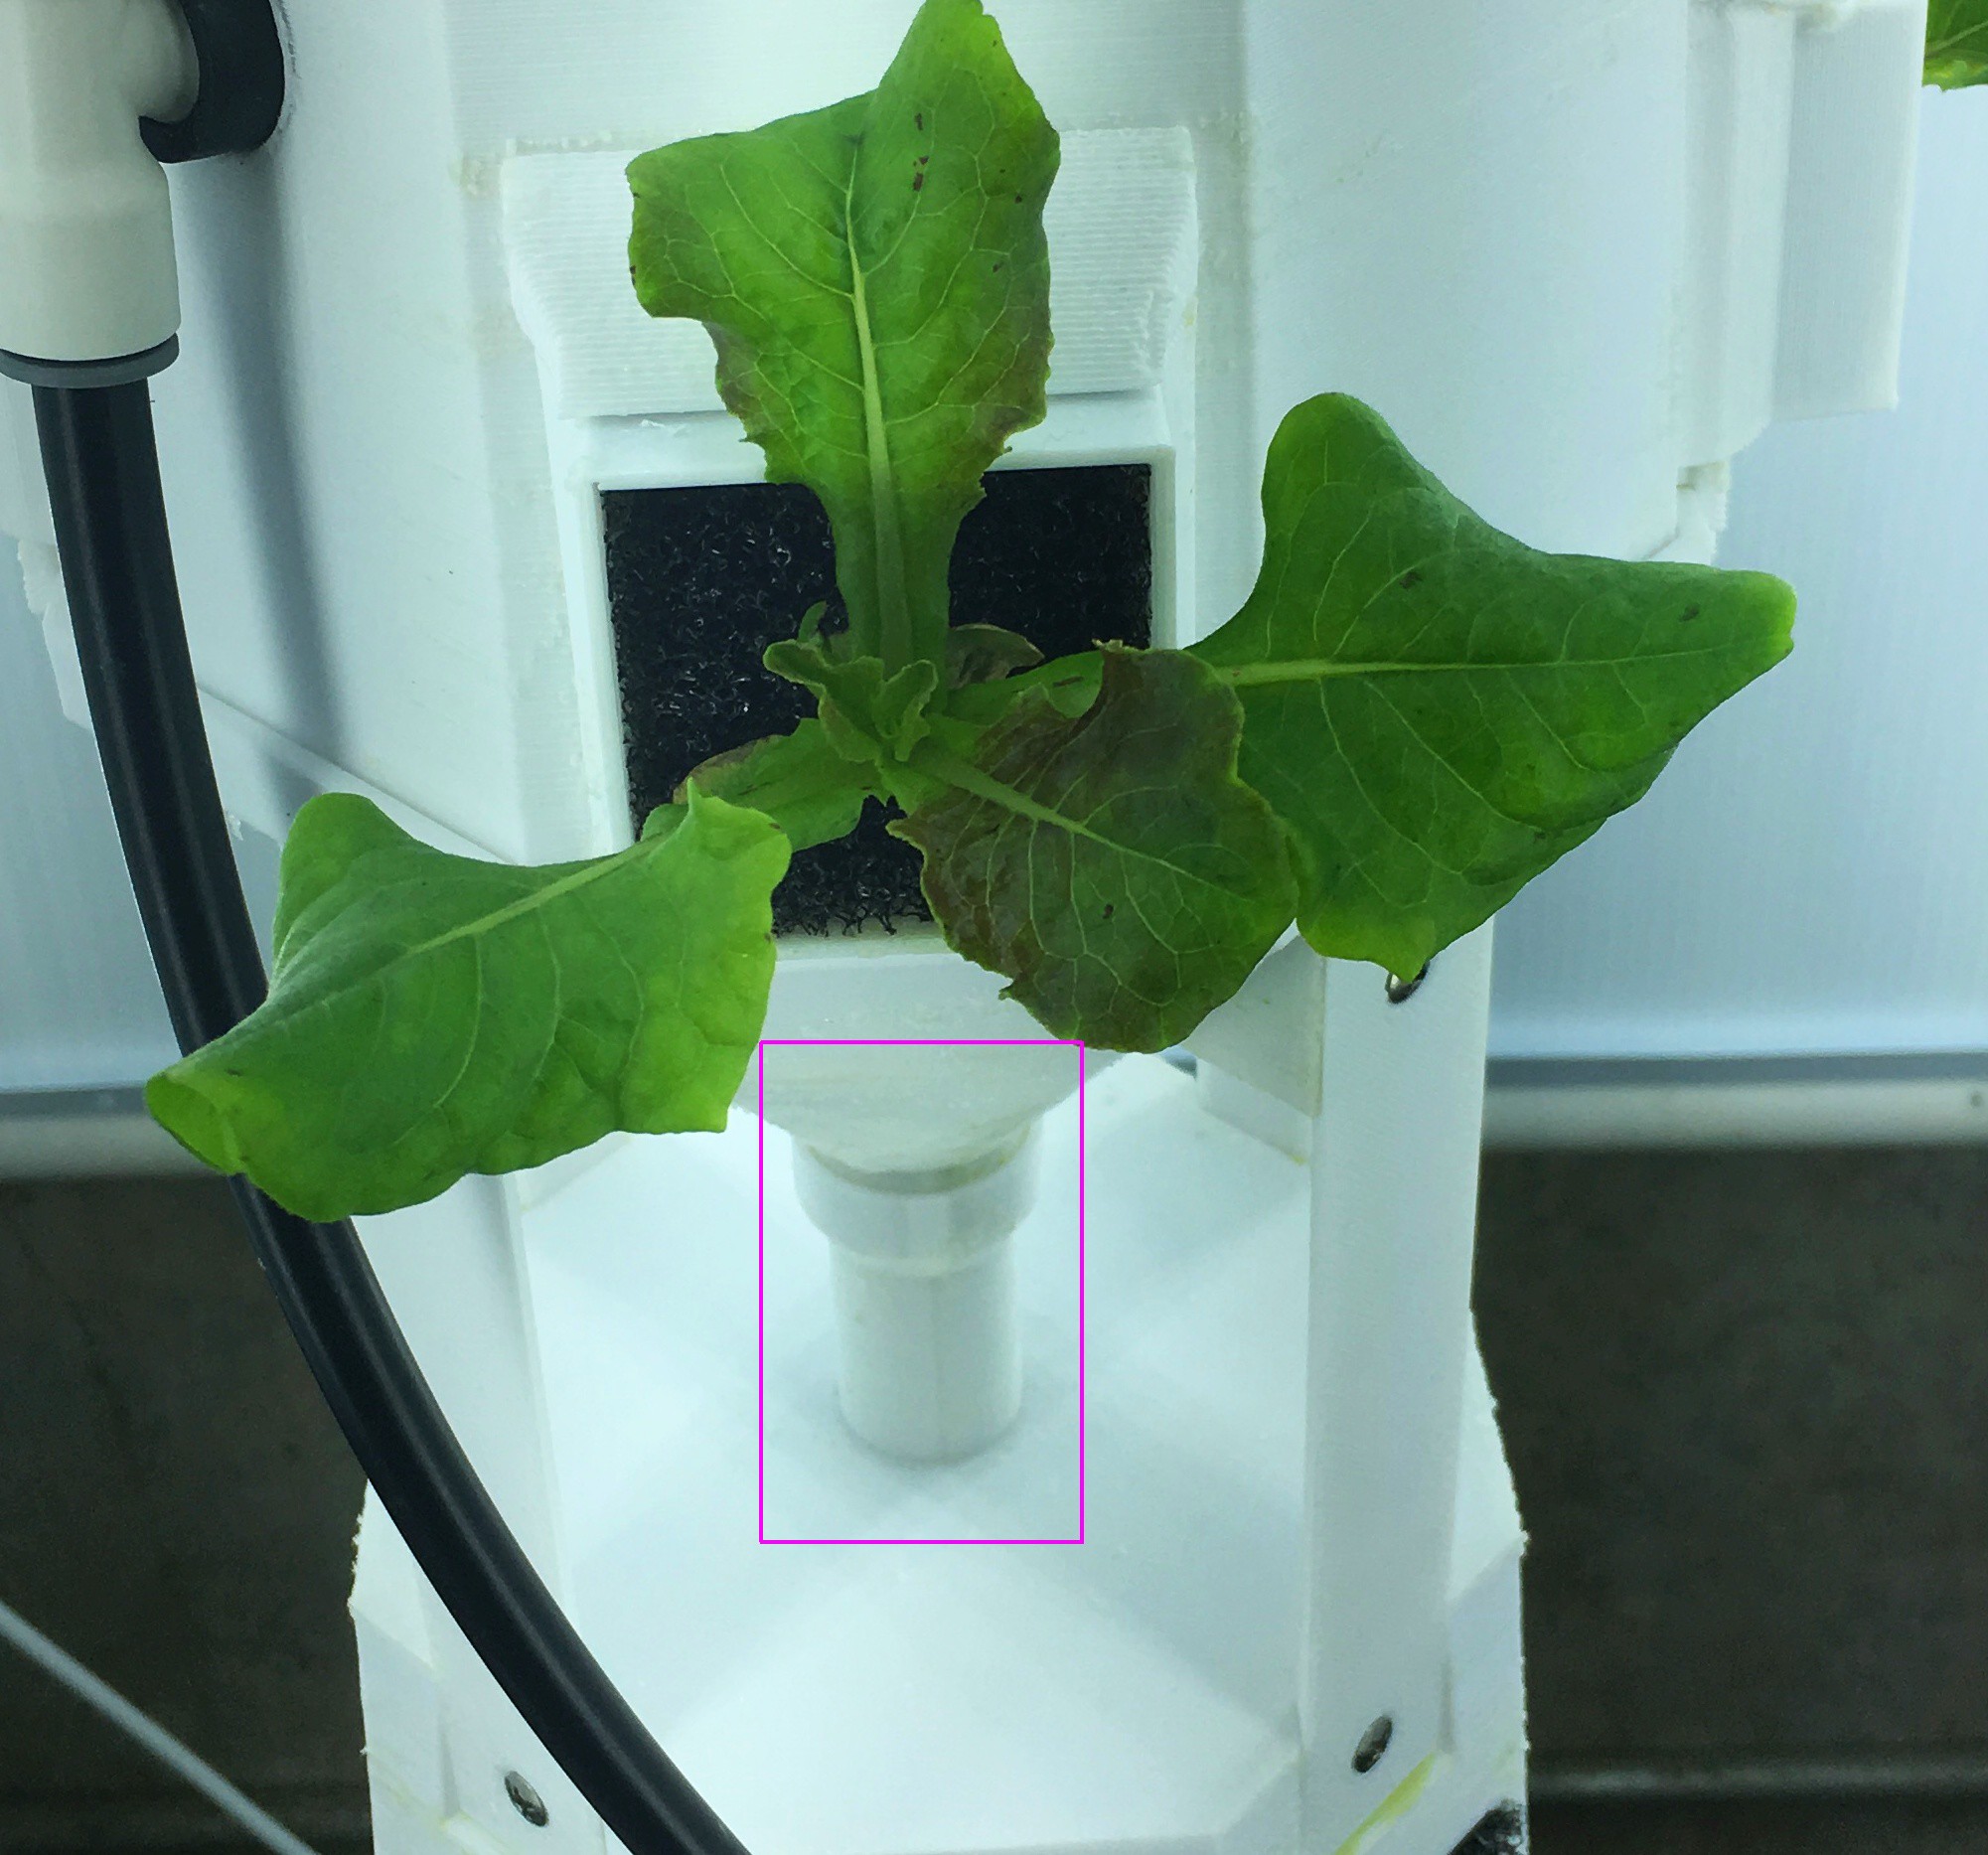
Below I highlighted the tube that connects between levels. This tube can slide down to expose the roots so that they can be pruned and pushed back up into the pod above. Without pruning, the plants expend a lot of energy growing VERY long roots that tangle things up between pods.
The final photo below shows some delicious Buttercrunch leaves freshly picked from the system. While they are great right off the plant, I've found that they crisp up even better when rinsed and stored in a closed contained in the refrigerator. Since they are picked fresh, they last a really long time in the fridge.
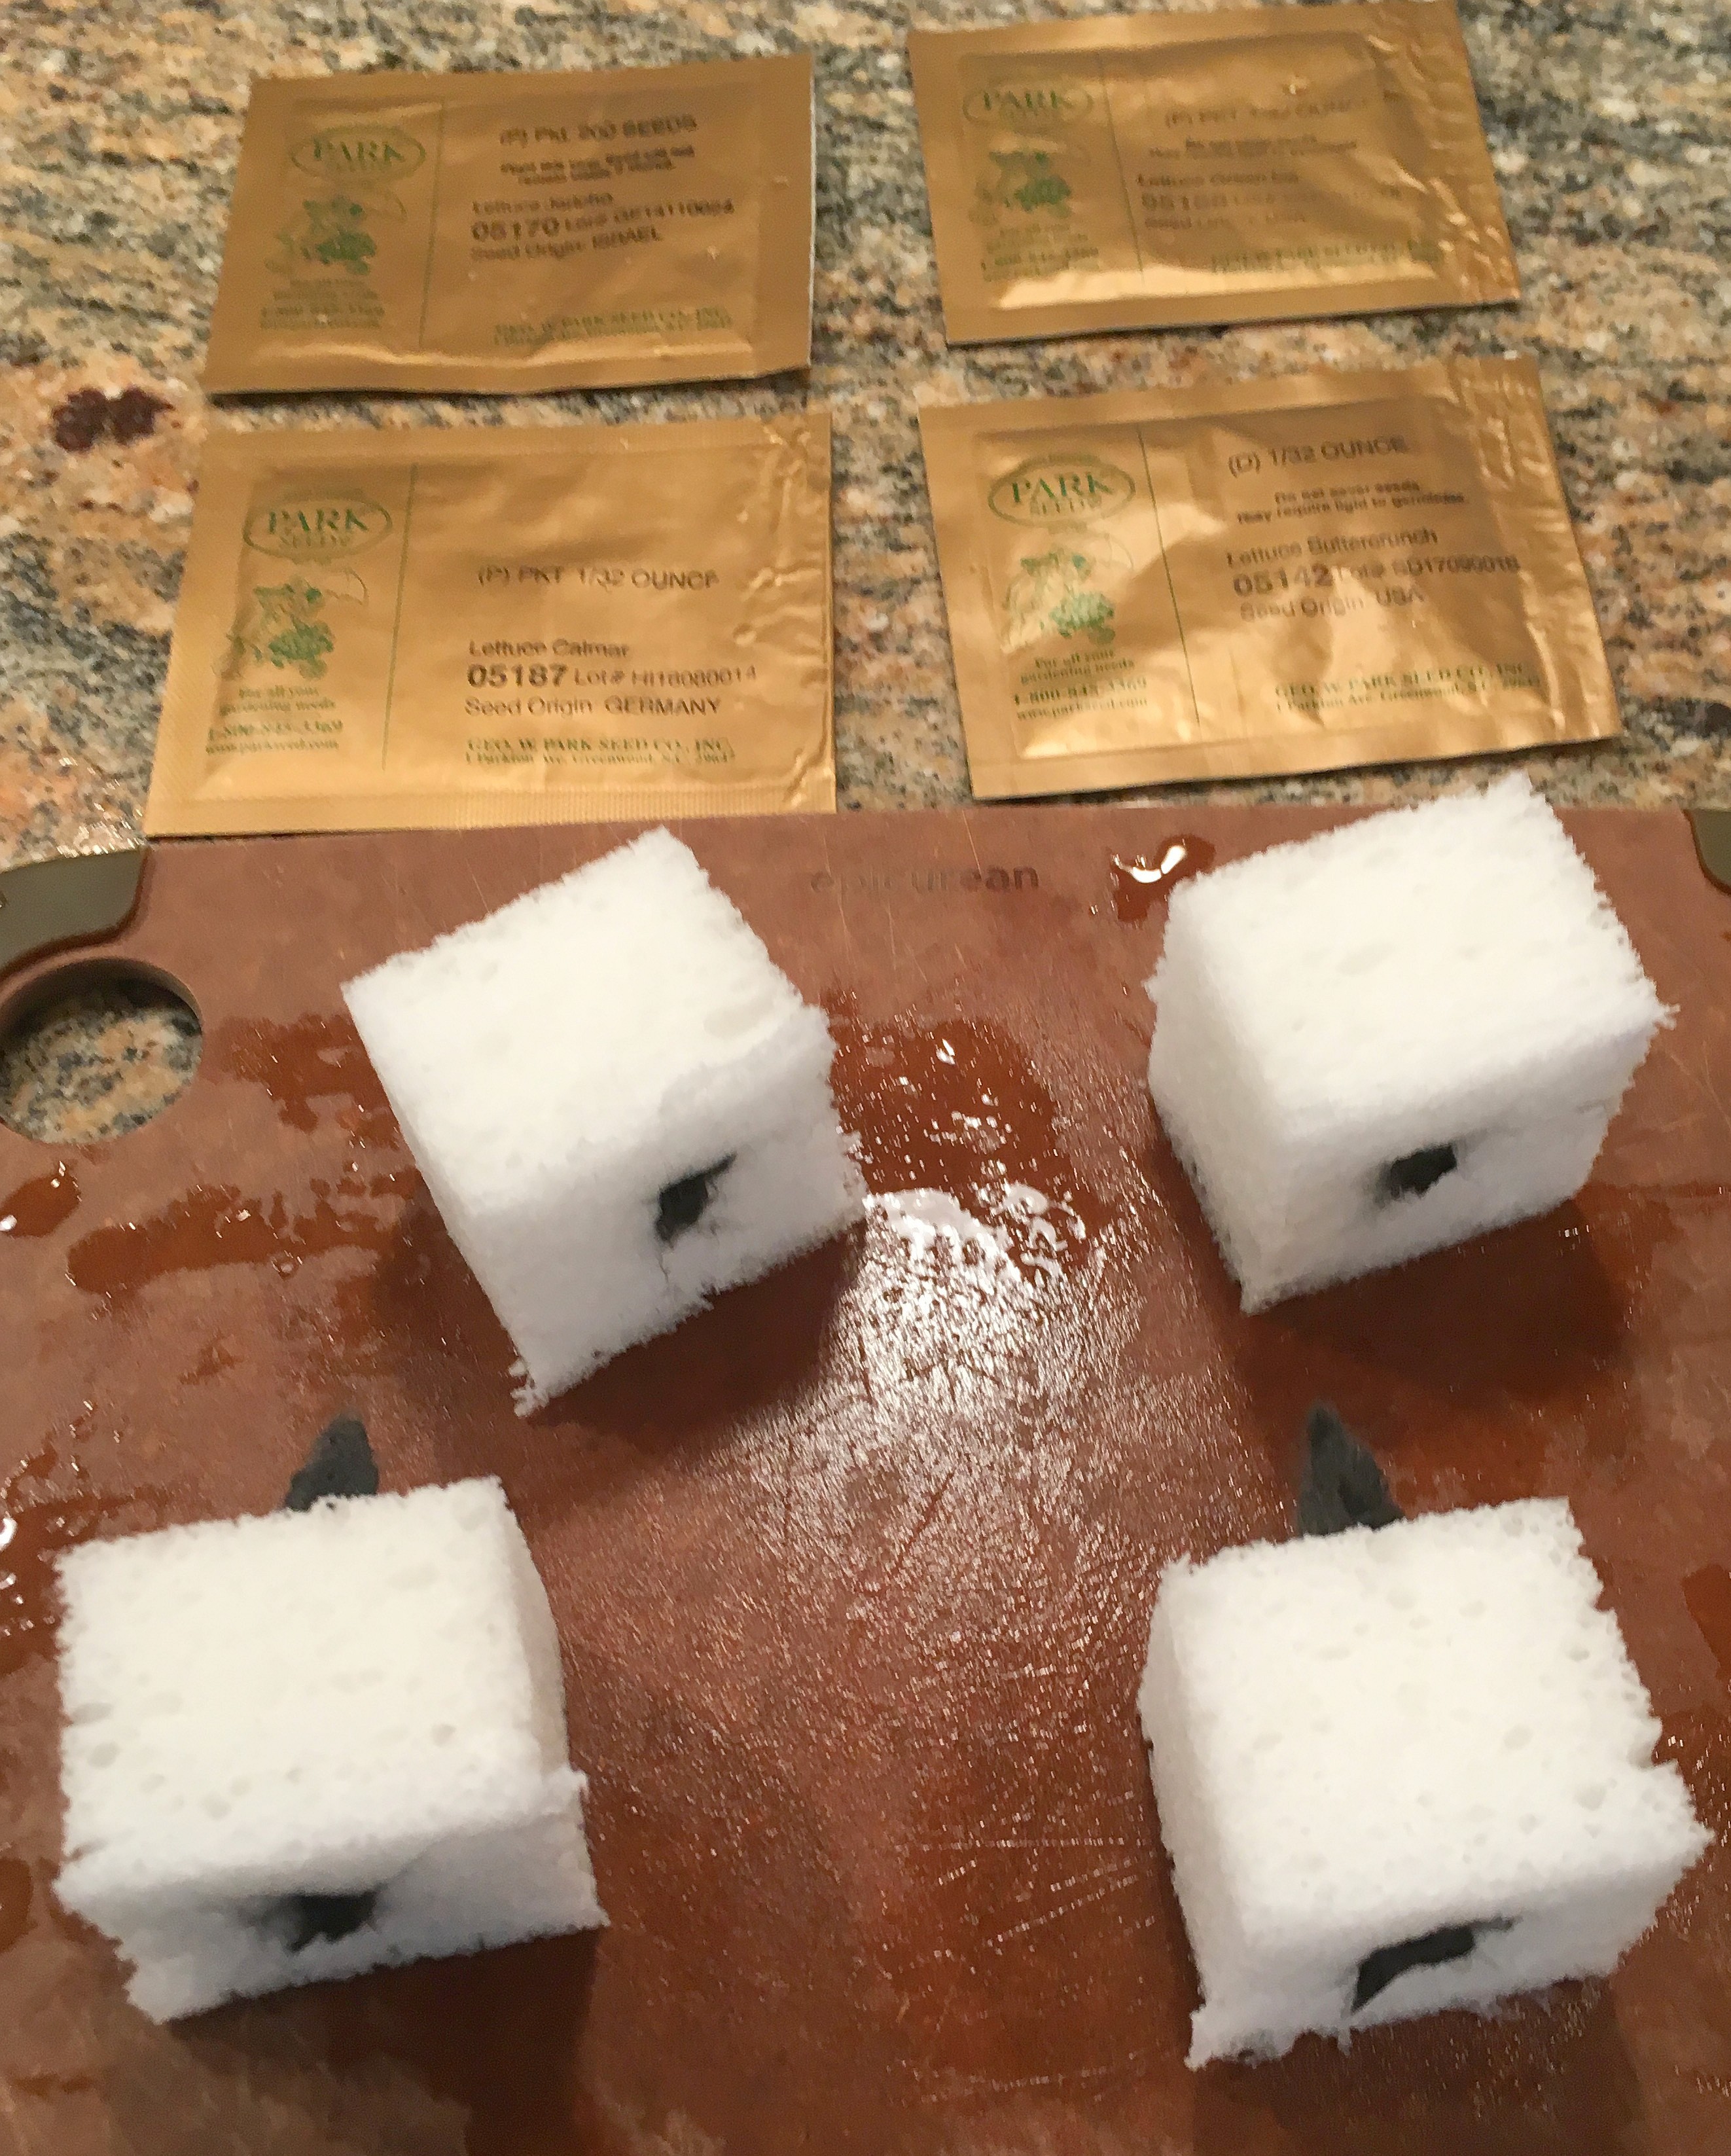
After several days of software and mechanical tweaking, today I started a new crop of lettuce. I planted 3 seeds of each of 4 different kinds of lettuce in the carbonized bamboo fiber wick at the center of each "SOWqWICK" sponge block. The seeds should sprout in about 3 days. Assuming they actually sprout, I'll let the seedlings grow about a week and cull the smaller ones, leaving one plant per block. When the roots poke through to the back, the plants are moved down to a free spot in one of the pods below.
Lettuce seeds are very small, so tweezers are required for planting. Note that with my middle-age eyes, I need to use a magnifying visor to see the seeds well enough to grab them. The seeds are initially soaked in a shallow bowl to moisten them and increase the chance of germination. You have to actively sink the seeds, since they will float on top due to surface tension. Only seeds that sink the the bottom are used. If they won't sink, then they probably won't germinate.
After dampening the sponge blocks in water, use the tweezers to pull the seeds from the bottom of the bowl and plant them slightly apart in the fiber portion of the block. One end of the seed is very pointy and the other end is slightly rounded. The pointy end goes down. If you plant them pointy side up, the seeds may still still sprout, but the root may dry out and die before it can grow back into the fiber wick.
I'll post an update at the end the week with any progress. Note that this is the first time that I am testing the cellulose sponge blocks instead of the reticulated foam blocks, so the planting experiment could fail.
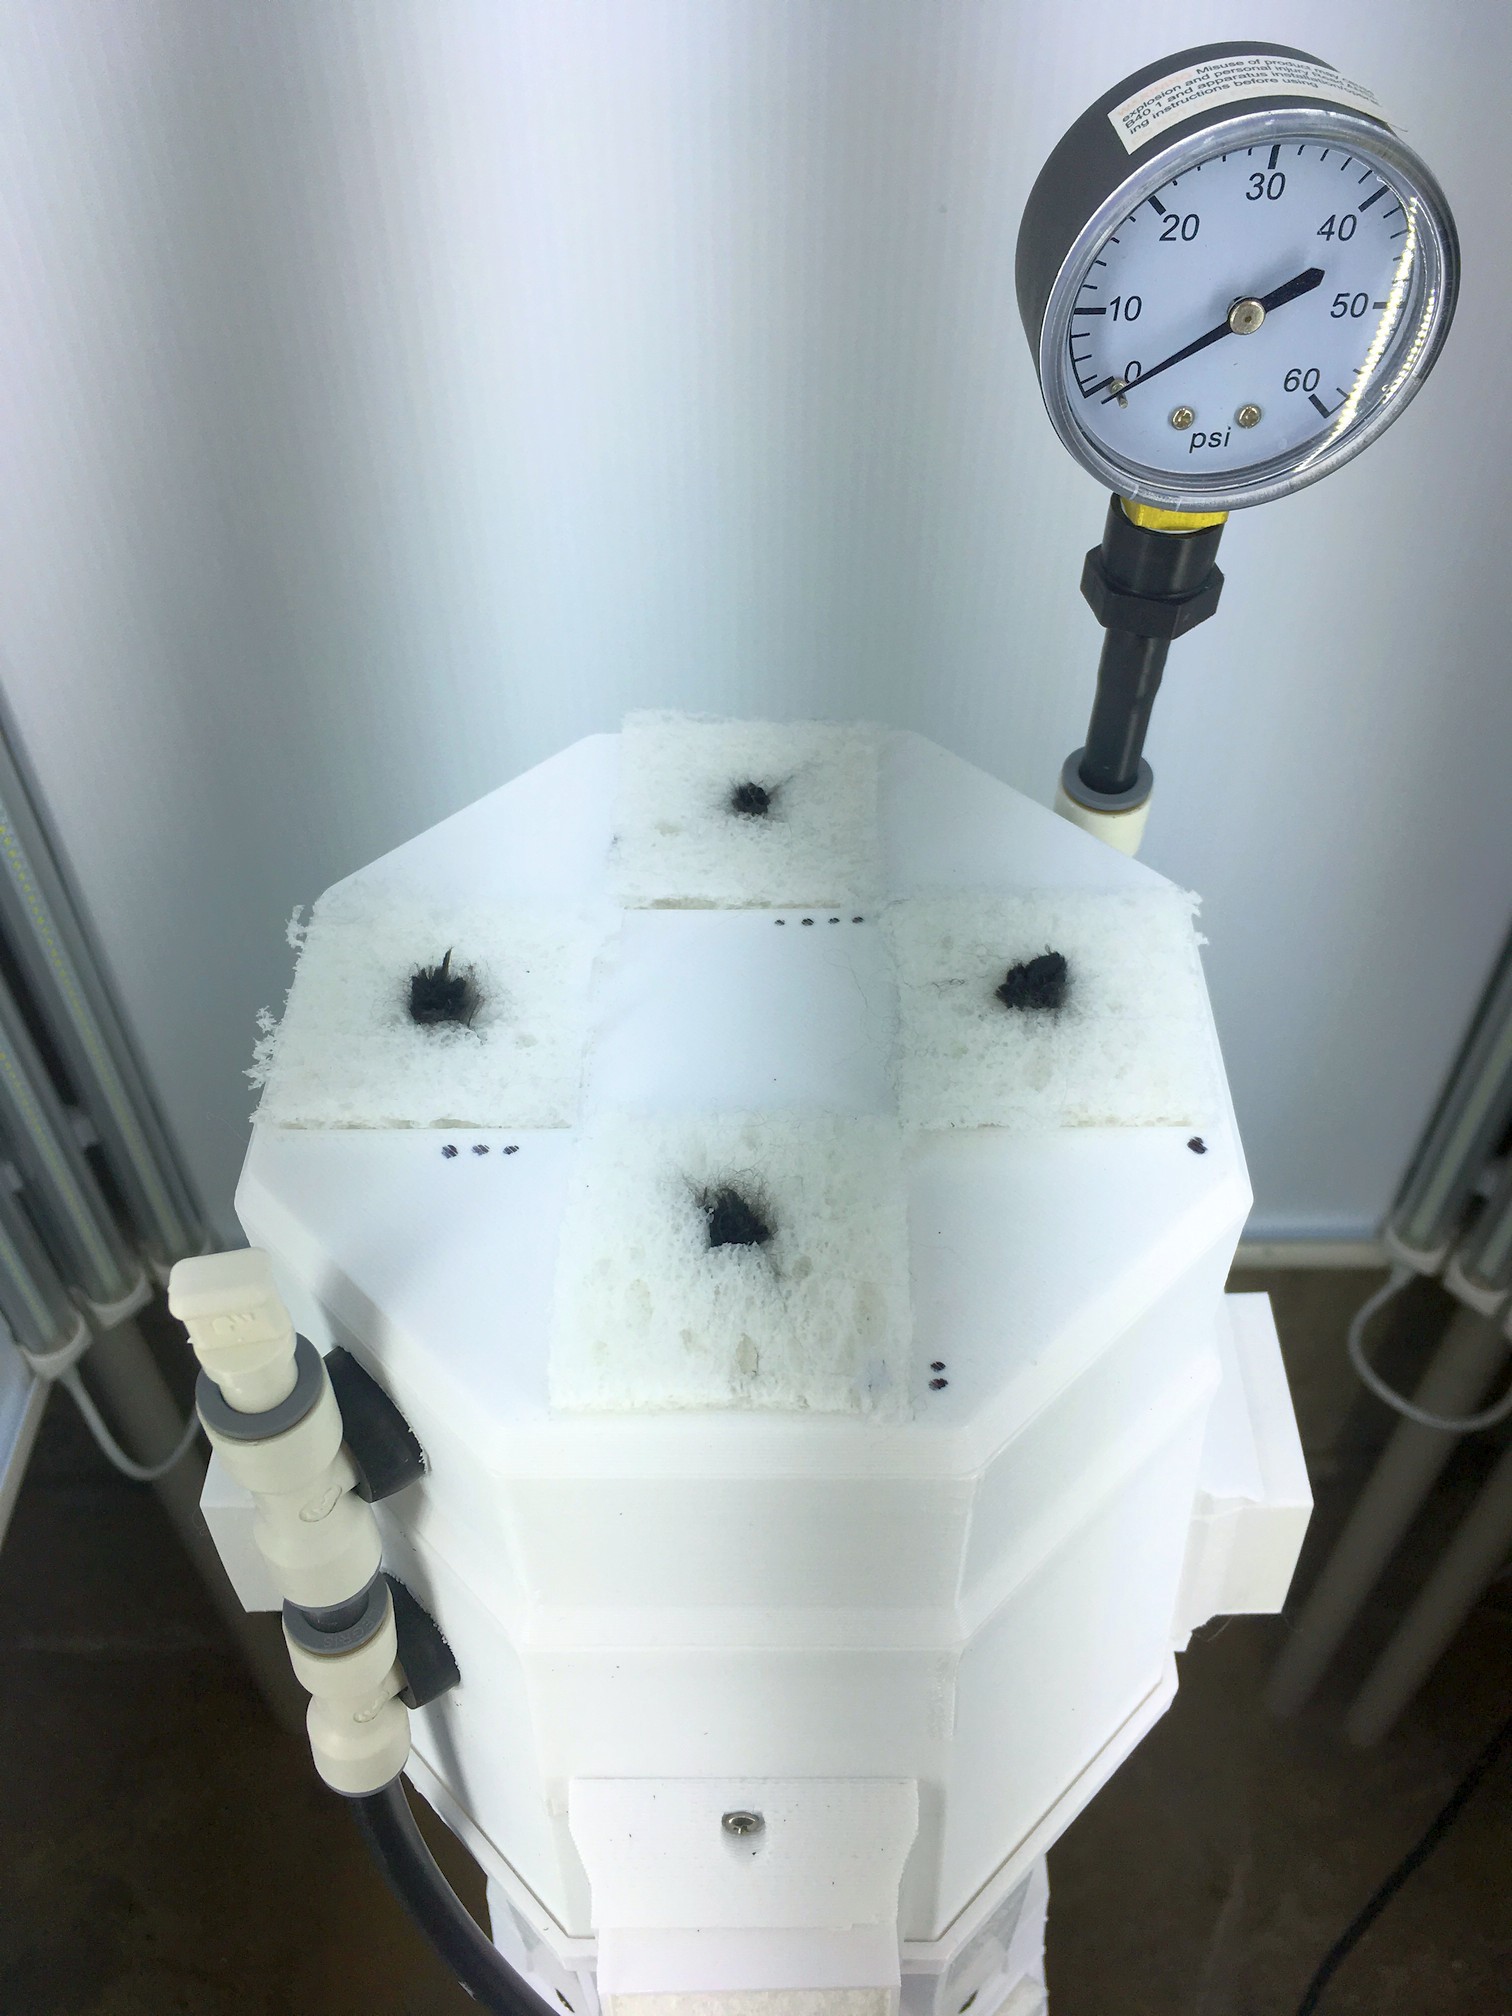
I am in the initial wet testing stage for the newest version of the system which is shown below. I'm just testing a two pod system for now. There are a few new bits:
I added brackets above the plant holders to stop heavy plants from falling out.
I 3D printed a cover for the Raspberry PI and controller so that they don't get dripped on.
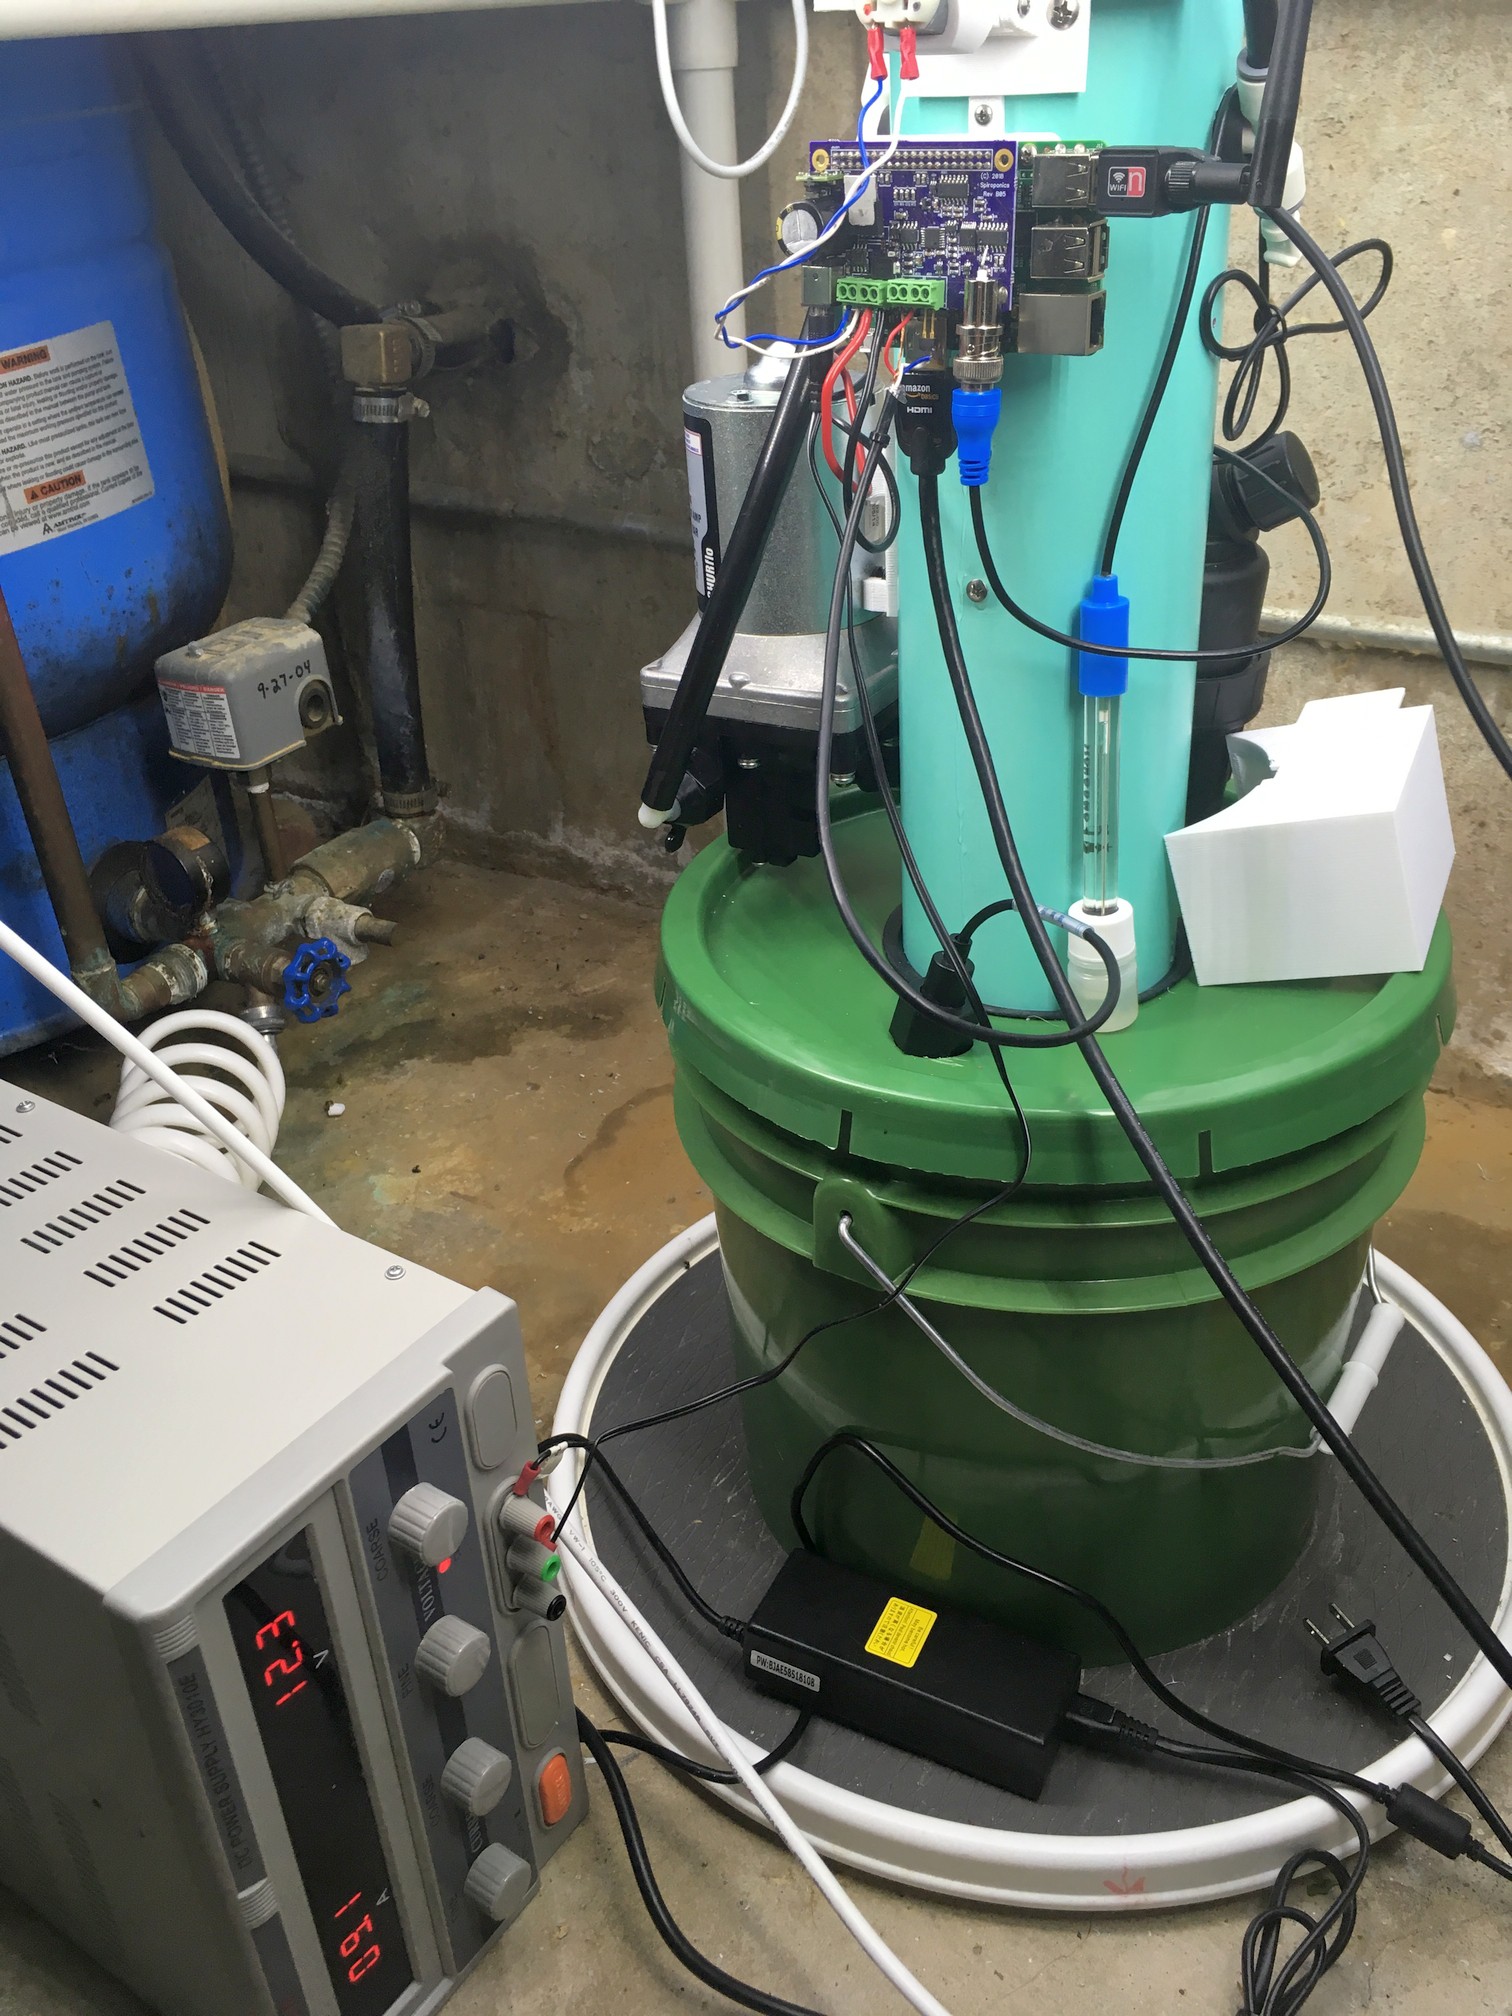
The picture below shows the setup I used for debugging a system crash issue that arose when running one minute spray cycles with the real pump and valve. It turns out that when you run the pump for 30 seconds every minute, it gets a little warm, draws enough current to overwhelm the power brick, and crashes the Raspberry Pi. I've got a beefier power brick coming that should solve the problem.
I'm not a big kale fan, but a neighbor told me that this was the best kale she'd ever had. I'll have to take her word for it. It's Dwarf Siberian Kale ( https://www.edenbrothers.com/store/kale-seeds-dwarf-siberian.html ). As you can see from the picture, the plants respond well to the stems being picked one at a time. The only reason that I pulled it from the system is that it was growing into the lights. This was with an earlier version of the lighting system. With the LED tubes, there is about a foot more space in the corners.
I'm currently working on the Python software to interface with the EC/pH/Control board and also developing the web interface.
The web interface, shown below, uses webiopi. It's fairly programmer friendly and so far has been reliable. The graph is from plotly , an open source javascript graphing library. The graphs can be zoomed and panned to look at areas of interest. A new point is added to the graph at the end of each spray cycle. The gaps in the plot are from when the control program was not running.
For testing, the spray cycles are running every minute. As you can see in the second picture, everything is sitting on my desk, so it's only running simulated spray cycles.
The approximately linear increase in conductivity over time is due to water evaporation. Since only pure water evaporates, the density of the dissolved ions left in solution increases, and that increases the conductivity.
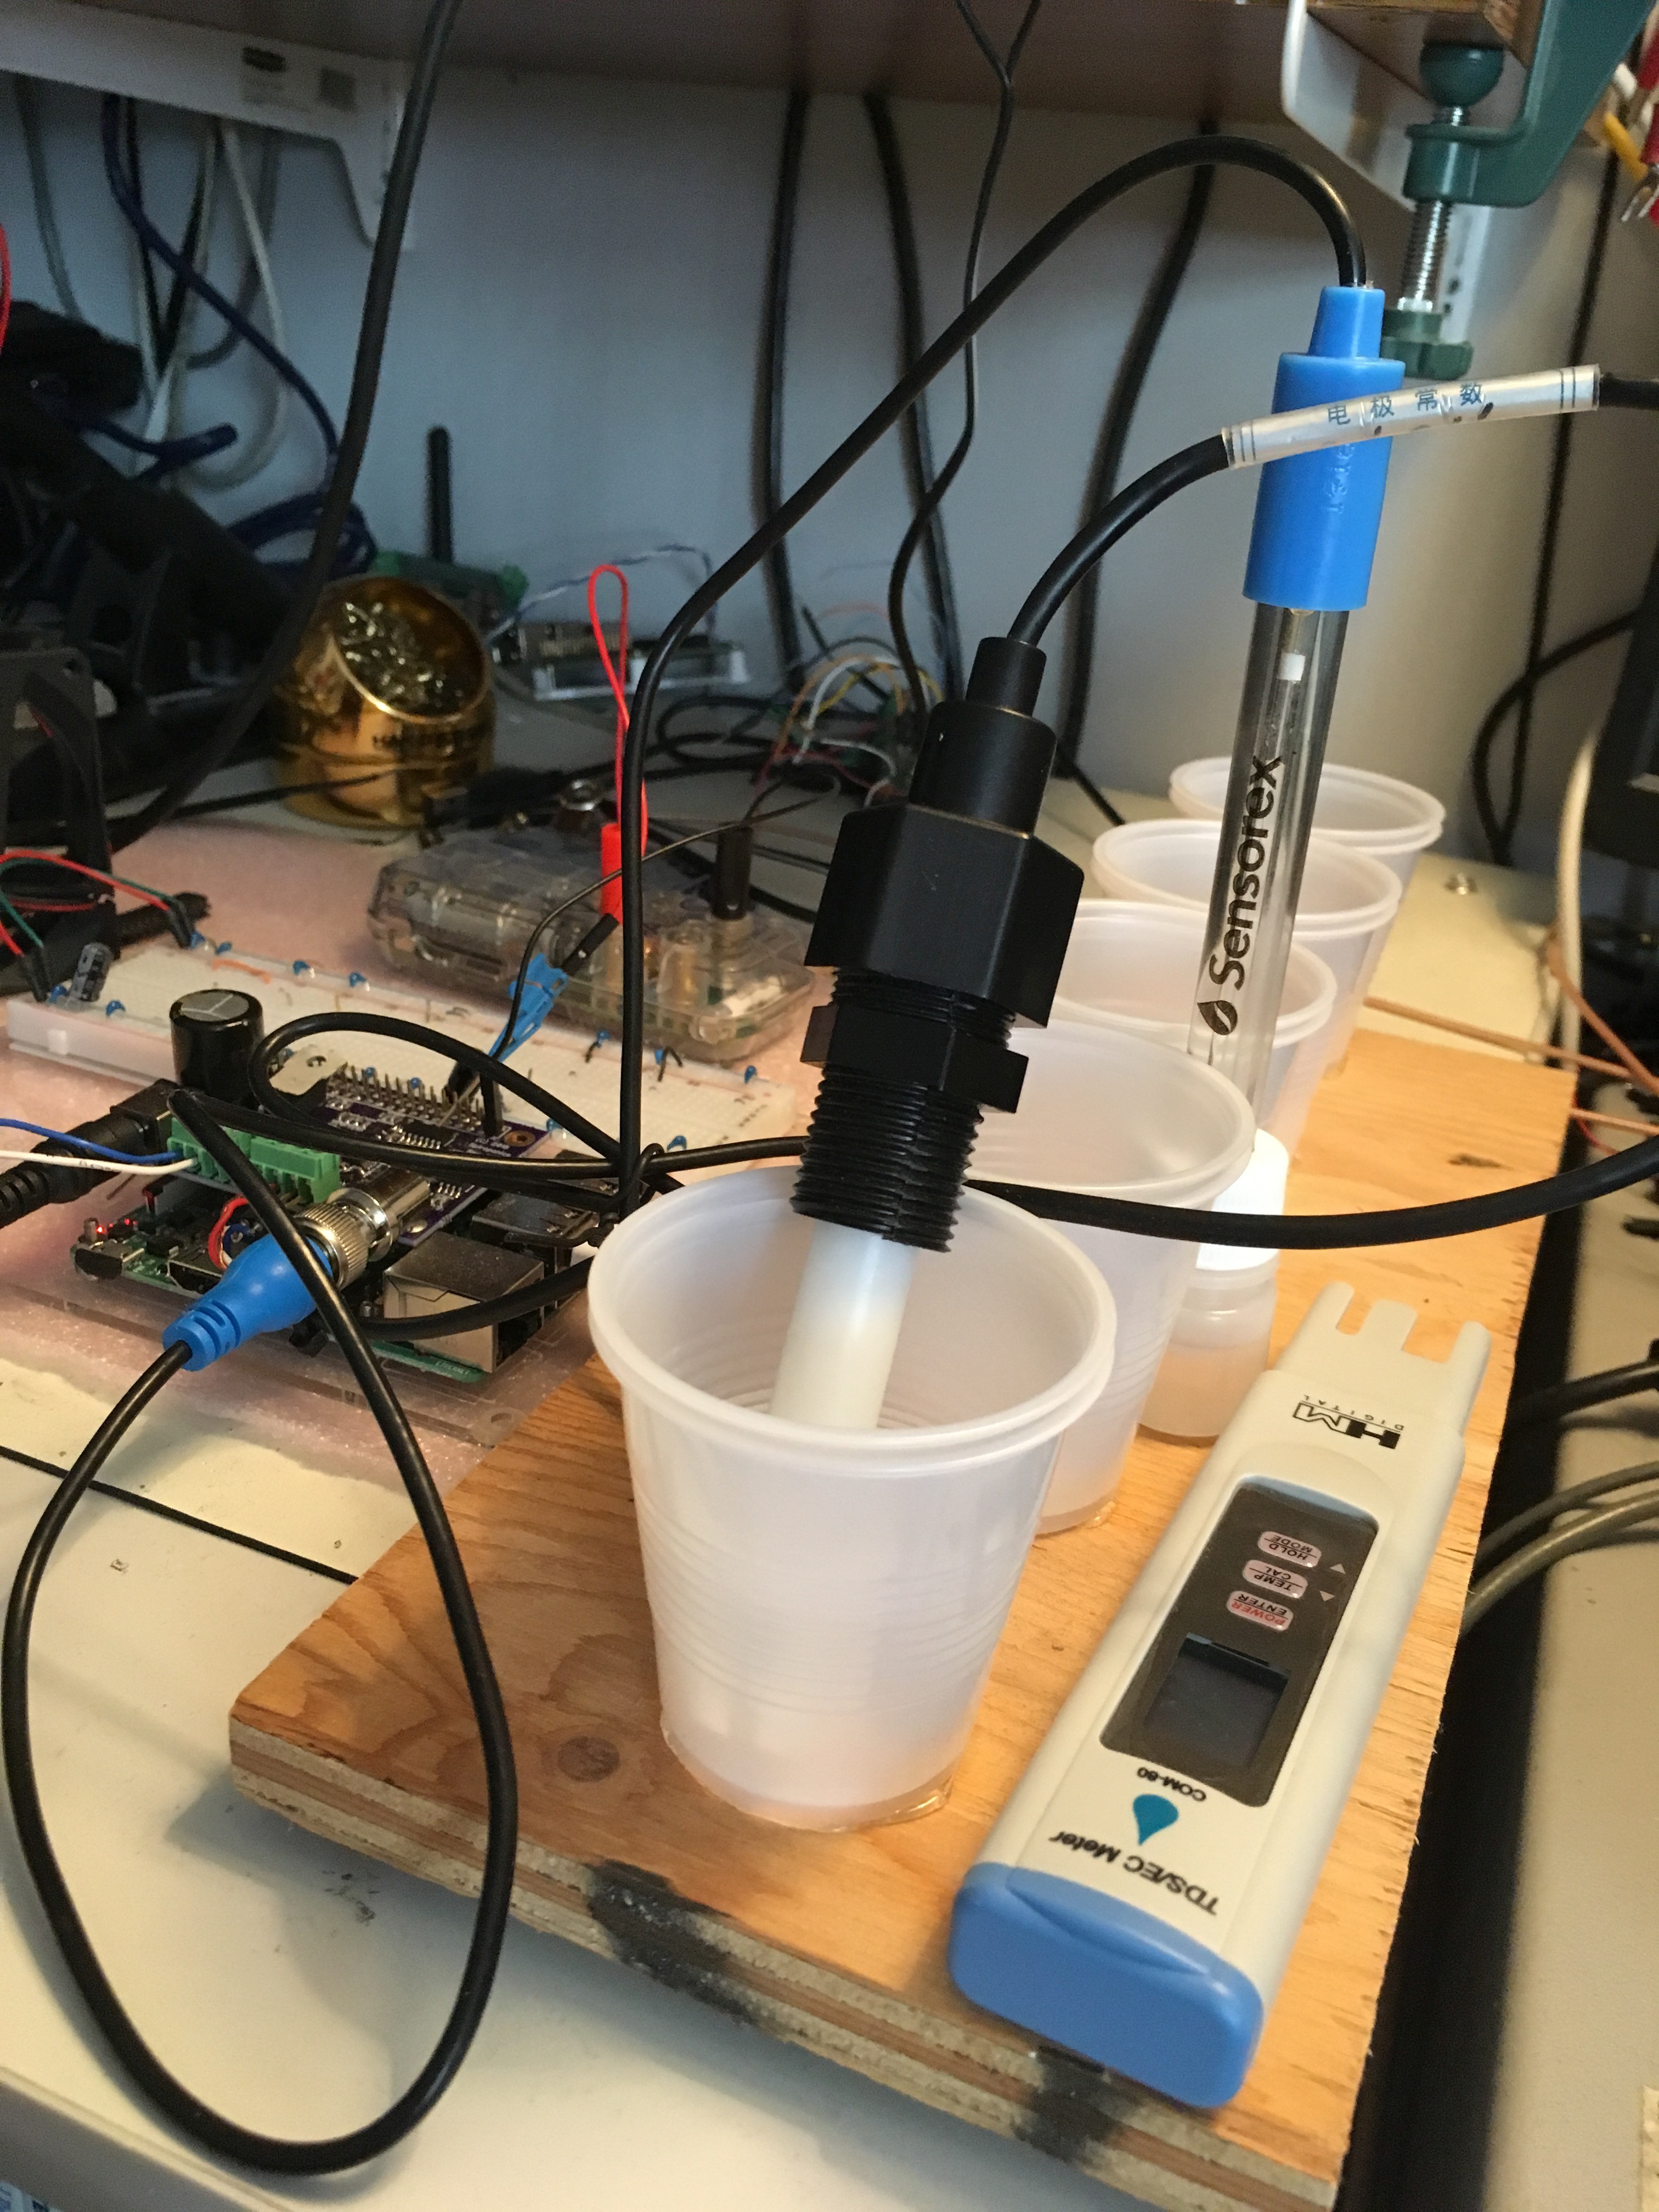
I've made an EC calibration setup with solutions of various conductivities in cups that are hot melt glued to a base, in order to avoid spills. The pH probe is sitting in a standard pH 4 probe storage solution. The plot above shows that the pH is slightly temperature sensitive. A thermistor built in to the EC probe measures the temperature. The solutions are stabilizing to the same slowly changing room temperature.
 Chris Johnson
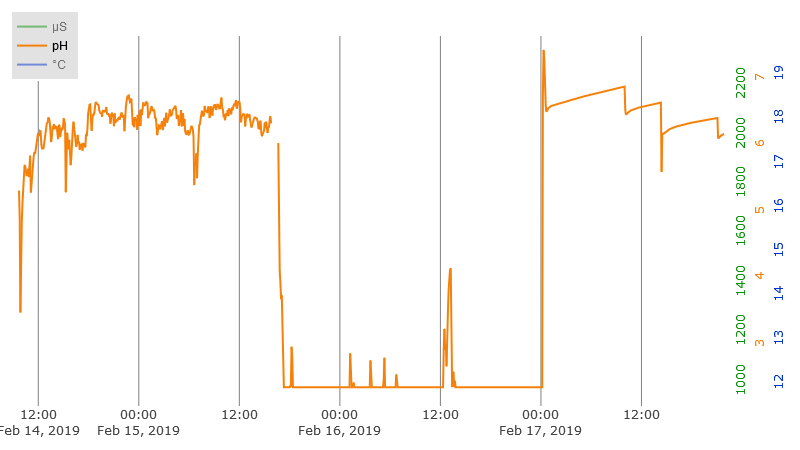
 I also thought this photo which shows a birds eye view of the system was pretty cool. The white spots on the center of the foam blocks are from the water in the nutrient solution evaporating at the end of the wick, leaving behind the dissolved solids.