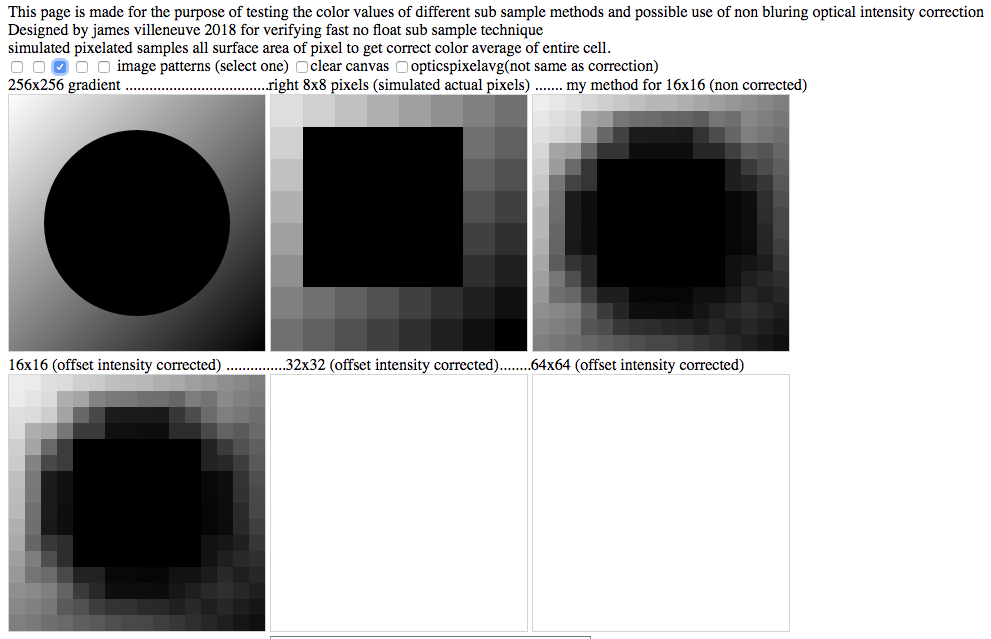
This log contains an image that has errata. specifically image 2 is not correctly show. i updated the algorithm to process image as a surface area so entire 8x8 grid each section is averaged depending on intensity, however the image was still processed using a single point sample. so in this case the top image middle should be only regarded as how a mistake can occur during development of tools, or processes. it has been fixed after testing and was changed within a day.
below is from original log file.
this shows a sample circle, and how the sensors read the data. it shows how useful interpolation can be to get it back (keep in mind that this sensor tool might change in how it looks when it is uploaded, but it does give a good argument of why you want to use interpolation.
Discussions
Become a Hackaday.io Member
Create an account to leave a comment. Already have an account? Log In.