 Pavel
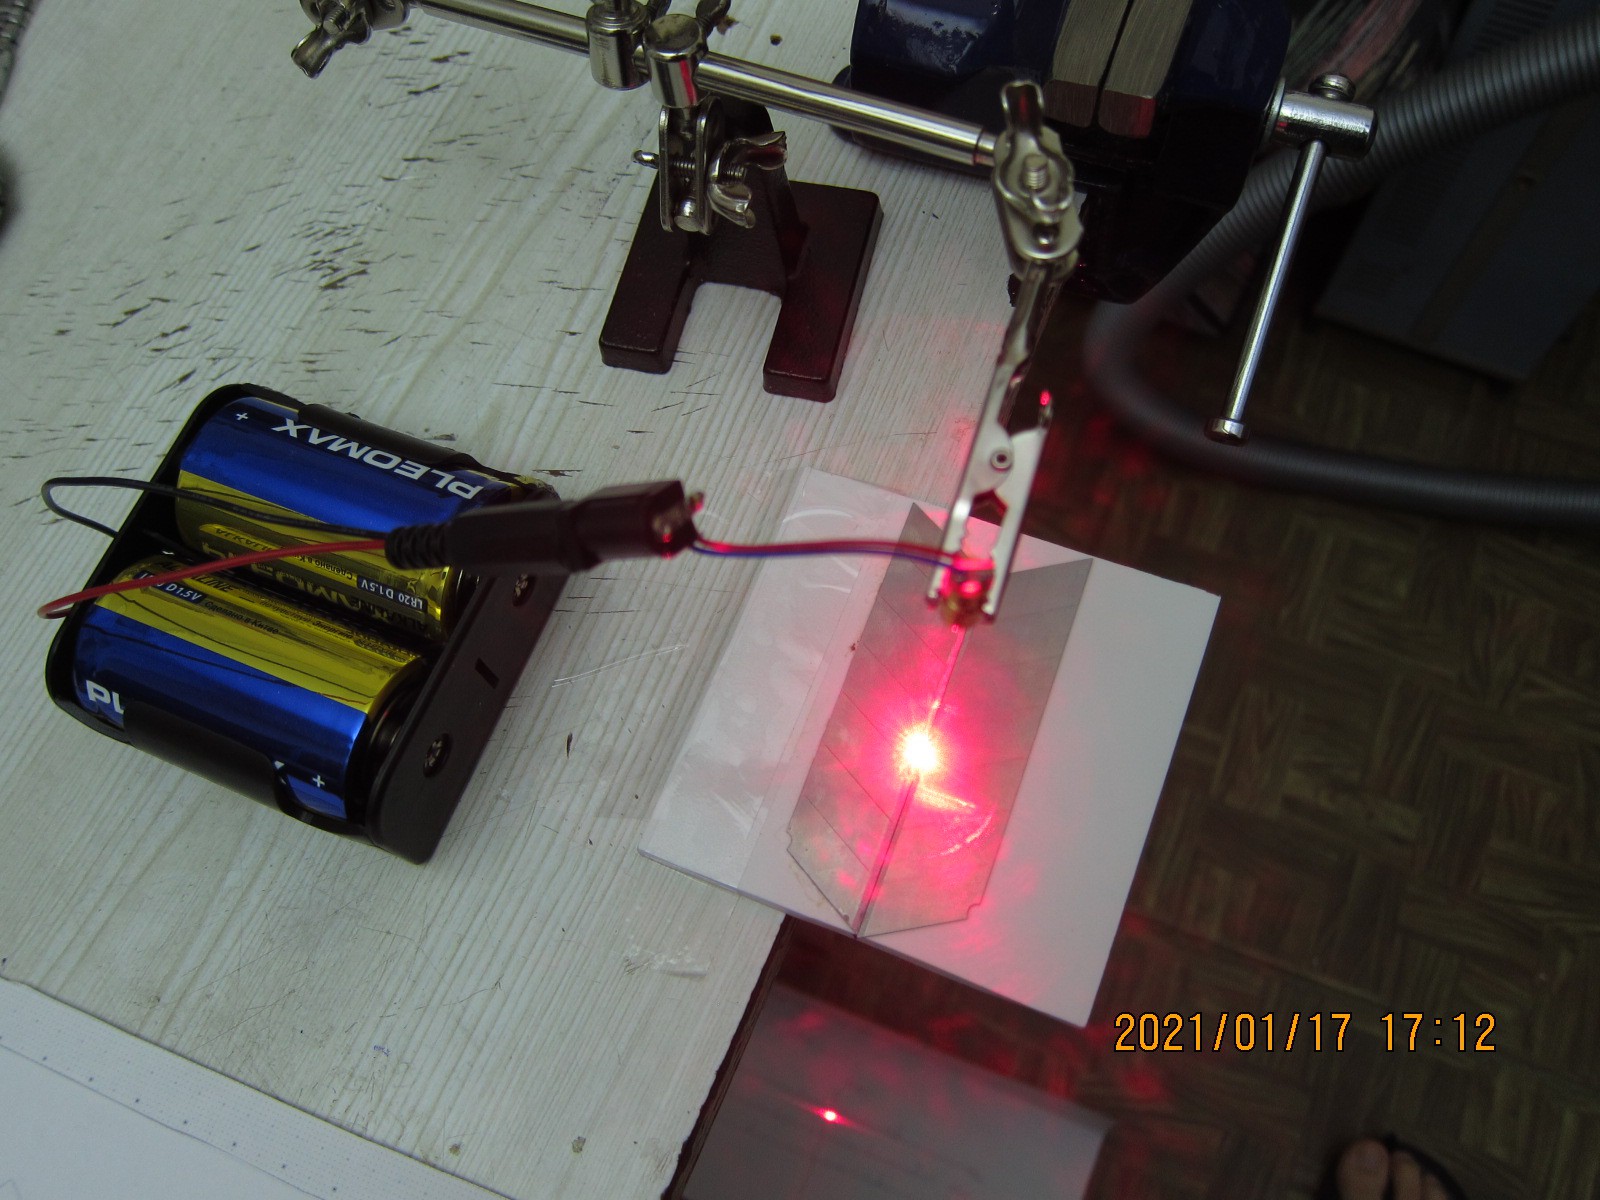
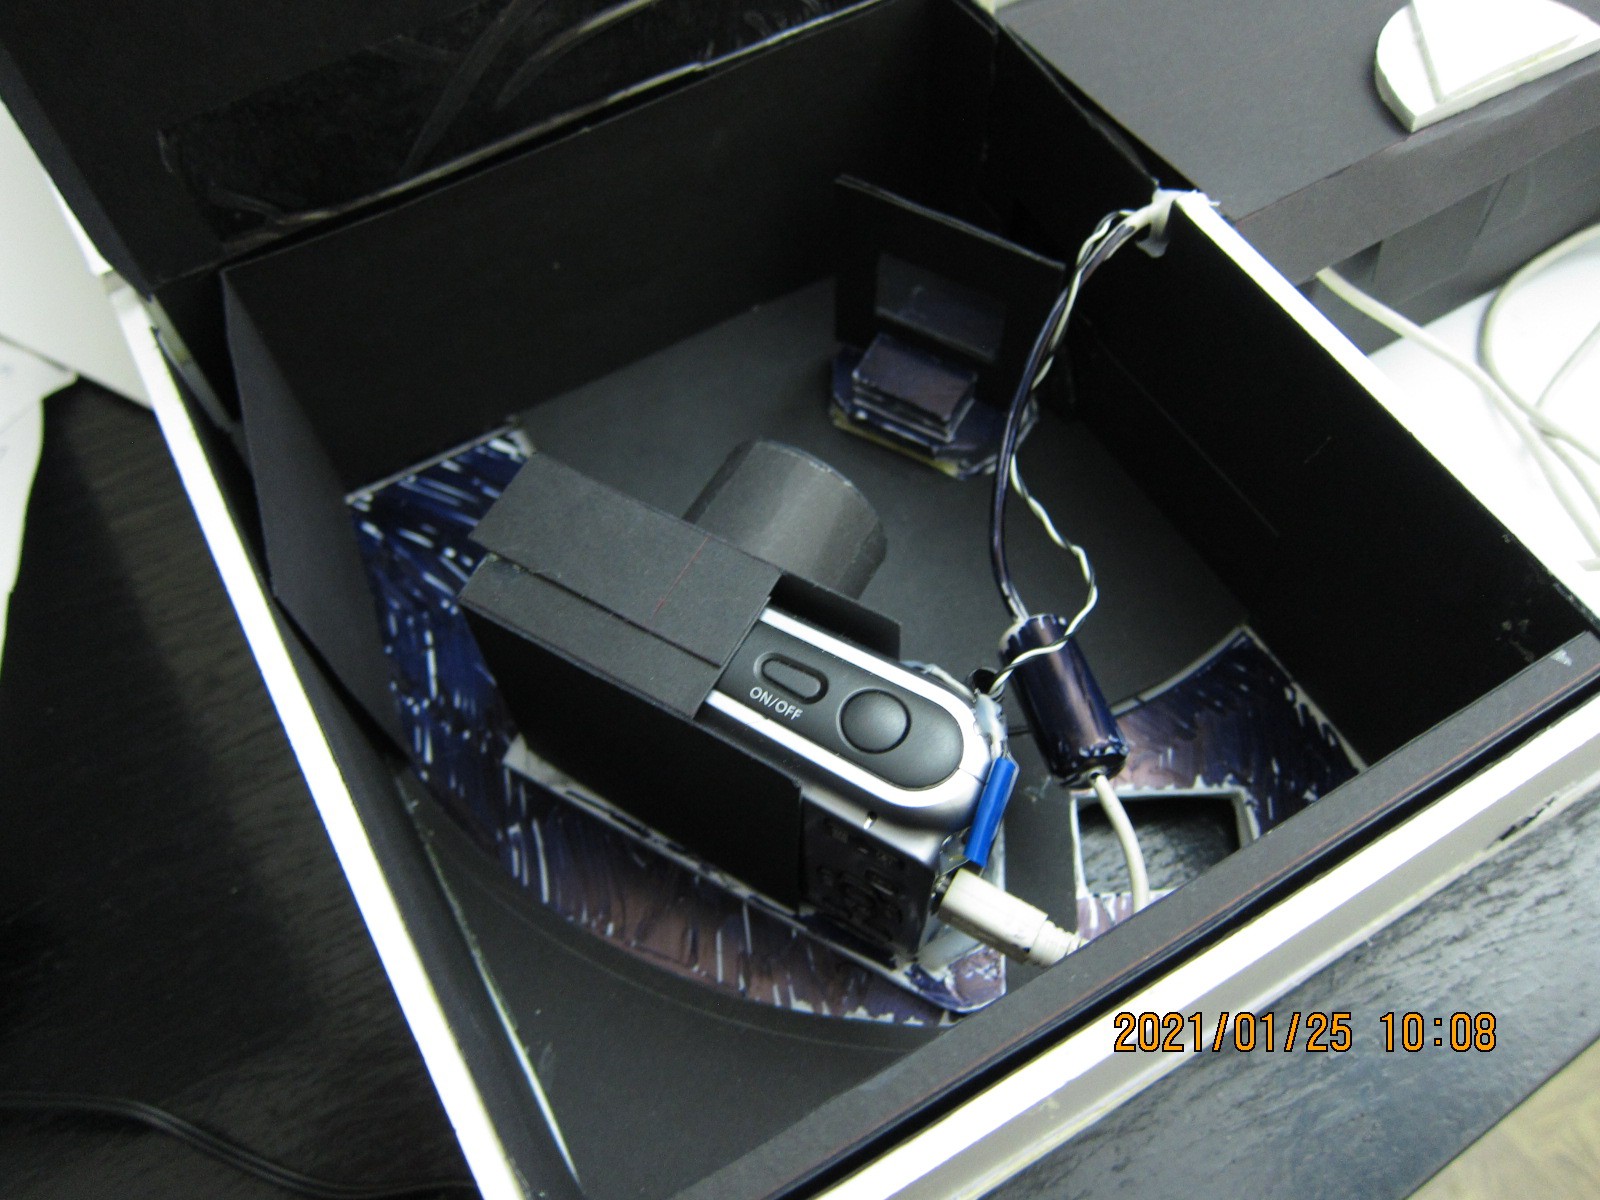
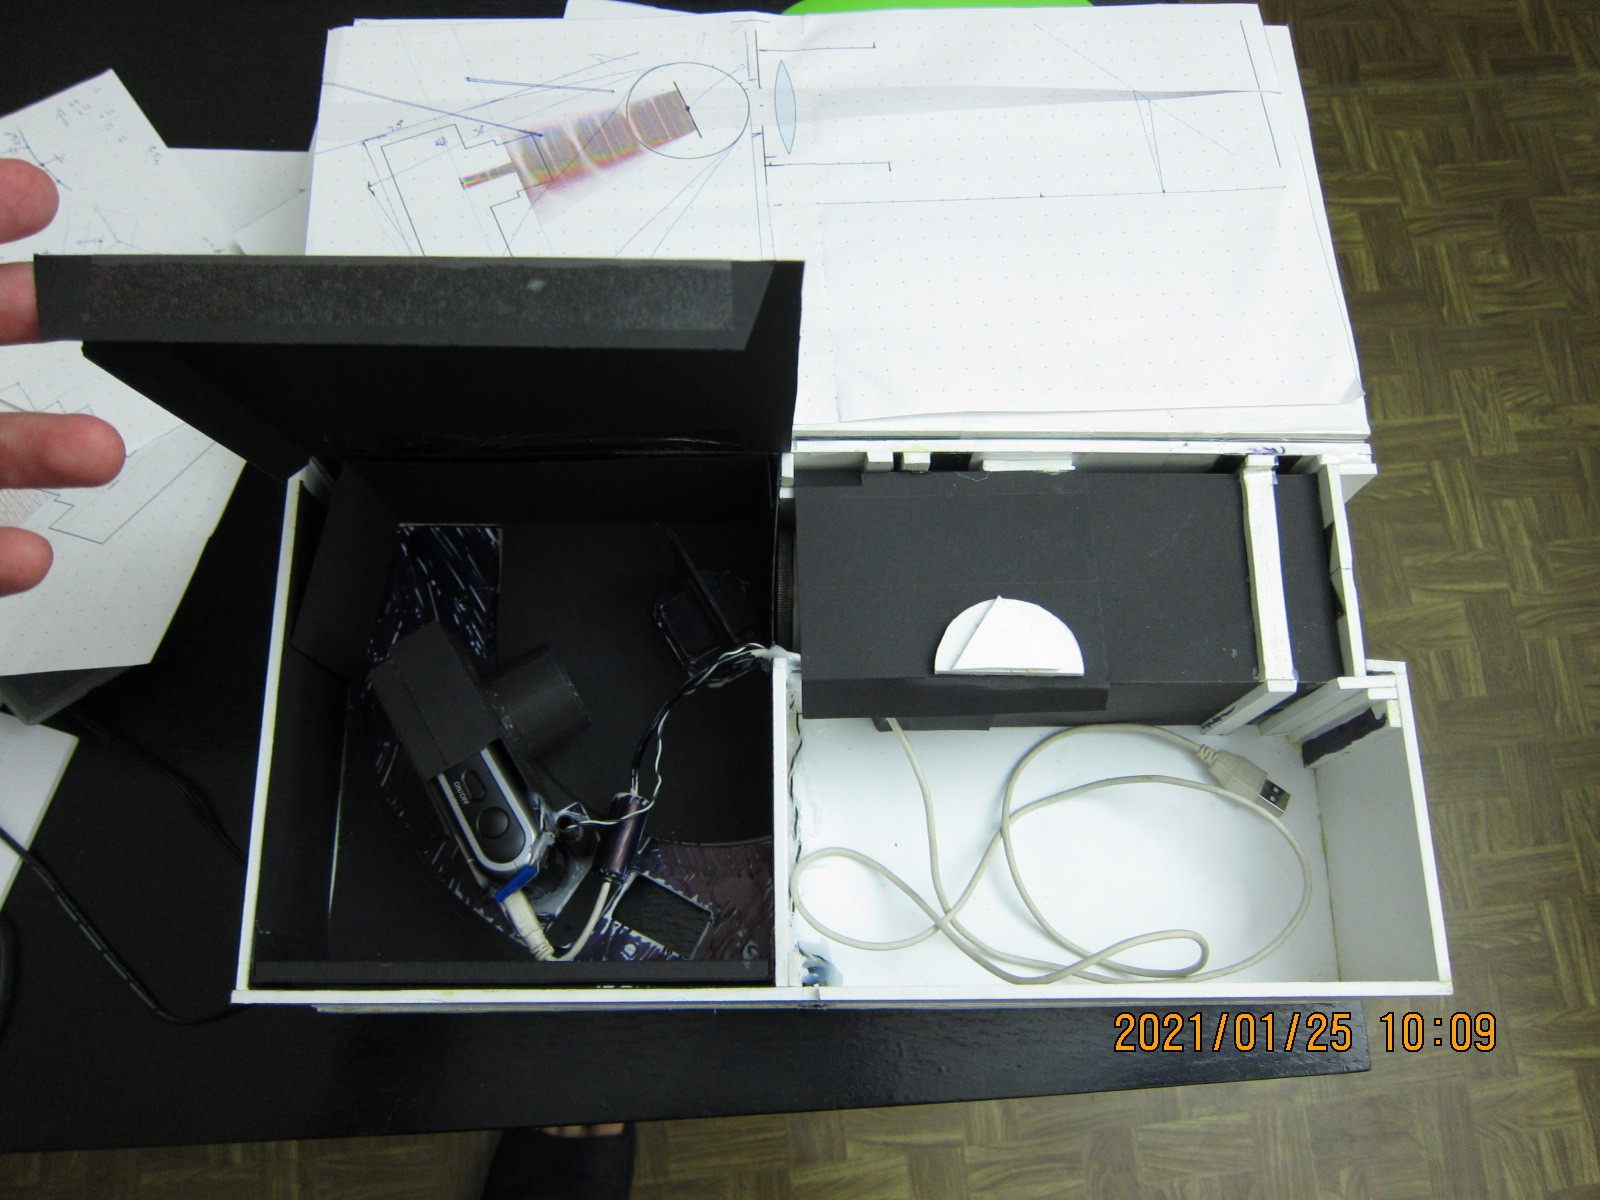
PavelThere are two main parts for this spectrograph: the hand-made optics and means of capturing spectra, in this case a photo camera. Also there is little addon for calibrating by wavelength -- the neon glow lamp.
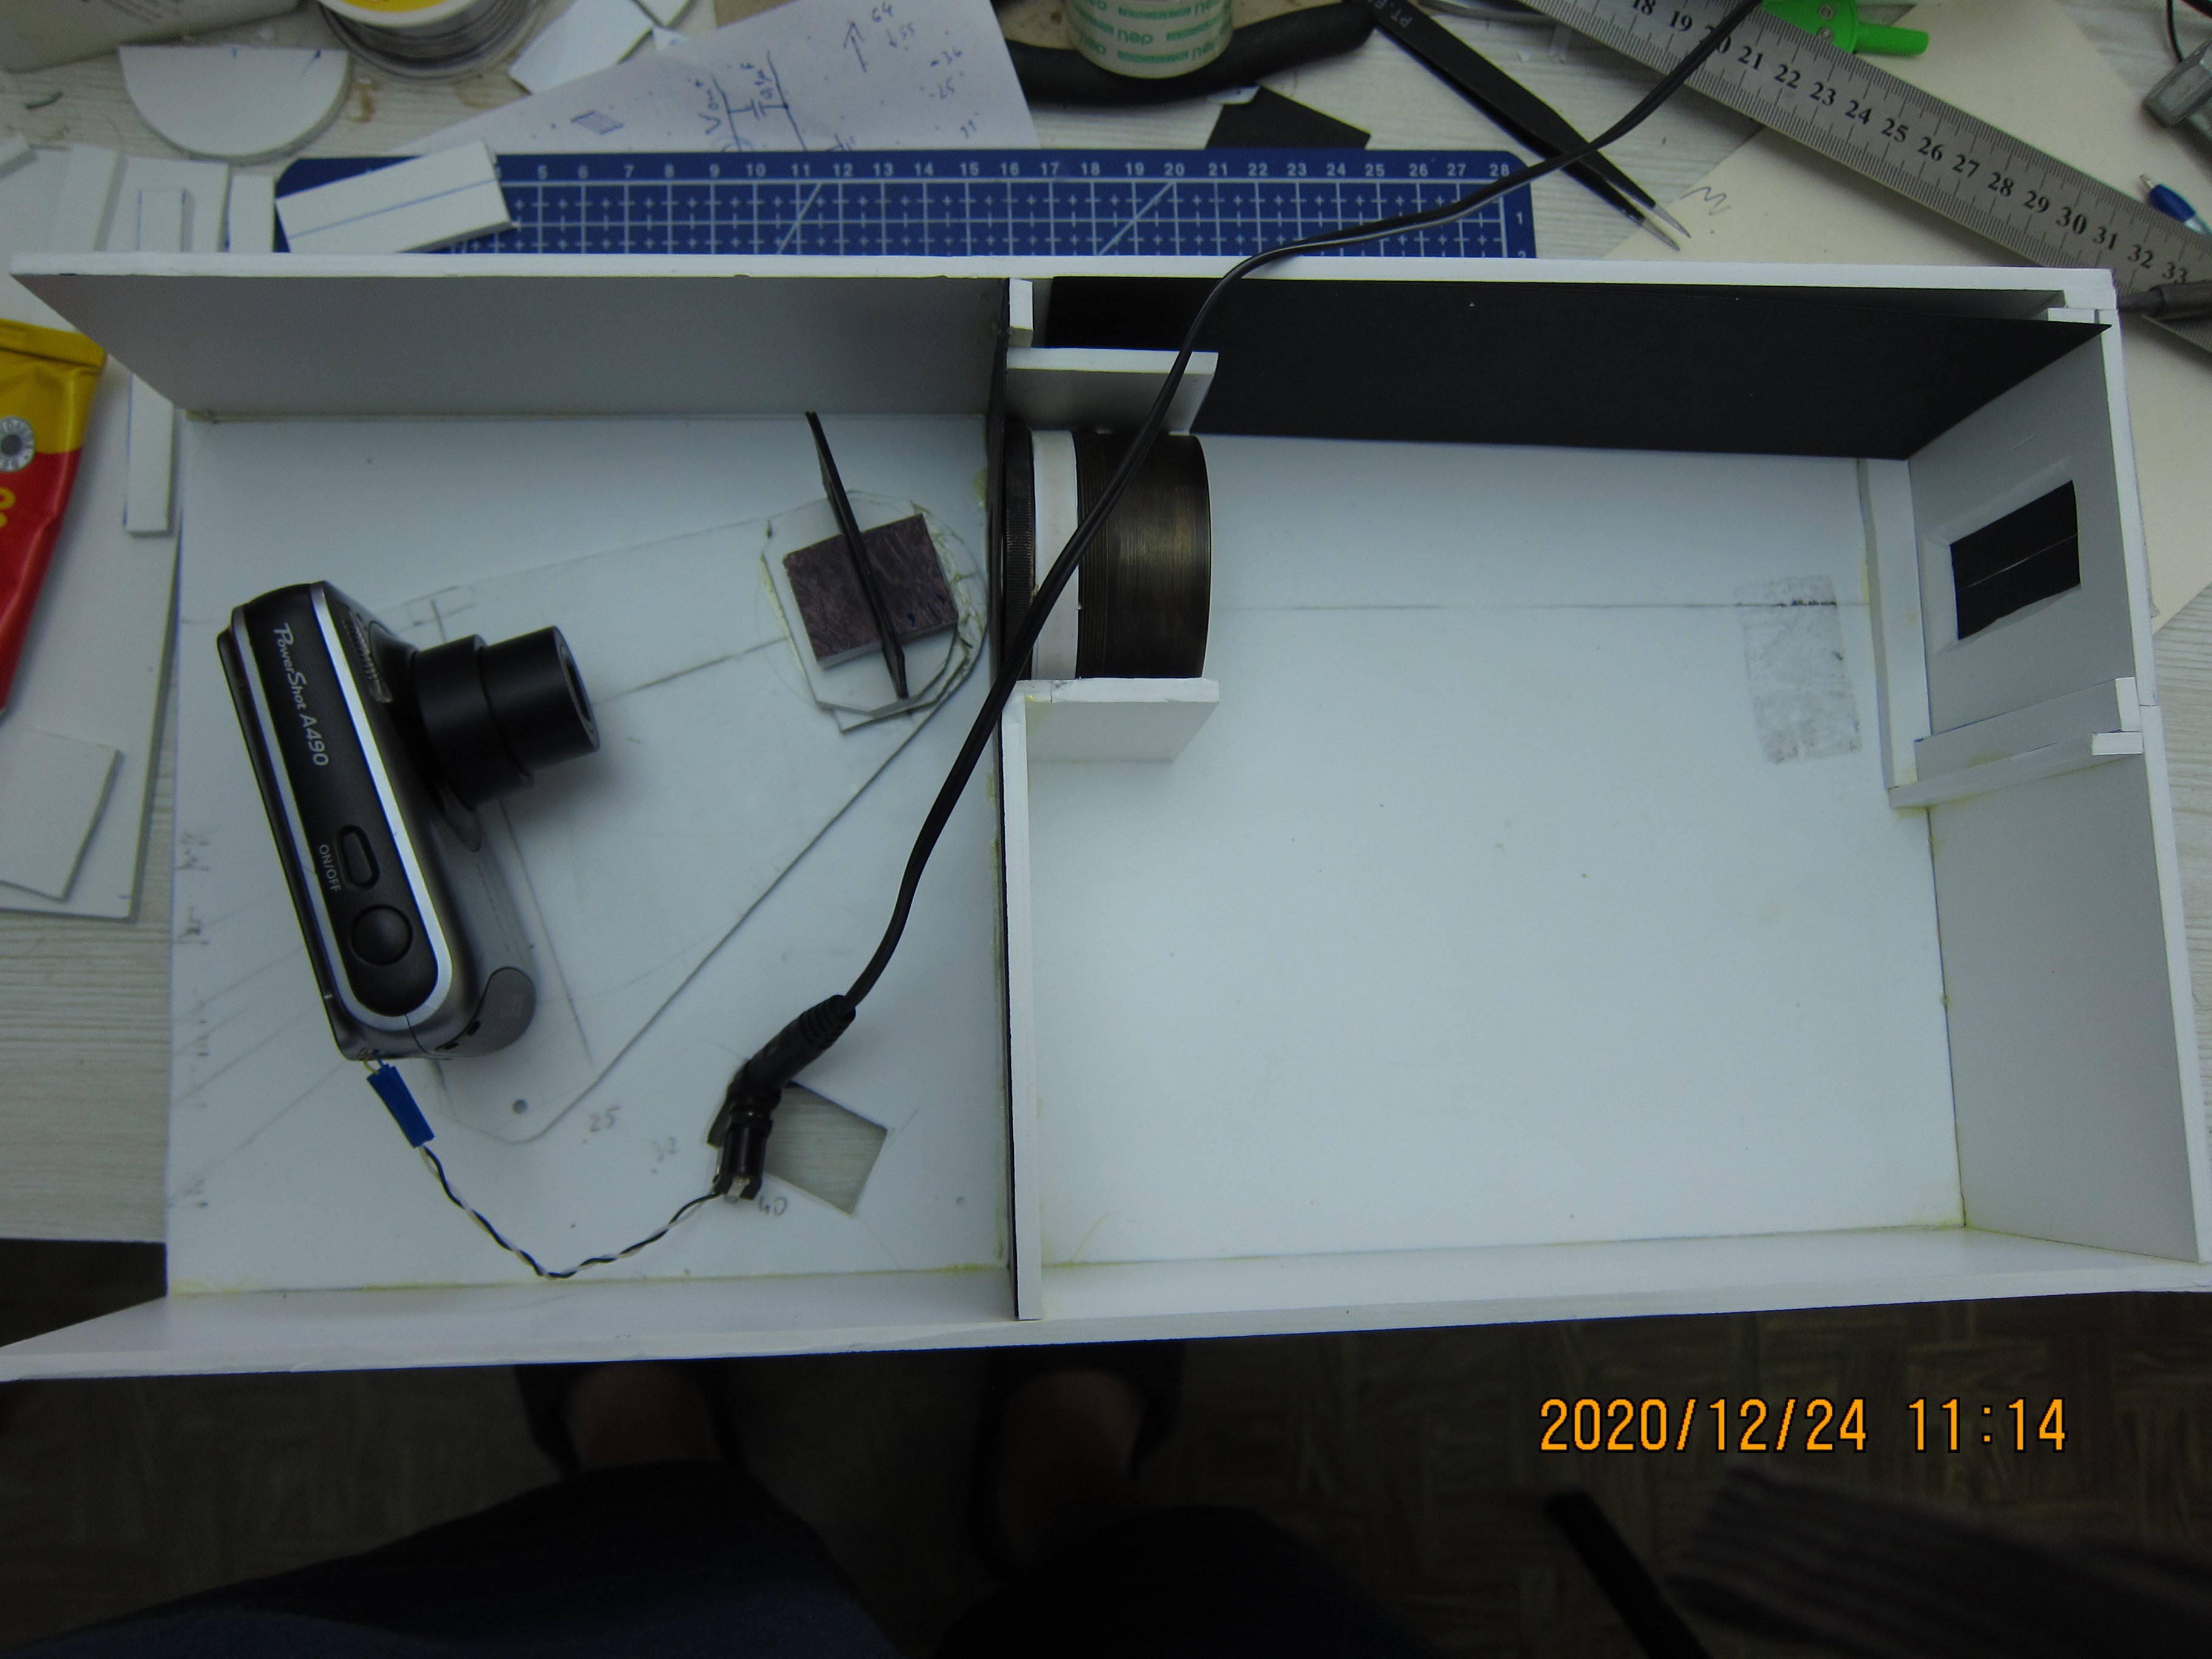
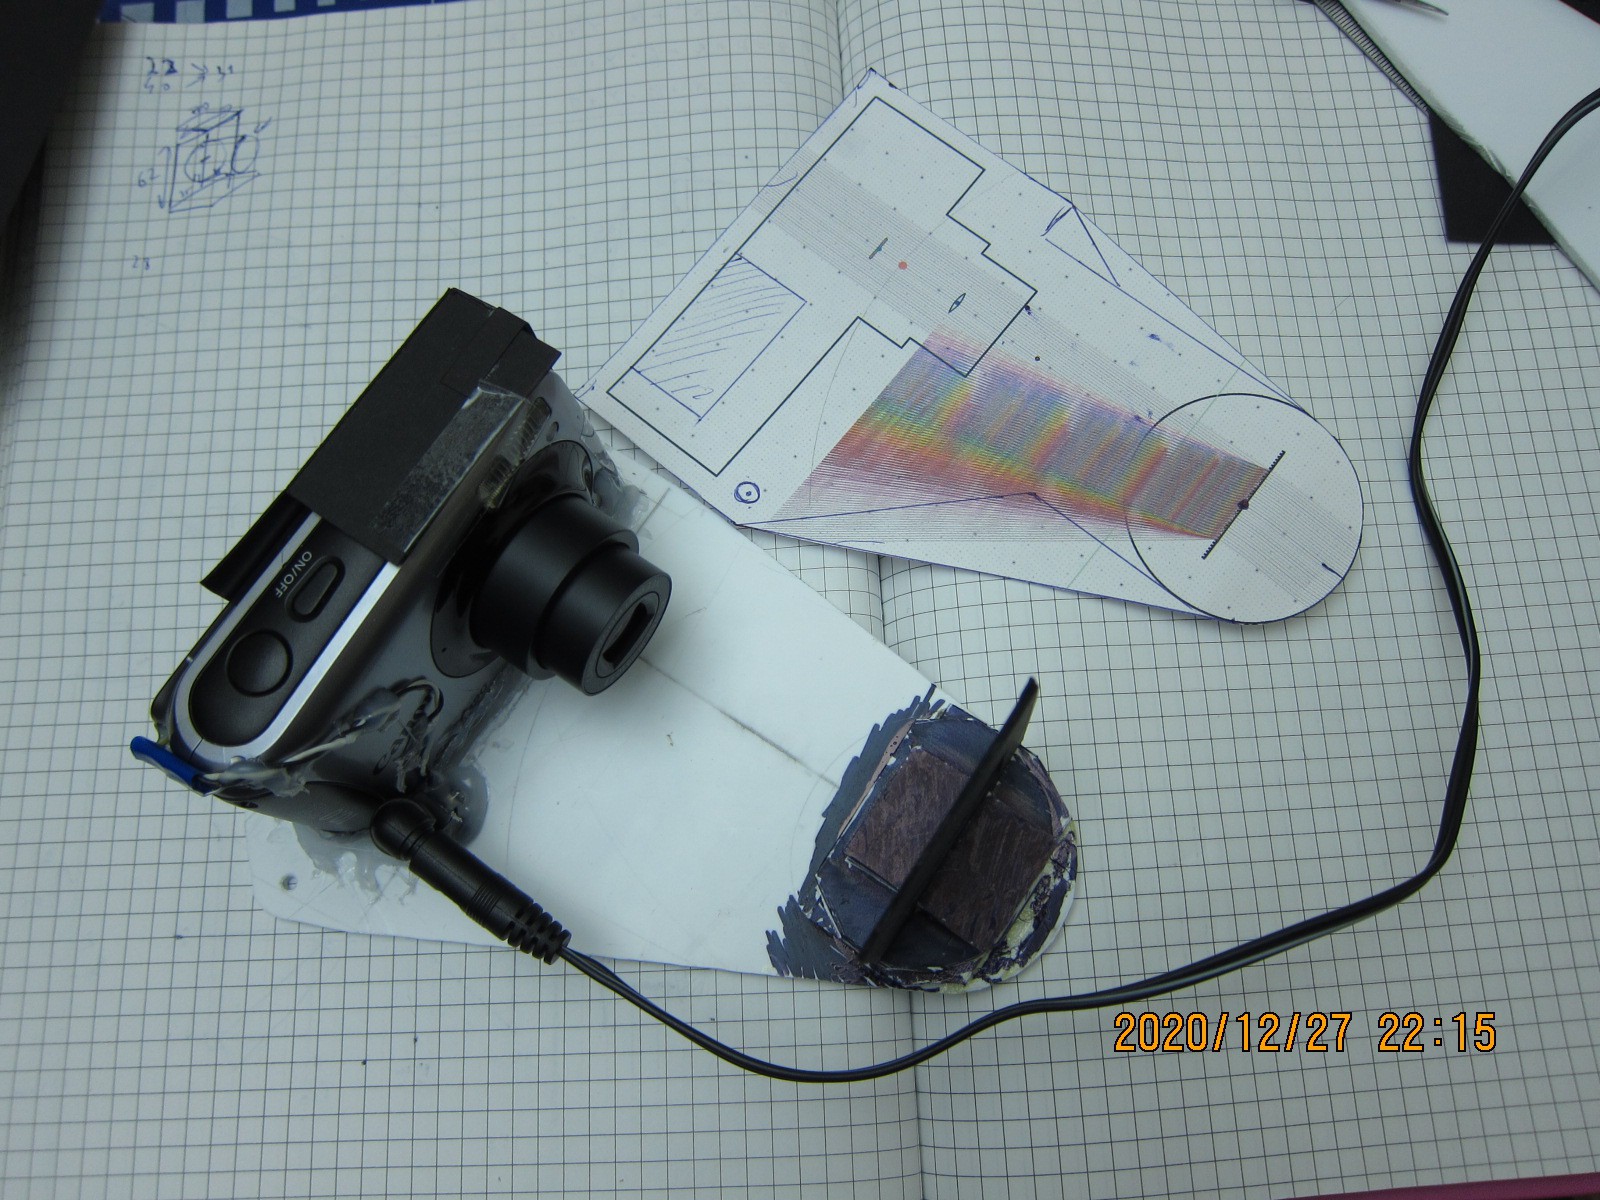
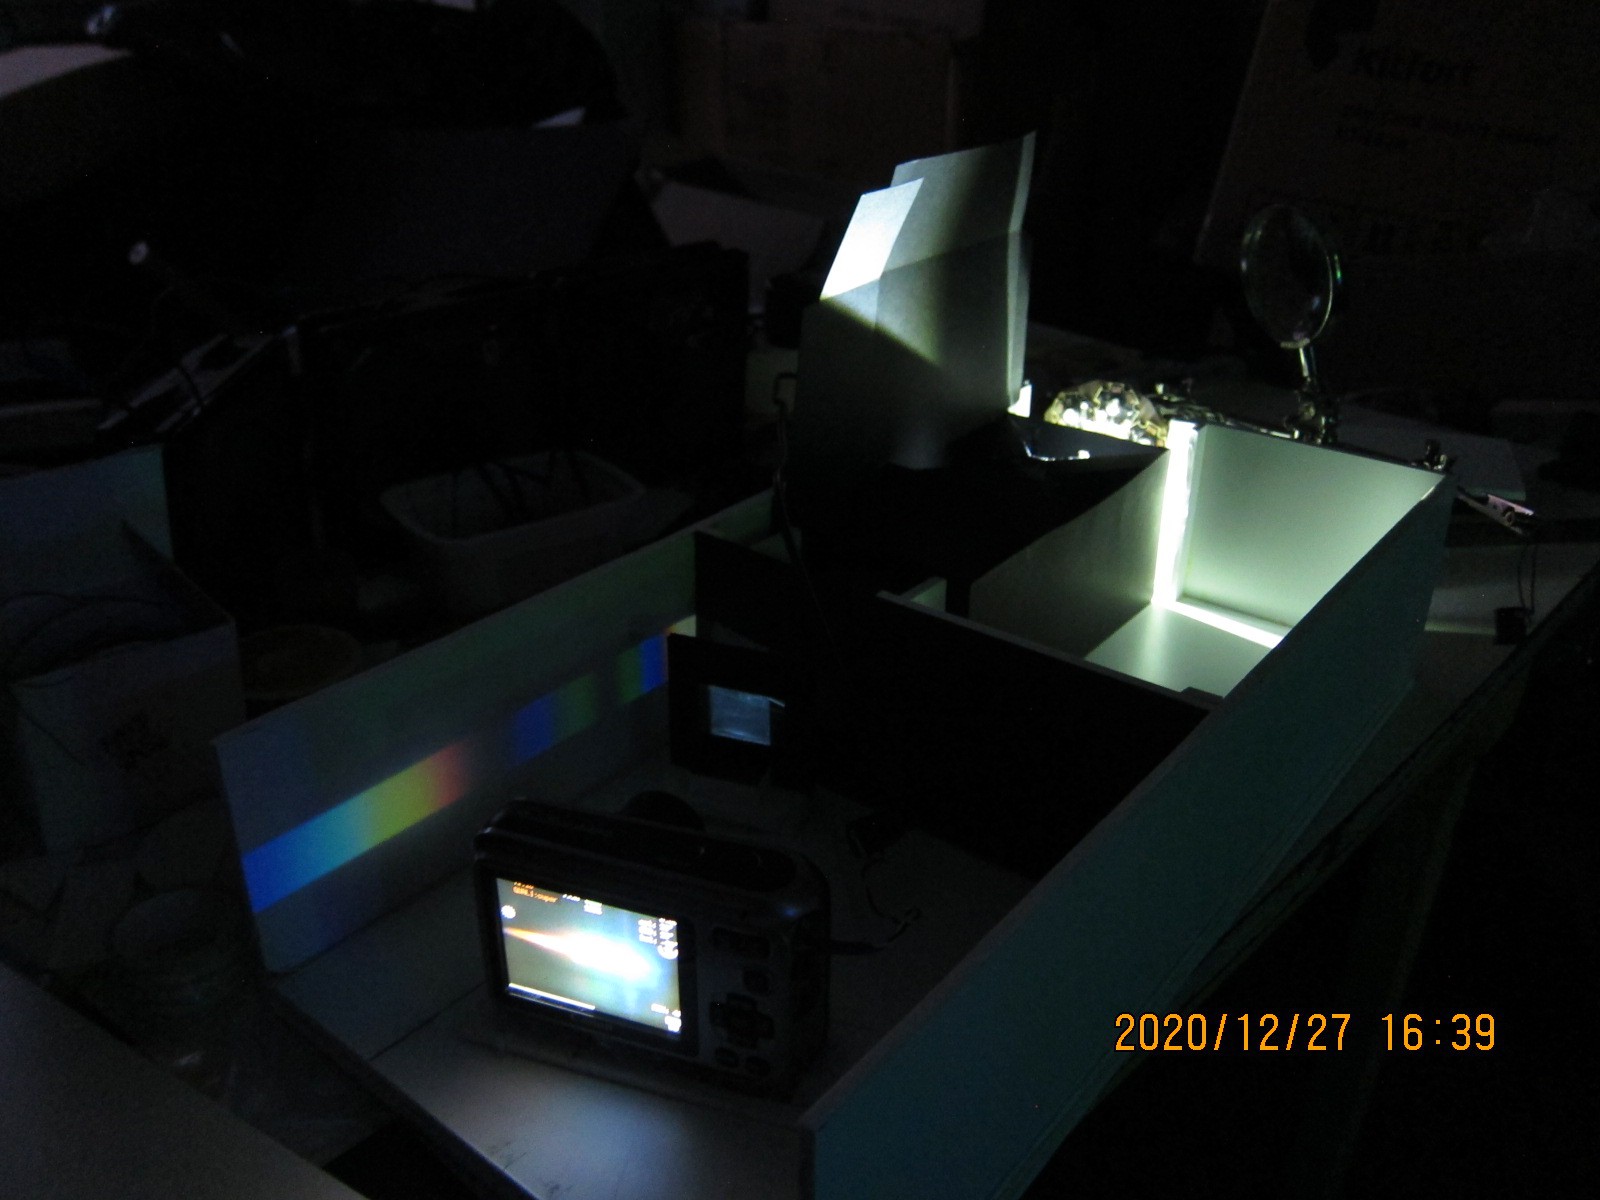
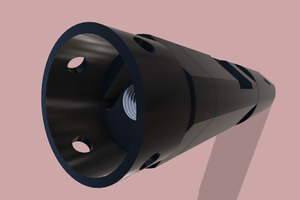
The optics is just a box lined with black cardboard, and several apertures inside, made of the same black cardboard. The apertures are made for reducing stray light. Entrance slit is made from two blades used for retractable knife. The dispersive element is 600 lines/mm Chinese transmission diffraction grating on PET substrate. There is no collimating optics inside, so light incoming on the grating is slightly divergent, angle of divergence is ~5 degrees from center line. This is probably the cause of slight distortion of the spectrum. In the end, this geometric distortion is readily dealt with software.
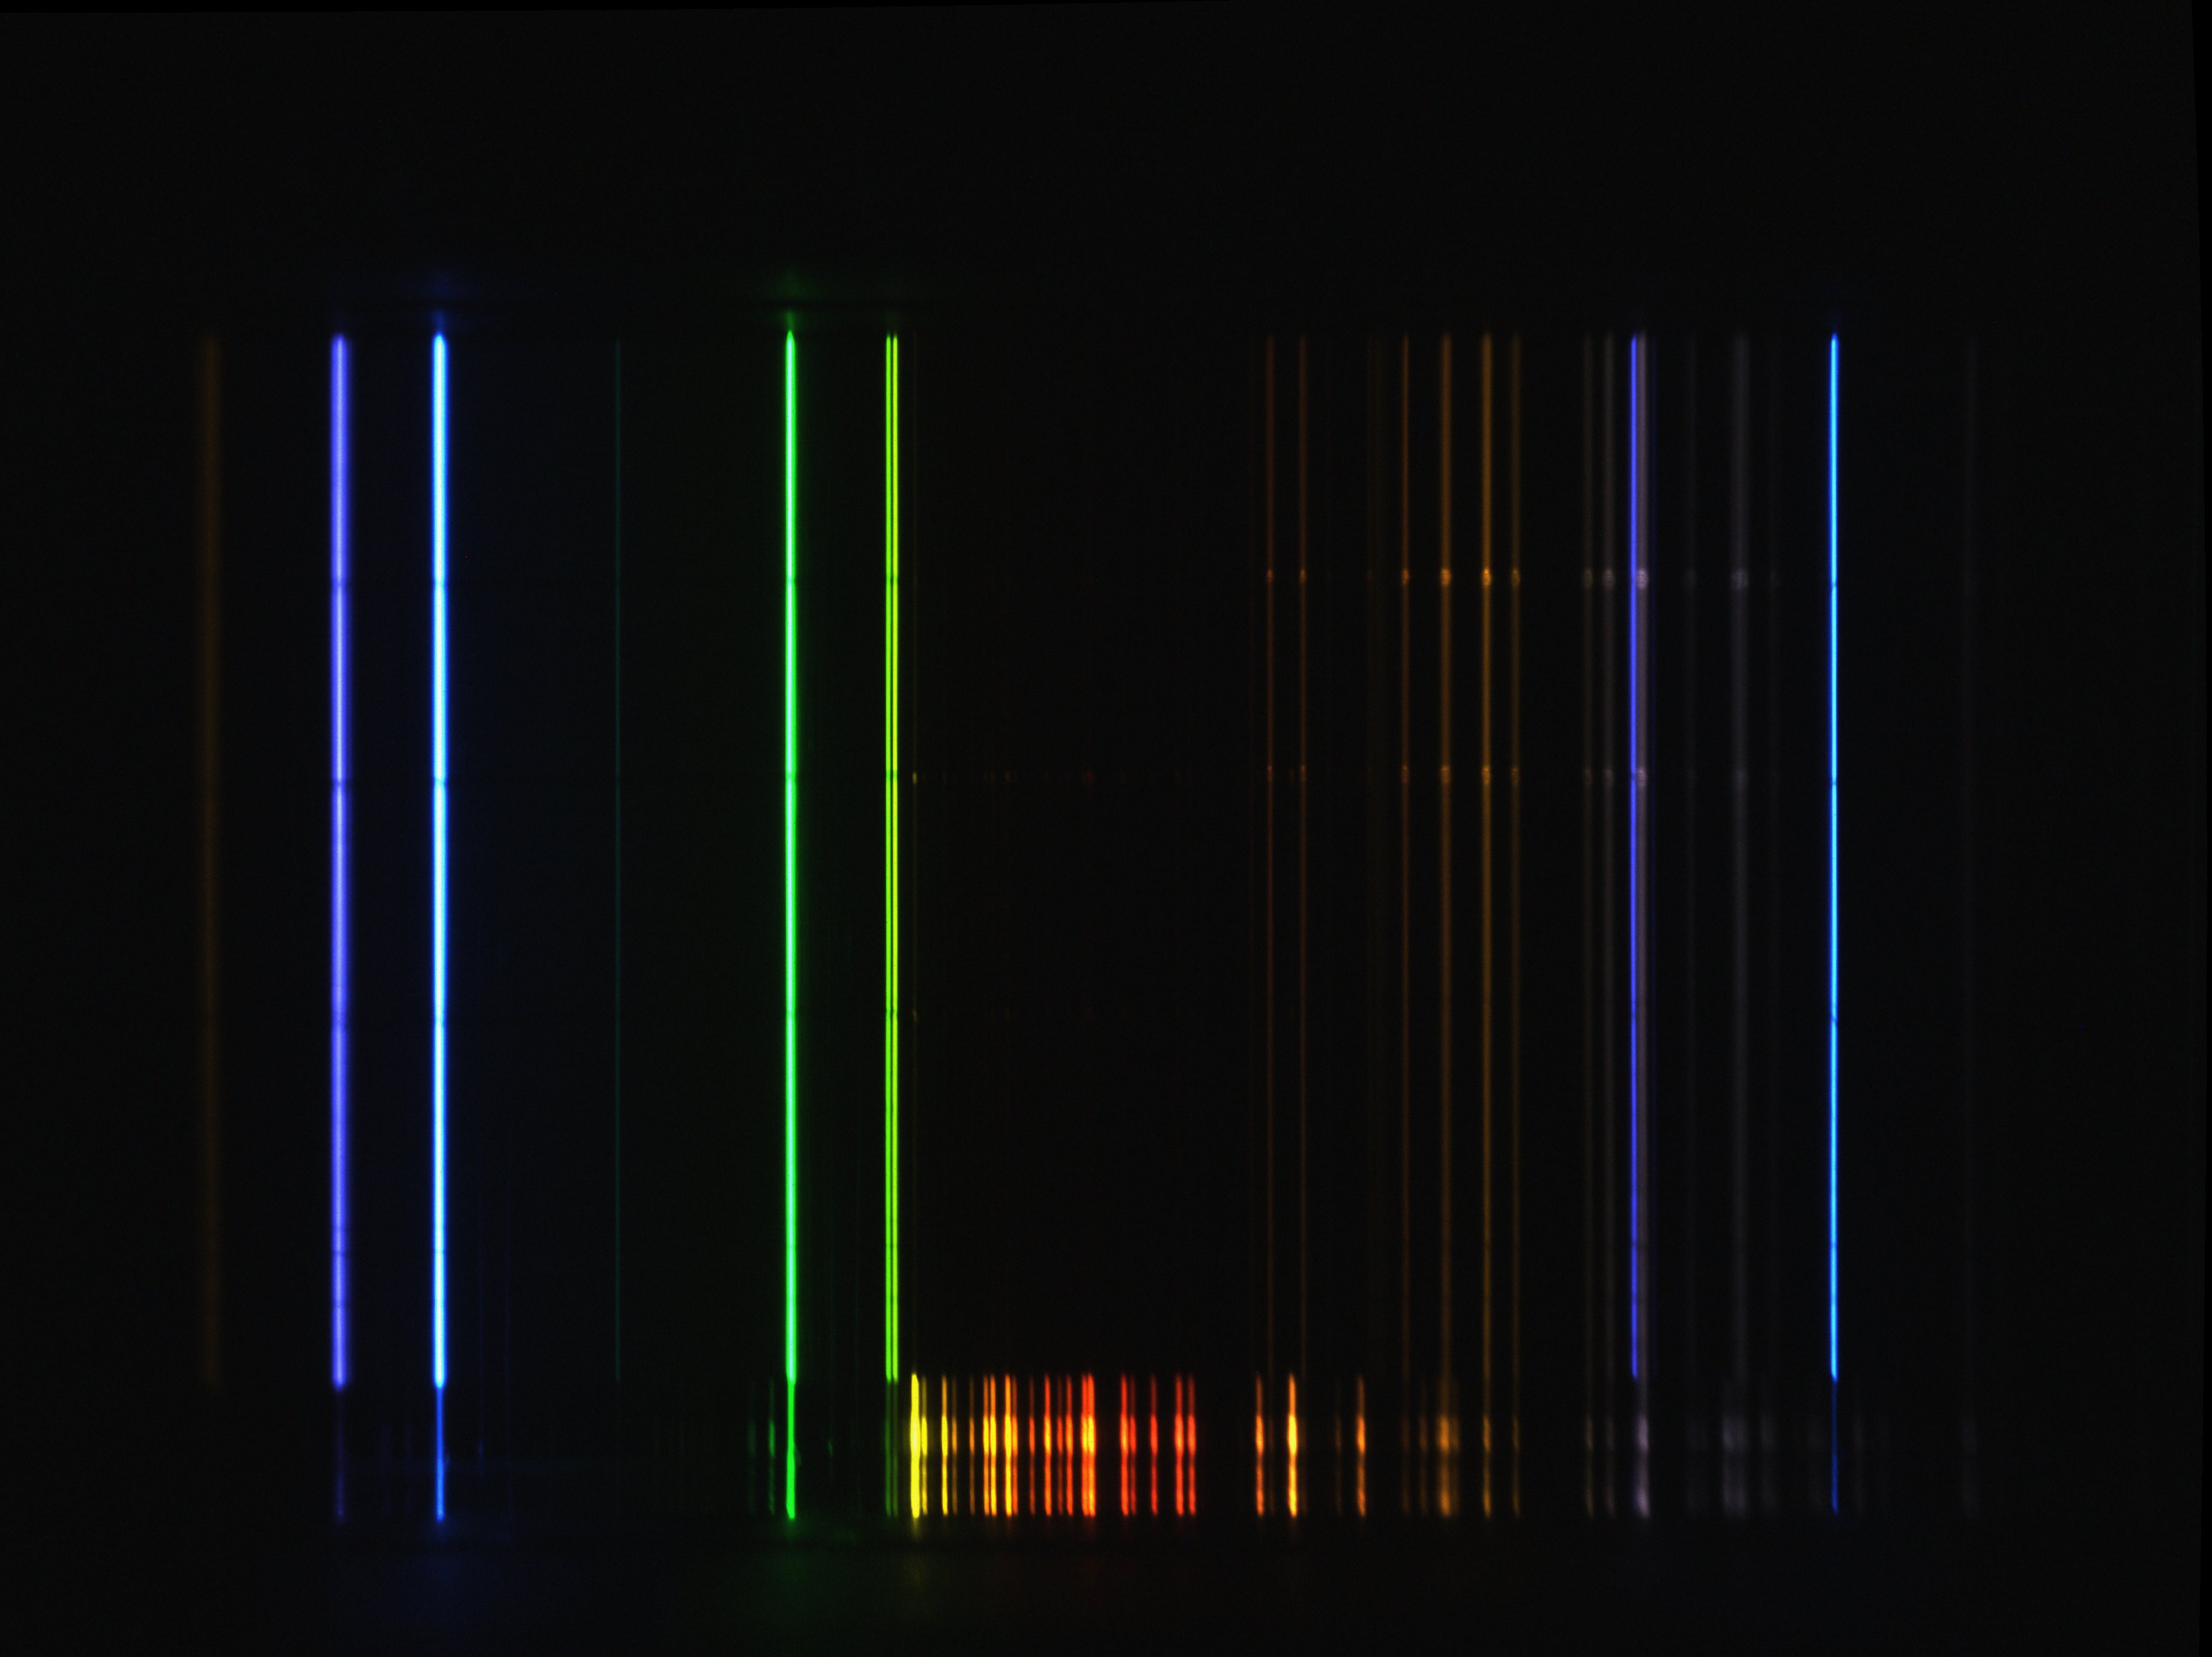
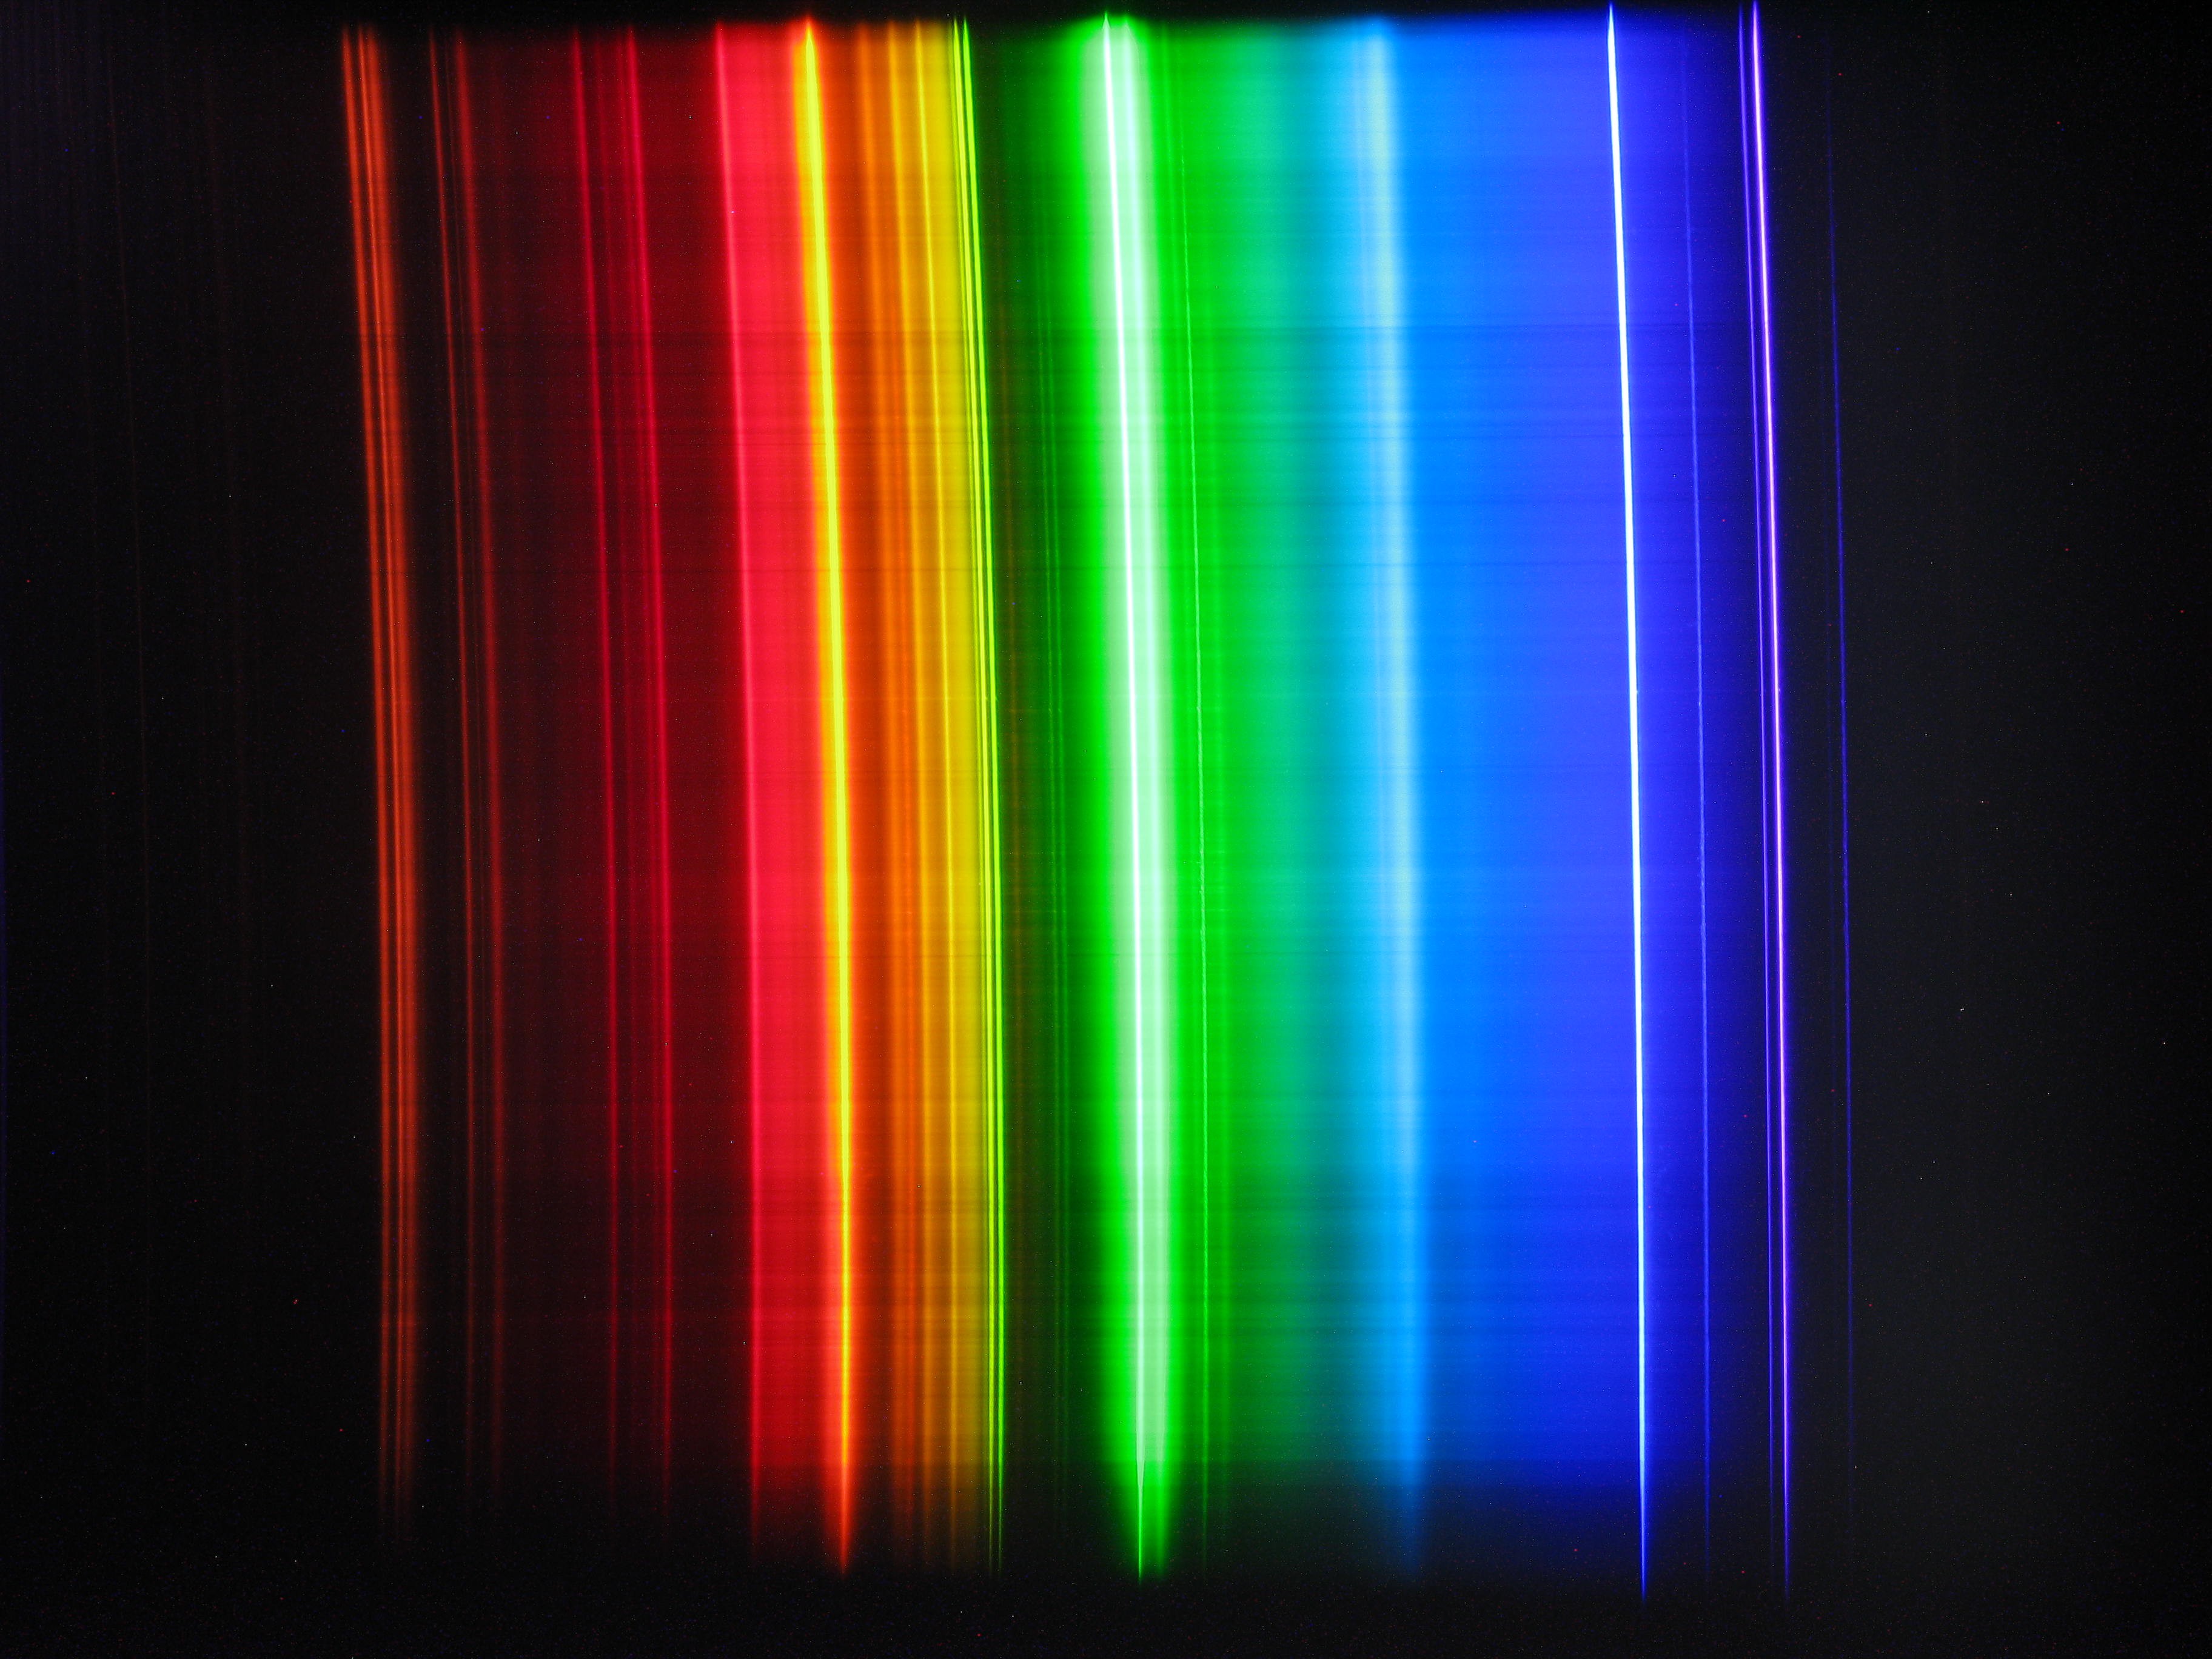
Here is spectrum of Neon, captured with this spectrograph:
It took 512 seconds of exposure, and there are many lines visible. Almost all lines in the left half are infrared.
The camera I use is modified Canon A490, bought second-hand for just about 10 USD. The modification - removing the IR-blocking filter - was made by me after buying it. The camera is loaded with CHDK "alternative firmware" which allows to shoot raw and have total manual control. Also through the use of related software chdkptp one can remotely control the camera from PC.
After capturing, raw files are "developed" with dcraw so that resulting tiff has 16 bits per channel, bad pixels are removed and pixel values are not distorted by gamma transformation, so these values are linearly scaled with the number of photons captured. Afterwards, the tiffs are further processed with Fiji software, by the use of unwarping plugin. The same software has another plugin which enables one to make graphs from pixel values. For rectangle selection it averages values of pixel column, which comes handy for capturing spectra - it makes one photo to have some thousand samples of the spectrum.

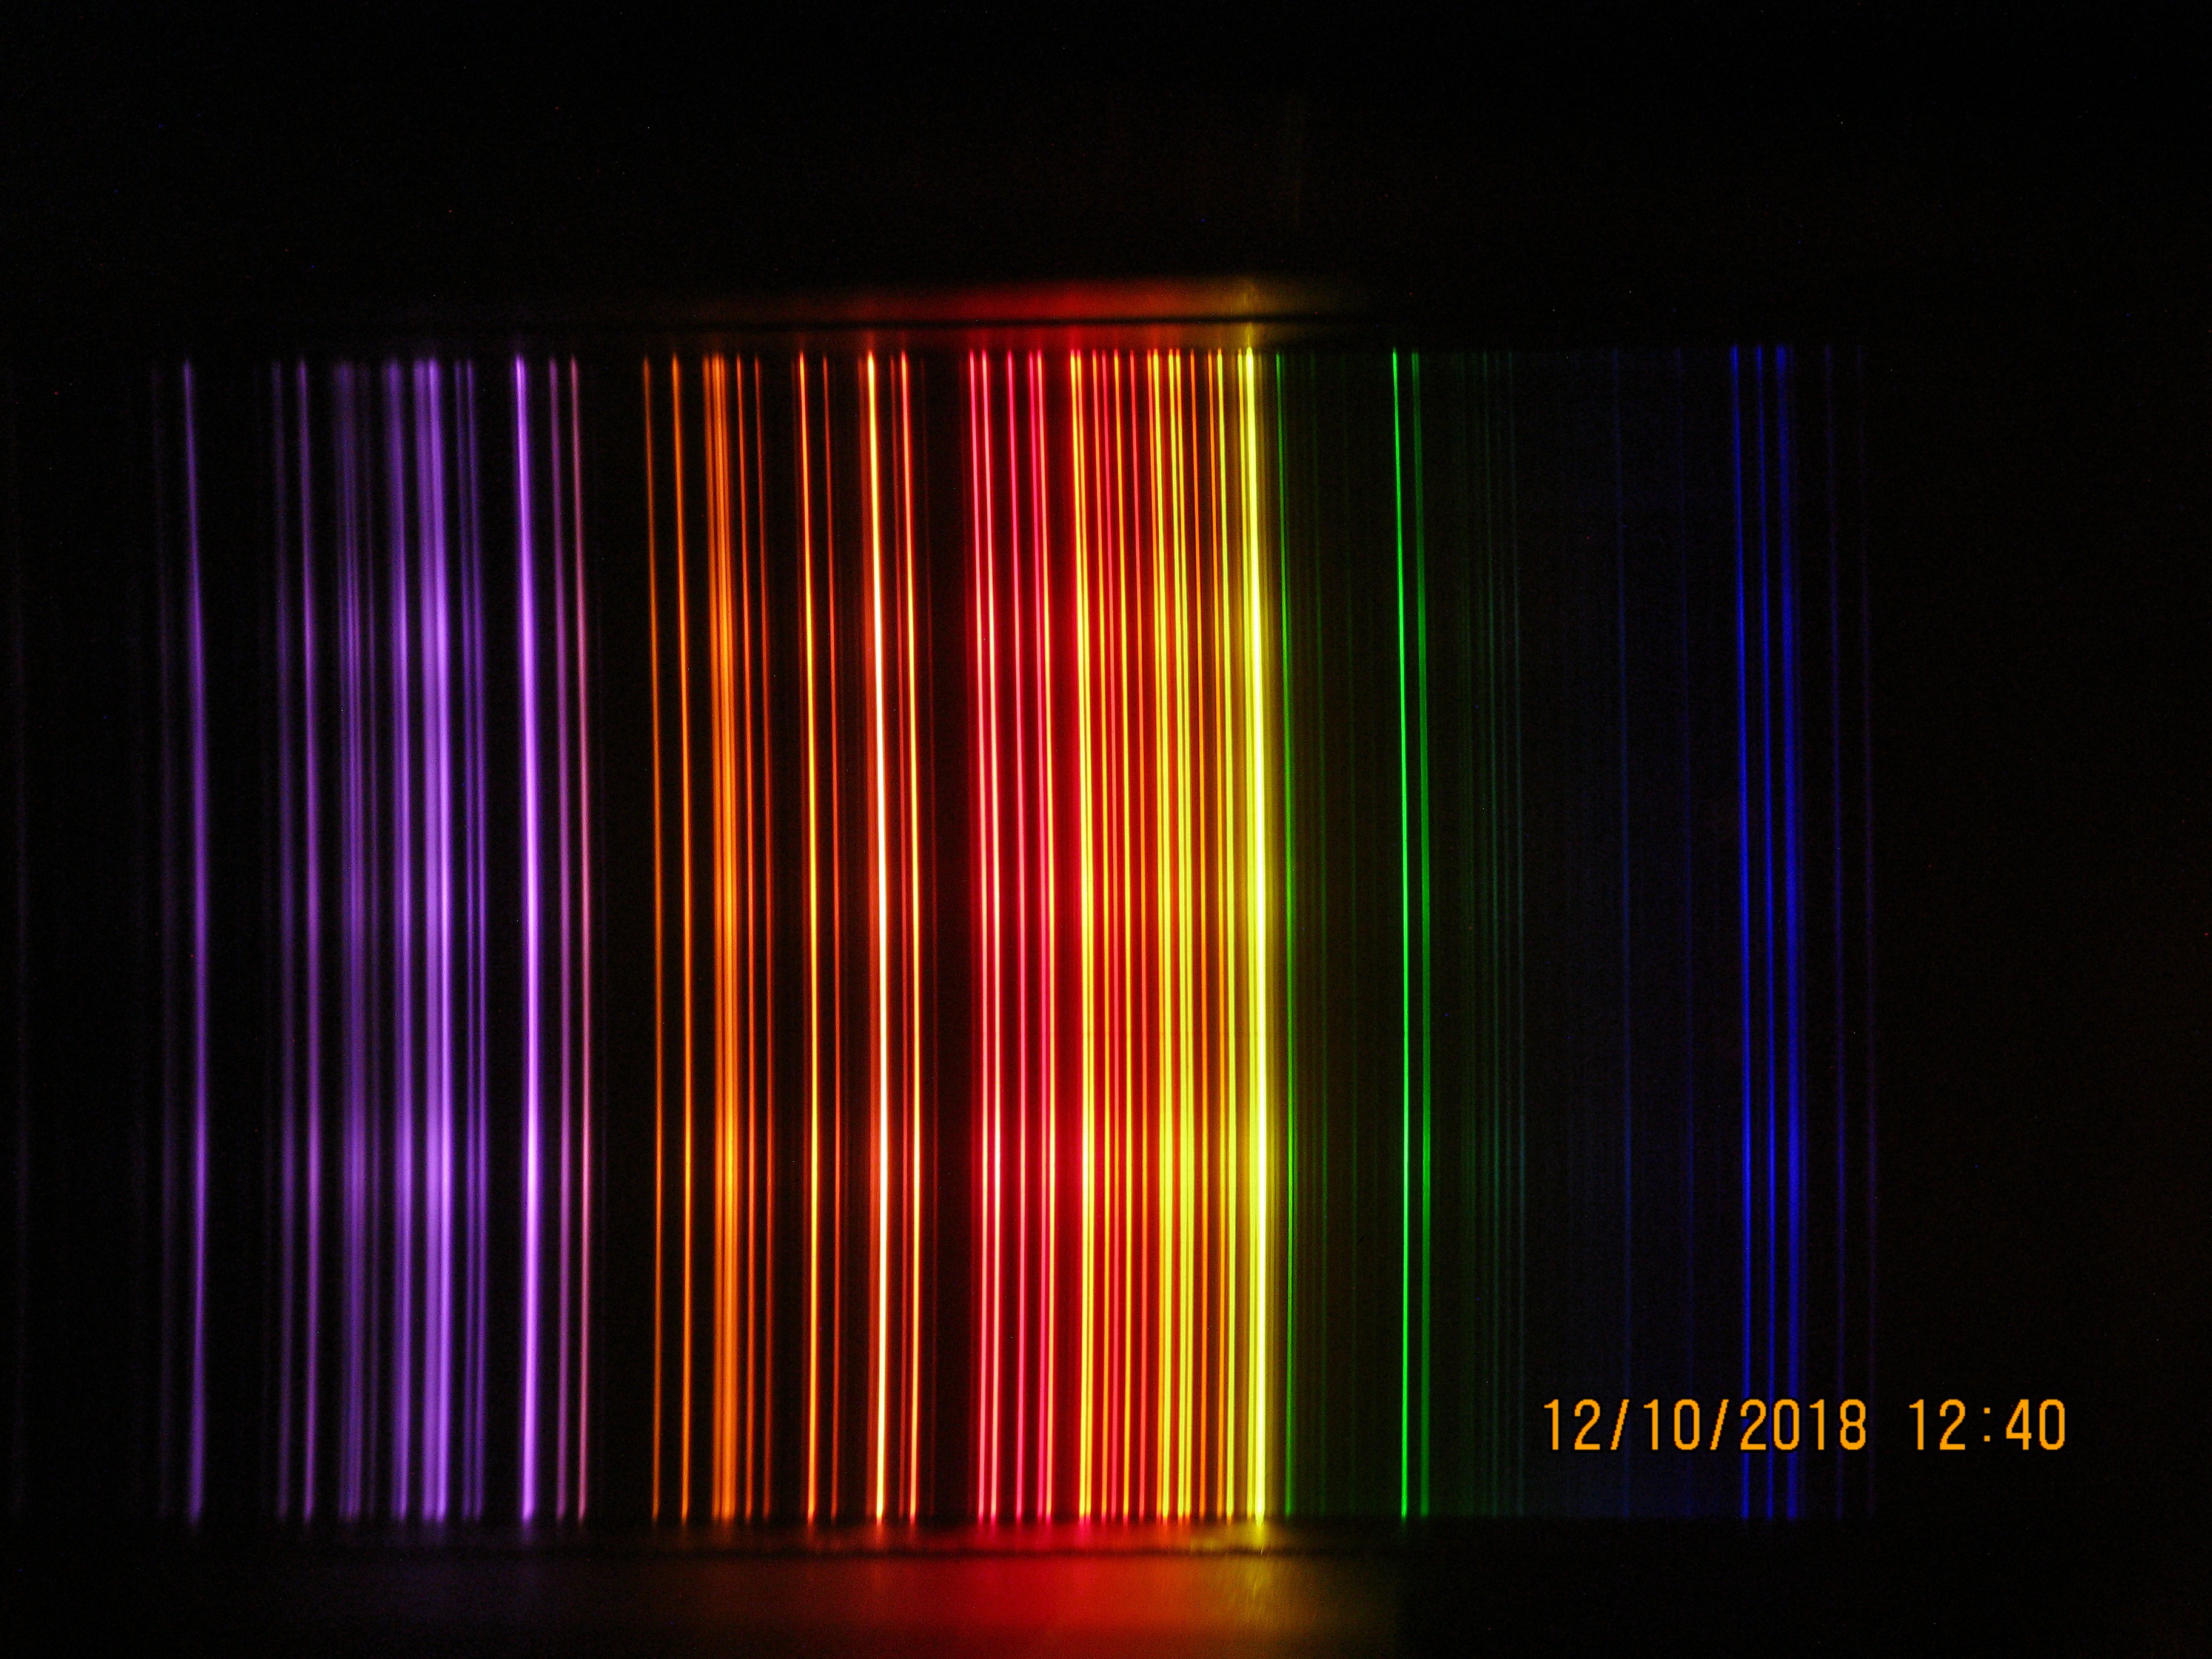
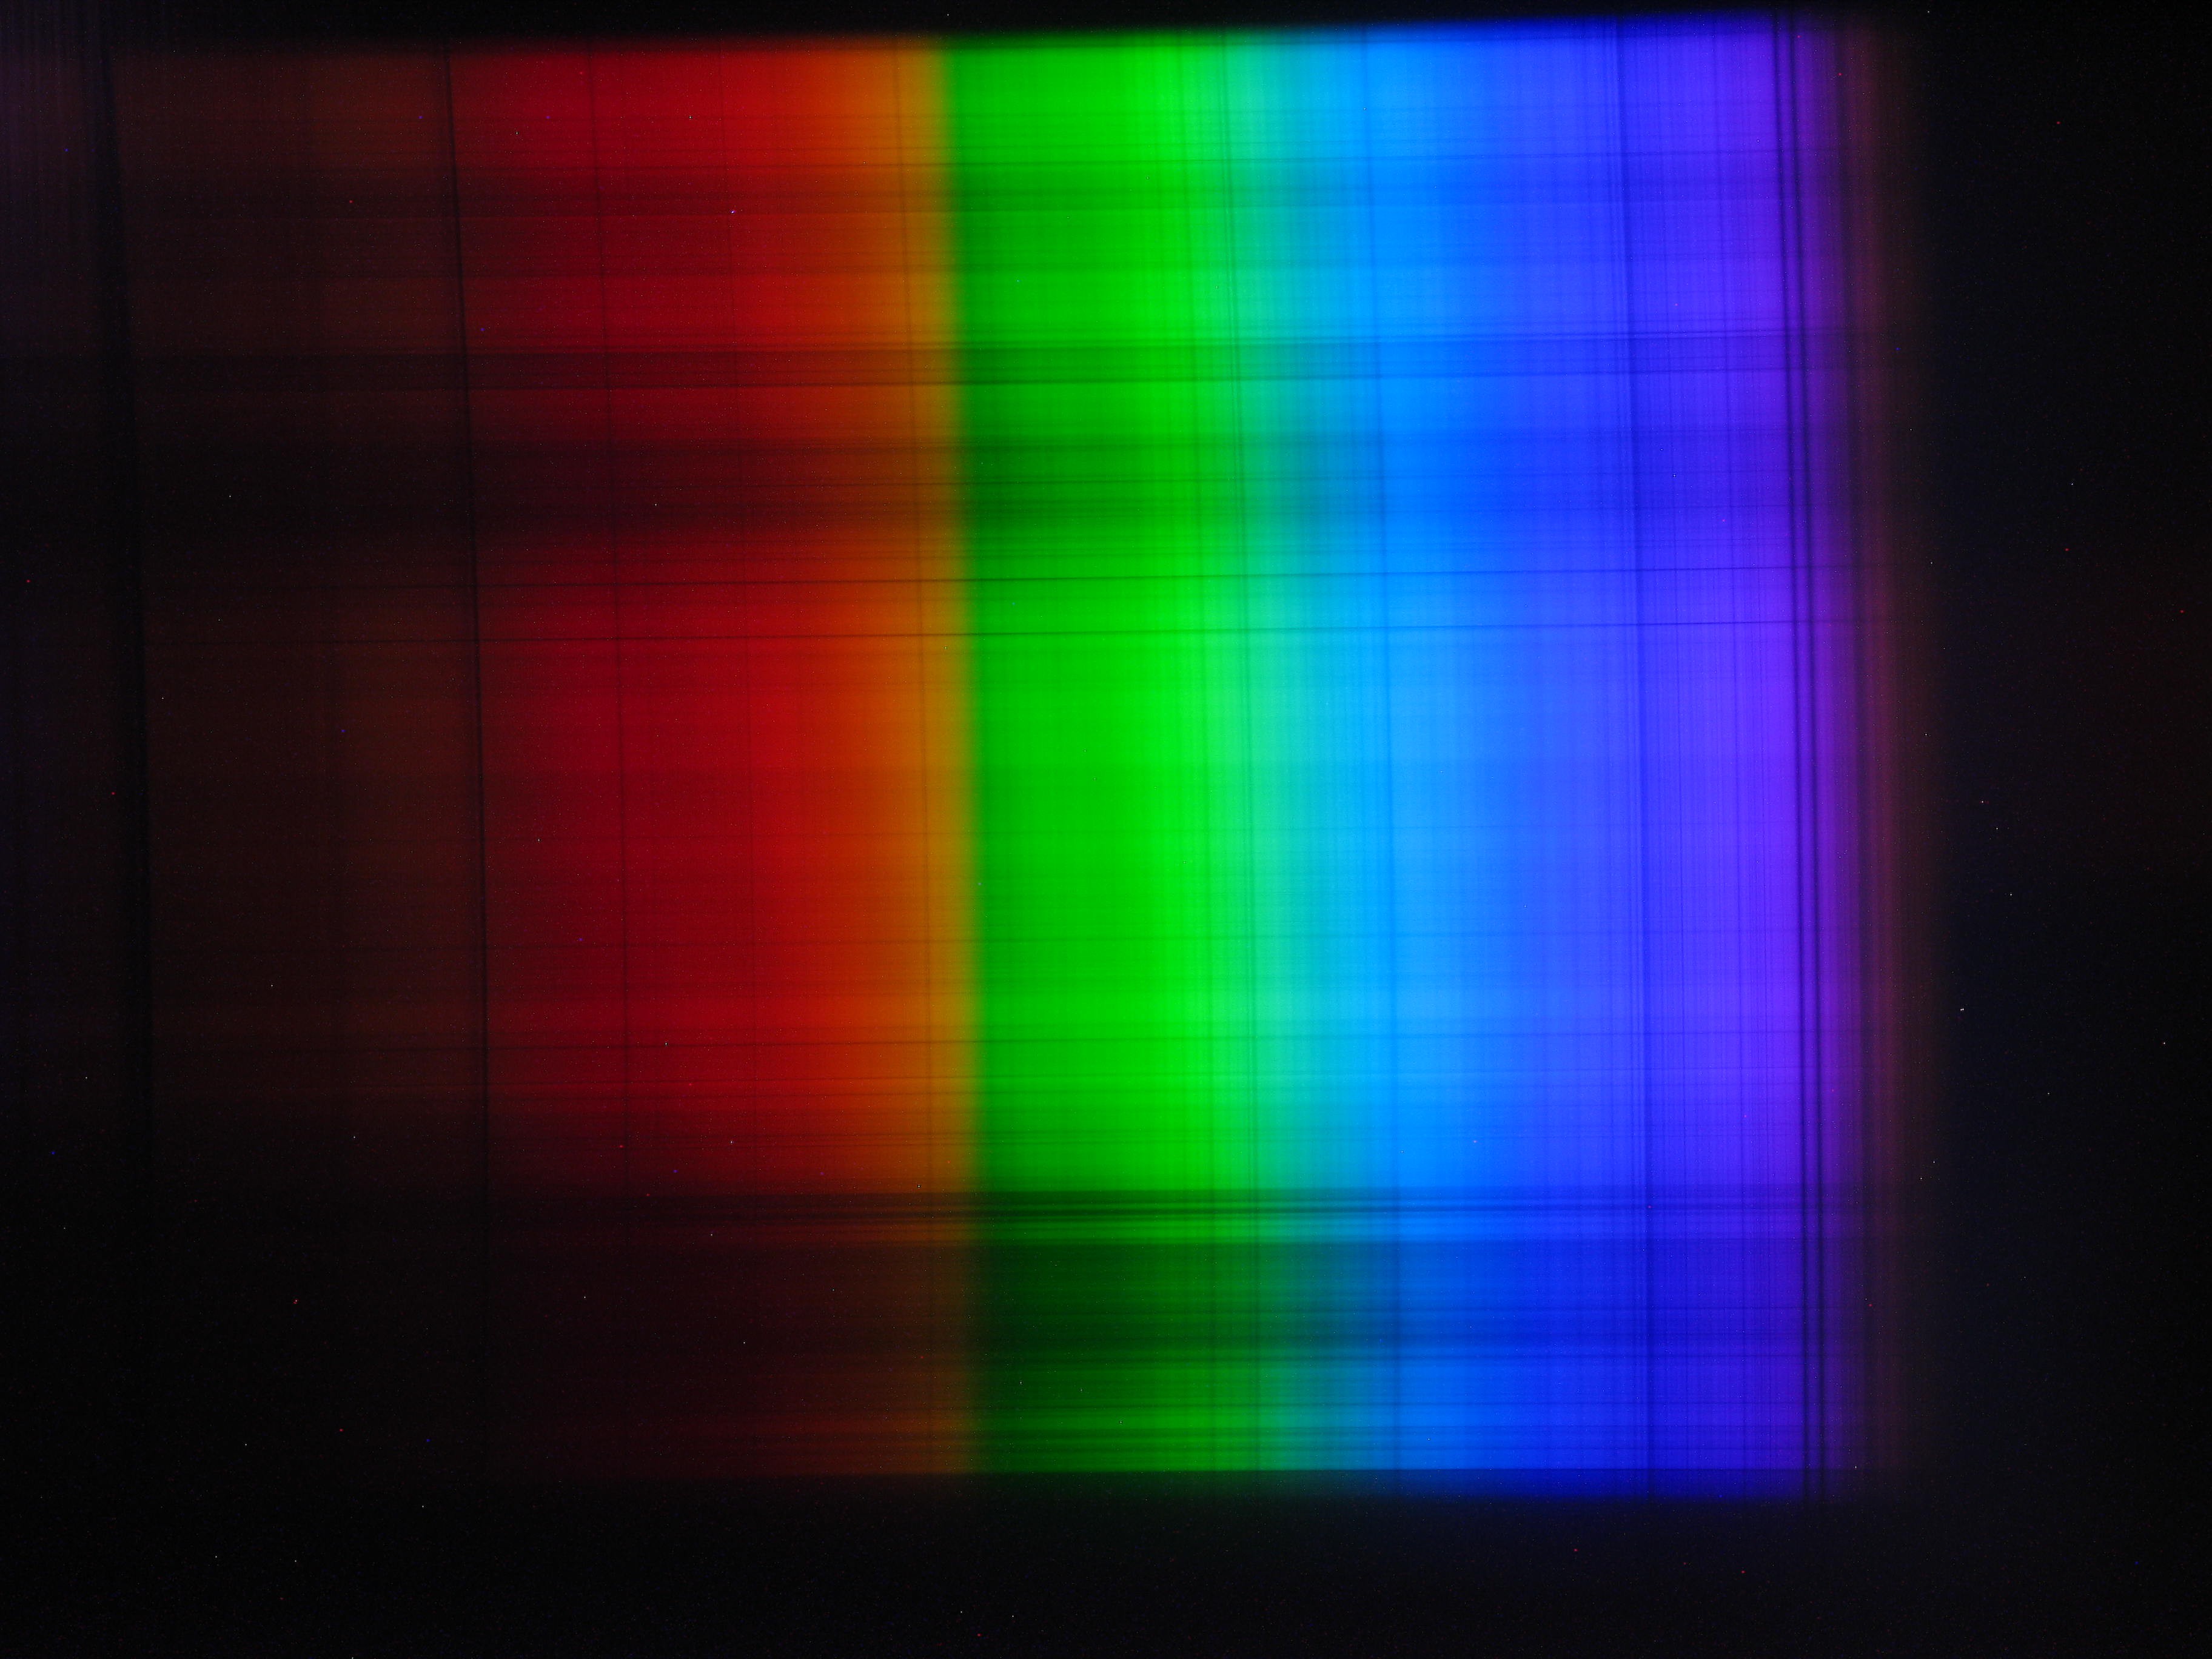
Above is the spectrum of Mercury lamp (aka germicide lamp) as captured by the spectrometer. At the bottom is the light of little Neon glow lamp which is an etalon of spectral calibration.
And this is the same spectrum but straightened, so averaging along vertical axis is possible.
The resulting data was exported to Excel, pixel coordinates correlated to wavelength, and presented as graph:
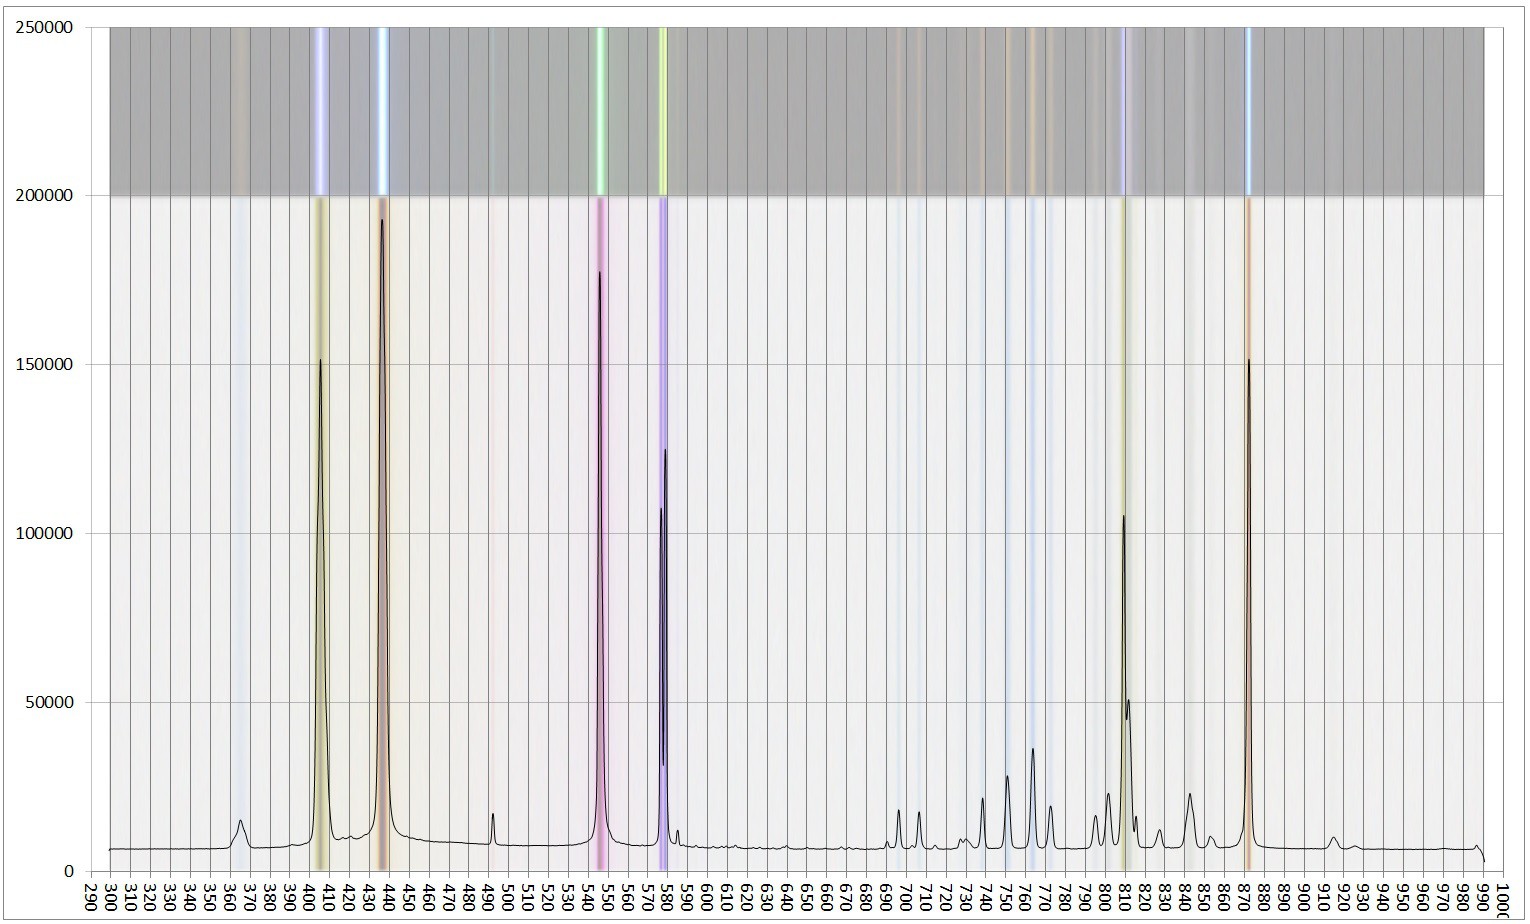
Vertical scale is arbitrary units, relative vertical scale varies with wavelength as camera sensor has not been calibrated for brightness vs wavelength. The highest peaks at 405 and 437 nm are also oversaturated, their real height should be several times bigger. The horizontal scale is nanometers.


 David H Haffner Sr
 Alexis Rey
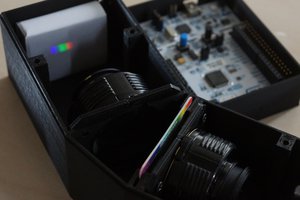
 esben rossel
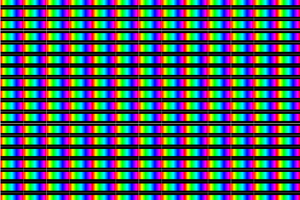
 ReVision
Nice project. What kind of glue you use? Is it from here:: https://bestwoodglue.com/