 Steven
-
11Connecting the AUV to the ASV
To connect the AUV to the topside ASV, two tethers were used. One was an ROV tether developed by Blue Robotics (which can be found here https://www.bluerobotics.com/store/cables-connectors/cables/fathom-tether-nb-4p-26awg-r2/) and the second was a tether from an unknown developer that was found in our capstone lab. The Blue Robotics tether is very high quality and contains four unshielded twisted pairs of 26 AWG wire. Its pretty expensive normally, but you can save a bunch of money if you're able to get one from their "Dings & Dents" page. Blue Robotics uses this page to post some of their used or non-standard items for sale, and they often have their ROV tether posted here to sell some of their already cut but unused cable. The catch here is that you don't get to select your cable size; its randomly picked from their inventory. Blue Robotics has a set of cut cables from previous orders that are of random lengths that are too short to sell as a normal item. They do give you a range of what the size of your cable will be, though. For example, we paid $20 for a cable that would be between 10 and 16 meters in length, and received a cable that was 14 meters long. So if you're looking for a good deal on an otherwise expensive cable and can live with a cable of relatively random length, this is a really good option.
While this Blue Robotics tether contained enough wires for all of the connections we needed between the topside and the AUV, we had a problem with the cable gauge. One of the connections we needed to send down was power for the stepper motor. This power would be a 24 V signal capable of drawing up to 3 A, potentially. However, based on our experience and on some online research, the 26 AWG wire in the Blue Robotics tether could carry a maximum current of 1 A safely. Therefore, as Blue Robotics didn't have any tethers with a larger gauge of wire, we needed a second tether for sending power down. Thankfully, a tether we happened to find from a previous project in our lab worked well, as it seemed to be a power cable for an underwater pool cleaning robot with 20 AWG wire (capable of carrying up to 5 A safely).
So we ended up attaching the two tethers together using zip ties and used them both. The blue tether in all of the images was the power tether used for powering the stepper motor. The yellow tether (the Blue Robotics tether) however was used for powering the two Arduinos (which had a current draw limit of about 800 mA) and for making a serial communication connection between the Raspberry Pi on the ASV and the sensor control Arduino on the AUV. A 12 V rechargeable power supply was connected to a bus on the ASV used to distribute 12 V of power over the yellow tether to the two Arduinos (using two twisted pairs). A boost converter was also connected to this 12 V bus to step the voltage up to 24 V to be sent over the blue tether to the stepper motor power input.
-
12Programming and Calibrating the Sensors
With the AUV completely built, it was time to program and calibrate the sensors. To reiterate, 5 sensors were used to measure water quality parameters in this project: a depth/temperature sensor, a conductivity sensor, a dissolved oxygen sensor, a pH sensor, and a turbidity sensor. The depth/temperature sensor used was the Bar30 High-Resolution 300m sensor produced by Blue Robotics (found here https://www.bluerobotics.com/store/sensors-sonars-cameras/sensors/bar30-sensor-r1/), while the other 4 sensors were all produced by DFRobot. These sensors can be found with the following links.
K=10 Analog Electrical Conductivity Sensor - https://www.dfrobot.com/product-1797.html
Analog Dissolved Oxygen Sensor - https://www.dfrobot.com/product-1628.html?search=dissolved%20Oxygen
Analog pH Sensor - https://www.dfrobot.com/product-1110.html
Analog Turbidity Sensor - https://www.dfrobot.com/product-1394.html?search=turbidity%20sensor
All of the sensors used featured open source code samples and libraries for calibrating the sensors and working with the measurements taken by the sensors. As such, we were able to leverage these code samples and libraries greatly when calibrating the sensors and writing the Arduino ino file for interfacing with them.
The ino file written for our sensor interfacing Arduino basically just runs through the steps shown in the code samples for taking measurements from each sensor, and then compiles these measurements into a single string message. This single string message is then sent over the serial connection to the Raspberry Pi for decoding, being saved locally on the Pi, packaging into the custom message, and being sent over the radio connection to the GCS.
Of the five sensors used, only one sensor (the depth/temperature sensor) was configured such that it did not need to be calibrated. The remaining sensors all featured some form of a calibration process. The depth/temperature sensor was also the only digital interfacing sensor, as it communicated over I2C. The remaining sensors were all analog sensors that had to be sampled directly by the Arduino.
For the conductivity sensor, a two-point calibration process was conducted using a 12.88 mS/cm calibration solution, an 80.00 mS/cm calibration solution, and the code and process explained here https://wiki.dfrobot.com/Gravity__Analog_Electrical_Conductivity_Sensor___Meter_V2__K=1__SKU_DFR0300. The 12.88 mS/cm calibration solution comes included with the sensor, and we obtained the 80.00 mS/cm calibration solution from a connection we had with our school's marine science center.
For the dissolved oxygen sensor, a two-point calibration process was also conducted using the procedure and code explained here https://wiki.dfrobot.com/Gravity__Analog_Dissolved_Oxygen_Sensor_SKU_SEN0237. For this calibration, dipping the probe in water and then exposing it directly to air served as the 100% dissolved oxygen calibration point. The 0% dissolved oxygen calibration point was created by saturating a beaker of distilled water with sodium sulfite (Na2SO3), which would react with the water to consume all of the oxygen in the water. Additionally, it was important to make a solution of 0.5 mol/L NaOH to place in the probe of the dissolved oxygen sensor, as the probe needed this solution to take the measurements properly and the solution was not included with the sensor. We created this solution ourselves by obtaining some NaOH tablets from our chemistry department and then mixing the appropriate weight of NaOH with the appropriate volume of distilled water. The NaOH tablets can also be purchased online. Make sure you do this step correctly, as it is imperative for the correct functioning of the sensor!
For the pH sensor, a two-point calibration process was conducted using a 7.0 pH calibration solution, a 4.0 pH calibration solution, and the code and process explained here https://wiki.dfrobot.com/PH_meter_SKU__SEN0161_. We obtained these calibration solutions from our chemistry department, but they can also be purchased online.
For the turbidity sensor, no formal calibration process was conducted. Most turbidity standards are very expensive to purchase, and our chemistry department and internal contacts did not have any standards on hand. Additionally, the sensor we were using was not incredibly accurate (it is a cheap sensor typically used to measure water cloudiness in dishwashers), so having accurate turbidity standards was not even necessary. We intended on using a Secchi tube to measure the turbidity of some common, cheaper solutions (water, oil, soda, etc.) empirically and then calibrate the sensor based on these solutions, but we did not have enough time to perform these tests. So instead, we simply used the voltage to turbidity in NTU equation provided for the sensor by DFRobot here https://wiki.dfrobot.com/Turbidity_sensor_SKU__SEN0189. This produced reasonable enough results in our testing.
By leveraging the open source code available to us, these sensors were all pretty easy to set up and almost worked right out of the box. The biggest challenges we faced with them were tracking down the appropriate calibration solutions and compiling the various code sources and interfacing methods into a single, cohesive ino file. Performing the wiring to the Arduino was also challenging, as we had to create power and ground busses with very little space and had to neatly assign the sensors to convenient input pins on the Arduino so that a single header could be used to connect all of the analog input signals. With these challenges sorted out, the sensors were all set up and ready to begin taking important water quality measurements.
-
13Programming the Stepper Motor Functions and Tuning the Buoyancy Control PID Controller
While the sensor Arduino was being programmed, the buoyancy control Arduino also had to be programmed to control the stepper motor and communicate with the sensor Arduino. Thus, the buoyancy control Arduino was programmed to take a depth measurement, take a temperature measurement, send these measurements to the sensor Arduino once per second (the buoyancy control Arduino sampled depth and temperature measurements faster than 1 Hz to achieve a finer PID controller, but the sensor Arduino only sampled measurements at 1 Hz and thus only needed depth/temperature measurements once per second), check to see if the sensor Arduino had a new depth value for the buoyancy system to maintain, and then run the next iteration of the PID loop to update the stepper motor position based on the current depth measurement.
As mentioned previously, the depth/temperature sensor communicated over I2C, and thus had to be connected to the I2C pins on the Arduino. While the depth/temperature sensor we used did not require any calibration, we still utilized a Blue Robotics open source library for interfacing with it. This library can be found here https://github.com/bluerobotics/BlueRobotics_MS5837_Library. Additionally, this sensor ran on 3.3V logic, rather than the 5V logic present on the Arduino. As such, a level shifter had to be connected between the Arduino and the sensor to properly step the Arduino->sensor voltage down to 3.3V and the sensor->Arduino voltage up to 5V (we used this level shifter https://www.amazon.com/gp/product/B07F7W91LC/ref=ppx_od_dt_b_asin_title_s03?ie=UTF8&psc=1). Don't forget to use this level shifter!! This expensive sensor is very delicate, and you do not want to risk frying it.
To control the stepper motor, we leveraged the open source Arduino library for the AMIS-30543 stepper motor driver, which can be found here https://github.com/pololu/amis-30543-arduino/. This library made it relatively painless to send messages to the stepper motor to have it move a given number of rotations at a given speed.
To implement the PID controller, the FastPID Arduino library (found here https://www.arduinolibraries.info/libraries/fast-pid) was utilized. Again, the well-developed nature of this library made it simple enough to generate a functional PID controller.
Unfortunately, we were never able to perform the final and biggest step of setting up the buoyancy control system: tuning the PID controller. With the looming due date for the project, we simply did not have enough time to perform the experiments needed for tuning the PID parameters properly. Because of this, we actually did not use the PID controller in our final system tests for generating notable results. We simply performed tests at two "buoyancy levels": one where the AUV floated (the syringes had no water in them) and one where the AUV sunk as far as possible (the syringes were pulled all the way in). In the future, having more time to perform this step would allow us to tune the PID controller to have fine grain control over the AUV's depth. The PID controller would also allow us to update this depth dynamically, as we would be able to send a new "desired depth" from the GCS, to the Pixhawk, to the Pi, to the sensor Arduino, and finally to the buoyancy control Arduino so that it could update the depth attempting to be achieved by the controller. Each of the necessary components (the full communication chain, the code for running the PID controller, the code for controlling the stepper motor, etc.) all worked independently, so in the future we would simply have to tune the PID controller and debug any issues associated with these experiments to achieve the goals just mentioned. Thankfully, we produced impressive results even without the PID controller.
-
14Adding a Data Visualization Tab to Mission Planner
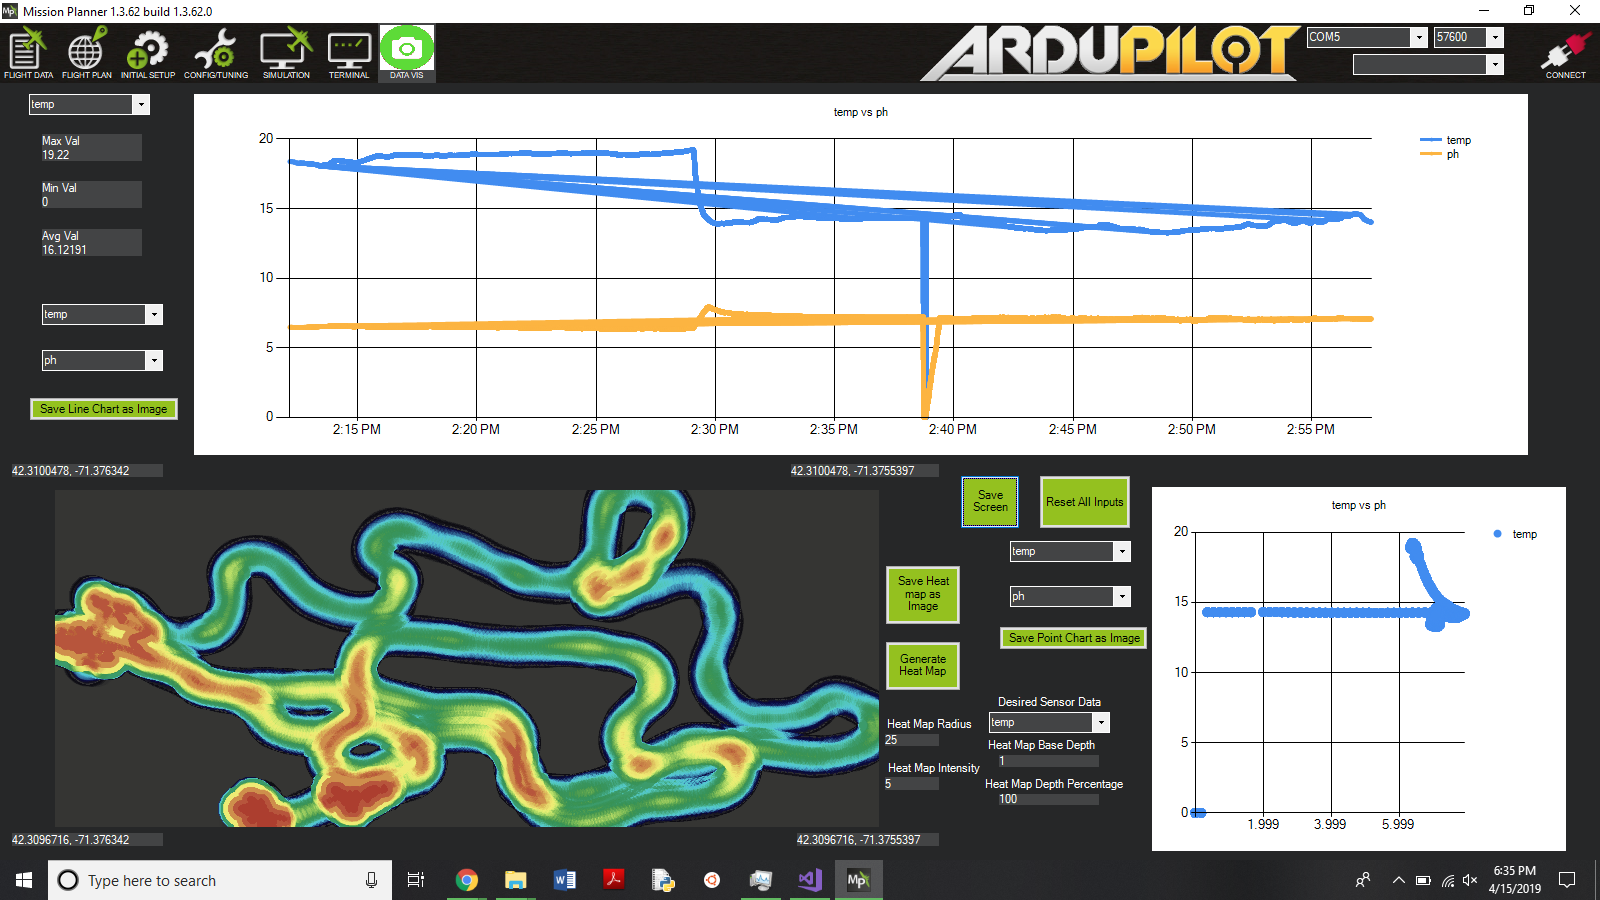
At this point, the whole system was created and working as designed. Therefore, the final step we completed before conducting our final system tests was adding a data visualization tab to the Mission Planner GCS application. The purpose of this data visualization tab was to allow the user to visualize the water quality data being captured by the AUV in real-time in a useful manner. Thus, we wanted this visualization tab to include useful visualizations such as temporal plots of quantities, scatter plots of one quantity versus another quantity, heat maps of a given quantity over the geography traversed by the AUV, and common statistics for a given quantity (mean, maximum value, and minimum value).
Again, as Mission Planner is a C# open source application, we modified it by using a Visual Studio C# development environment. To facilitate the creation of a new tab (as we had very little C# experience in our group), we simply took over the currently existing "Help" tab in Mission Planner and modified it to meet our needs. Standard C# GUI graphing tools in Visual Studio were used to generate the temporal plots and the plots of one quantity versus another quantity. Standard display boxes were used to display the common quantity statistics. The method explained here http://dylanvester.com/2015/10/creating-heat-maps-with-net-20-c-sharp/ was used to generate the heat map plot.
To make the plot generation real-time while not wasting resources, Mission Planner was modified to use the following method for handing the incoming water quality data. When the Data Visualization tab was not opened, all of the incoming water quality data would be saved to local RAM in the application. Then, when the Data Visualization tab was opened, the water quality data in RAM would be written to a designated CSV file on the ground control station's hard drive. The RAM would then be cleared, and the CSV file would be read to generate the plots. Thus, every time the Data Visualization tab was opened, the CSV file would be updated with the latest data and the new CSV file version would be used to generate the plots. In this manner, the Data Visualization tab maintained a real-time feel of operation, while not wasting too many resources within the application. This algorithm worked under the assumption that the user would open the Data Visualization tab a fair number of times throughout the mission being conducted, which we felt was a decent assumption to make.
A sample image of the Data Visualization tab we created (with real data from our final testing shown) is given below.
![]()
-
15Final Testing and Results Generation!
Project Albatross
Subsurface Data Acquisition using Semi-Autonomous Aquatic Robotics
Discussions
Become a Hackaday.io Member
Create an account to leave a comment. Already have an account? Log In.
Fantastic build, well and satisfyingly documented. Congratulations!
"This power would be a 24 V signal capable of drawing up to 3 A, potentially. However, based on our experience and on some online research, the 26 AWG wire in the Blue Robotics tether could carry a maximum current of 1 A safely."
A boost converter on the surface and buck converter underwater might be a candidate for this solution. Cooling might have been a problem, but perhaps some other constraint might have ruled this solution out?
"To make the plot generation real-time while not wasting resources,..."
A resource that is not used is wasted. What was the limiting resource?
Are you sure? yes | no