Close
0%
0%

Global radiation monitoring network

The uRADMonitor is a plug-and-play, low power, self contained radiation monitoring device, connected to a centralised server component.

Similar projects worth following
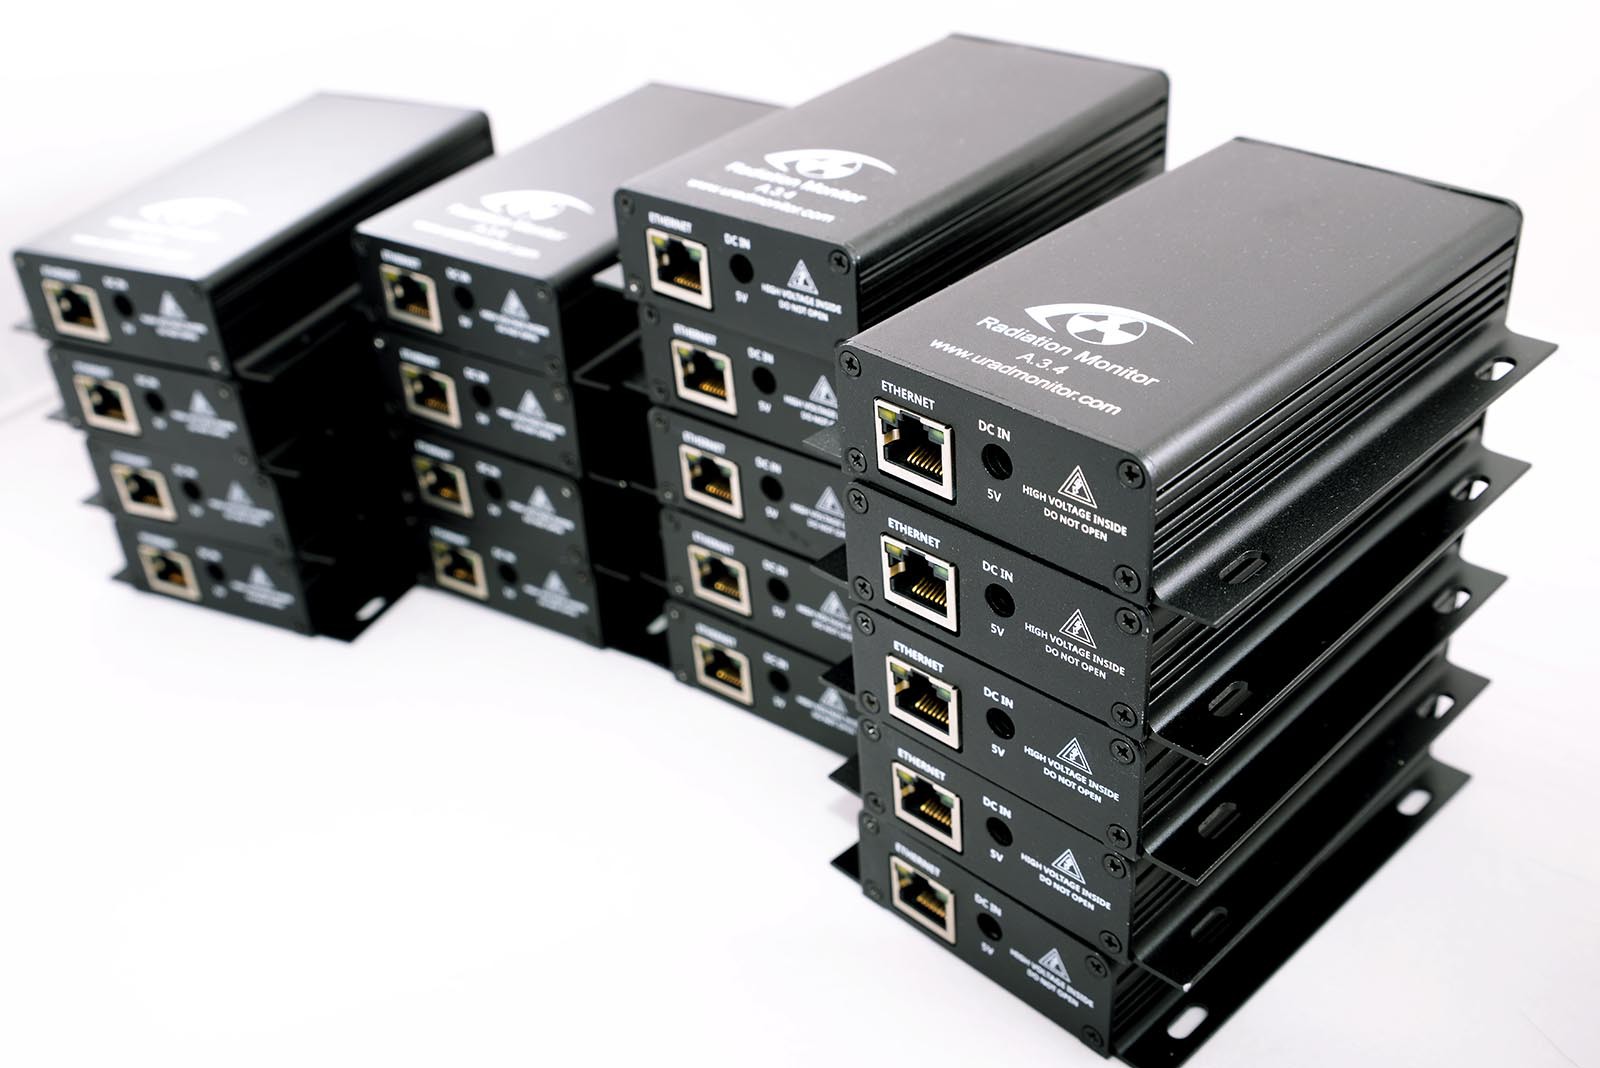
Hackaday Prize Semifinalist in 2014, the uRADMonitor Model A is a digital radiation dosimeter unit with a network interface to centralise the data online. It uses a Geiger Muller tube to sense the ionising radiation, and uses very little power to run. It comes in a rugged aluminium enclosure and can be installed outdoors, if mounted in vertical position, thanks to a rubber gasket that makes it rainproof.
There are several hundreds of such units distributed worldwide, in what has become World's first global Radiation Monitoring network.

In the beginning there was the passion for technology. I decided to start a blog and write about the things I've built. I was more into high voltage, physics and various experiments, cool, but with little or zero use to those around me. Then I decided it was time to build something useful, to put my time and energy into something that would eventually come to do good. I already had the high voltage inverters and a few Geiger tubes in my toolbox. In just a few minutes my first Geiger counter was clicking indicating radiation detection. It was early 2011.

May 2017 - The network today

The uRADMonitor project continued on its mission to cover the planet with IOT detectors. At first it was only measuring radiation, now it added multiple parameters that offer an insight on the quality of our environment.


November 24, 2014 - EEVBlog

Dave Jones, from EEVBlog, did a nice review of uRADMonitor and covered everything from unpacking the unit to powering it up and getting the data online, and suddenly, the whole World learned about uRADMonitor. Thank you Dave, you really helped this project get to where it is today!


September 12, 2014 - Stage 3 Updates and video:

The uRADMonitor is a digital radiation dosimeter, enclosed in a rugged aluminium case. Designed to function as nodes, in a distributed network of radiation monitors,the uRADMonitor units are working together to achieve environmental radiation surveillance on a global scale.

Connectivity is a key element of the uRADMonitor design. All units are reporting the readings to a centralized server, where anyone interested can evaluate radiation levels all across the globe.

The devices can be employed in local, personal use, when one needs to constantly monitor a particular location. But the true advantage of this technology comes on a larger scale, where multiple units are working together, to help us understand variations in radiation levels, as affected by weather factors (like wind or rain) or geographic location. This is how the value and interest in this technology moves from personal use, to corporate, scientific or community applications.

By interconnecting a large number of radiation monitors, we are permanently informed on abnormal variations, helping us to protect our health and interests. The units are low power, needing practically no maintaince work and the setup is easy with only a cable to connect to the power supply and an Ethernet cable to connect the uRADMonitor to the Internet router.

Because the network is using the same type of detectors, manually tested and checked against a common reference, all numbers and charts are comparable from one location to another, making it easy to understand changes and differences.

Taking advantage of a clean, innovative design, the path from prototyping to production was shortened considerably. We've improved the power consumption, the size of electronics and the number of components involved. The internal high voltage circuits are functioning side by side with the digital signal paths, showing excellent stability. Our tests went as far as months of continuous runs for observing all system parameters. Now we are proud of the result. With under 1Watt consumption, the uRADMonitor units can run on almost any power source, including green, regenerable sources like solar or wind.

Designed as distributed measuring units, with the entire infrastructure already implemented, the current design can be extended for other uses, for example adding air sensors for monitoring its quality. Or U.V. sensors for the sun activity, rain and wind sensors to complement the radiation data.

There is already a large volume of data flowing trough the uRADMonitor network every minute. We've centralized all data and made it available on the webportal. Everyone can understand the readings, even those without a technical background. The radiation data is shown in charts, where normal behaviour implies a constant level with minor fluctiations. In case of nuclear incidents or any...

Read more »

  • 1 × atmega328p Microprocessors, Microcontrollers, DSPs / ARM, RISC-Based Microcontrollers
  • 1 × Geiger Tube SBM-20 or SI-29BG Russian Geiger tubes made for the military - robust and very accurate
  • 1 × Aluminium Enclosure Rugged enclosure to make the detector indestructible.
  • 1 × enc28j60 mini module Great for opening the internet to microcontroller projects

  • Site v5.0

    Radu Motisan05/14/2017 at 18:24 0 comments

    The continuous improvements to the uRADMonitor network are demanding more changes both to the units themselves but also to the central infrastructure. While we saw considerable progress on the hardware side with the model D and the new model A3 and model CITY units, the server was also been in the attention with important new additions like the Dashboard or the Dynamic ID system used in the Open Source KIT1 hardware. And since the last 4.0 upgrade, these are just a few of the many new features implemented.

    To summarise the new v5.0 frontend in a word, that would be “dynamic”. Both the maps and the charts are interactive, and this translates to better access to the data. With the new uRADMonitor detectors (like the model D that runs on battery and has a built in GPS), the frontend had to support a new class of uRADMonitor devices, the mobile units. Here’s a demo video presenting these units and the support we added for them:

    To iterate some of the things presented in the video, the major features include:
    1.Mobile units support
    The map will refresh automatically to update the position of mobile units in real time. Speed and altitude are displayed, while the readings in the chart will update accordingly. Make sure the “Automated refresh” option is enabled, and your unit is selected (Blue dot). In “Cluster” and “Gradient” visualisation modes, the mobile units are displayed as triangles, while the fixed units are represented as squares. A cluster of units is a circle, with its size proportional to the number of units contained.

    2.History view
    If History view is enabled in the left menu and a mobile unit is selected, you will see the history chart at the bottom for the time interval you’ve selected, but also the corresponding path that unit covered on the map. This powerful feature will quickly identify various measurements to their exact location on the map.

    3.The left menu
    Includes two new selectors: one for the sensor parameter and one for the time interval. You can use them to see uniform global data on the map. If a particular unit is equipped with the sensor you’ve selected (eg. Temperature), its last 24hours average of the particular measurement will appear on the map. The default visualisation view is set for “Clusters”, meaning nearby units will be joined in clusters, depending on the zoom level, to make the vizualization cleaner and easier to follow. The clusters will be labeled with an average of all the units included, and the circle symbol will have its size proportional to the number of units included.

    Clicking a cluster will zoom in to its comprising area, while also showing the contained units at the bottom. Click them to open:

    4.Direct ID access
    When you click a cluster you see its comprising units. You can click these IDs to open a particular unit and see the readings history. If you want to open a unit directly, you can still use the previous syntax:
    http://www.uradmonitor.com/?open=ID
    Here is a quick example to that: http://www.uradmonitor.com/?open=11000017
    5.Visualisation options
    The other visualisation options include Simple, Gradient, Heatmap and Cluster, use them as needed. Change the Sensor selector to the value you are interested in.
    The heatmap presents a color function that takes both the weight and the density as arguments. Keep that in mind when interpreting the visual representations. Zooming in will be needed to remove the density factor if color interpretation is required.

    5.Legend
    For the “Clusters” and “Gradient” visualisation methods, a Legend is displayed at the right-bottom corner of the map, to provide a quick indication on the scale of the values represented on the map. The legend will show a minimum and a maximum value, and the Unit of Measure of the sensor you selected. For example, PM2.5 will use micrograms per cubic meter, while CO2 will display in ppm (parts per million). Radiation will show in microSieverts...

    Read more »

  • First IndieGogo funded unit went ONLINE

    Radu Motisan02/16/2016 at 13:04 0 comments

    header_110000E0

    There are now three uRADMonitor units running in Poland. The last one went online this month, and even if it’s technically similar to the other two by being a model A unit, it is special because it’s the first indieGogo funded unit to go online, part of the first batch of perks delivered.
    poland_110000E0
    Thanks to the great people that supported this project. Here’s how the network takes shape right before our eyes, thanks to your trust in this work.
    To access the unit readings and see the measured values of that area in Poland, click here. More units are currently in transit, and will go online soon, part of the campaigns scheduled calendar.

  • Right on time

    Radu Motisan01/27/2016 at 10:55 0 comments

    Following the successful indieGogo campaign, we are now ready to deliver the first perks to our backers, right on time, as promised, with the first batch of model A units. Thanks to the community supporting this amazing project!

    More details on https://www.indiegogo.com/projects/uradmonitor/x/7951265…

  • Weather vs Radiation readings

    Radu Motisan08/04/2015 at 11:30 0 comments

    The correlation between weather factors and background radiation levels have been investigated in an experiment that took place in Australia.

    David put together one uRADMonitor unit and a weather station, and aligned the output data using a python script.

    wind

    As David explains:

    "I’ve been running uRAD unit #12000003 here in Australia for around 12 months now and the only time I’ve really seen a solid increase in readings is during heavy rain which got me thinking, what other weather conditions affect radiation levels?"

    weather

    See the tools he used and more details on Weather vs Radiation readings

  • uRADMonitor in Shenzhen, China

    Radu Motisan05/17/2015 at 13:08 0 comments

    14_07_11_headerUnit 1100007D went online in Shenzhen, China, showing slightly elevated radiation readings:

    1100007D_uradmonitor_china
    This unit is located in an industrial electronics production centre. Its purpose is more connected to future uRADMonitor production than to environmental surveillance, so the readings might go offline from time to time.
    1100007D_china
    Other units in that part of the world, include the 1100008D in Taiwan, and the 11000080 in Japan, but unlike the 1100007D these last two show normal readings.

  • uRADMonitor KIT1

    Radu Motisan03/08/2015 at 14:48 0 comments

    uradmonitor-kit1-pcbtop

    uRADMonitor KIT1 is the first open source DIY dosimeter KIT, that can be used to collect radiation measurements and push them to the uRADMonitor network. Similar to model B that is to be released later this year, the KIT1 is intended for those interested in building their own radiation devices and contribute to the uRADMonitor network.

    The device was designed so that it an be easily reproduced by DIY enthusiasts. It features a single layer PCB and solely trough hole components.
    uradmonitor-diy-kit-06

    The PCB file, and the firmware source code are available on the project's page: http://www.pocketmagic.net/diy-dosimeter-geiger-counter-kit/ . The code is hosted both on Google code and Github, all those interested are welcome to contribute.

  • 200 uRADMonitor units deployed

    Radu Motisan03/01/2015 at 15:07 0 comments

    As you know, uRADMonitor was one of the HackADay.io 2014 semifinalists. The competition brought together a lot of excitement and constructive energy, but for some of the competing projects it went as quickly as it came, leaving only deserted project pages behind.

    We would have chosen the space trip, like true hackers do, but uRADMonitor didn't win the competition. Yet it is still going, building on the exposure it got from this great event, and only a few months later, the global network of radiation detectors has reached an exciting number of 200 deployed, interconnected units, moving a DIY project to an unprecedented scale.

    uradmonitor_devices_feb_2015
    The new locations are many and it would be a rather complicated task to name them all in a decent size blog post, but iterate just a few, the additions include:

    uradmonitor-australia-new-zealanduradmonitor-italy
    uradmonitor-united-kingdom-isle-of-man-irelanduradmonitor-norway-sweden
    uradmonitor-moscow-russiauradmonitor-istanbul-turkey
    uradmonitor-franceuradmonitor-estonia
    uradmonitor-british-virgin-islandsuradmonitor-austria-czech-republic-hungary-slovakia

    With this impressive increase in units reaching two hundred, the volume of global radiation data collected has gone up as well, getting closer to a total of 20 million entries.
    uradmonitor_total_data

    The stats show a major presence of uRADMonitor units in the United States, followed by Australia, Germany, Canada and Great Britain. The column marked TMP represents mostly units currently in transit or waiting to be installed.
    uradmonitor_units_per_country
    Join now to contribute to this community global radiation monitoring project and help the network expand even further!

  • uRADMonitor + RESTful APIs + Encryption = v111

    Radu Motisan02/26/2015 at 22:24 0 comments

      With the uRADMonitor network covering more ground, constant effort is invested in making the project serve its purpose better. Code improvements come with extra features or better stability, and new firmware updates are released to anyone interested in upgrading their units.

      Firmware 111 is the latest code released for the uRADMonitor model A units. We are excited to announce a set of changes that is the start of several improvements impacting both the hardware devices and the server infrastructure.
      restful_api_uradmonitor

    • RESTful APIs. Easy to understand, maintain and extend, this will handle all data interfacing. This is also a first step in supporting custom DIY detector units that wish to join the uRADMonitor network, in an effort of expanding Global coverage even faster.
    • in compliance with the new API, we'll use HTTP POST requests for all unit data uploads, while we reserve HTTP GET transactions mostly for data access part of the new API. New Standards are getting in place.
    • Encryption and integrity control. In early versions all resources were invested in getting the job done, and ignored the possibility of cybernetic attacks. Since this is not a perfect world in regards to people with bad intentions, and to protect the integrity of the data we deliver – firmware v111 is the first to integrate advanced encryption techniques, to make sure the data sent from the uRADMonitor units arrives unaltered to the servers.
    • embedded code improvements to speed, memory size and stability, as well as some bug fixes related to JSON formatting and temperature readings.
    • More details here: http://www.uradmonitor.com/new-firmware-v111/

  • The Compensation Capacitor

    Radu Motisan02/18/2015 at 21:49 0 comments

    Normally, the Geiger tube delivers a sharp short pulse, with an abrupt descending path, as the quenching gas very quickly neutralises the conductive ions, and so terminating the current flow. The uRADMonitor pulses appear with a slightly rounded tip because an extra capacitor is added in the circuit, named the "compensation capacitor". All uRADMonitor model A units have this capacitor:

    compensation_capacitor
    Here is the original pulse, as recorded on an uRADMonitor model A unit, with the compensation capacitor removed (left picture) and a similar pulse, with the capacitor in place (right picture):
    geiger_oscilloscope_compensation_capacitor
    The first pulse has an amplitude of 8.48V correctly verifying the resistive voltage formula presented previously, while the second image shows a dampened pulse with a rounded tip and a decreased amplitude that is little over 5V, as an effect of the extra capacitance. Note the voltage divs are different in the two images.

    The role of this compensation capacitor has been further explained here: http://www.uradmonitor.com/compensation-capacitor/

  • Checking the Geiger tube

    Radu Motisan02/18/2015 at 00:16 0 comments

    uradmonitor_oscilloscope_geiger_pulse

    The Geiger tubes used in uRADMonitor model A units are mostly the SBM-20 or the SI-29BG, both of Russian provenience, manufactured at military grade specs. Therefore they were meant to resist fluctuations over a wide interval of temperature or pressure. If a tube failure is suspected for a particular uRADMonitor unit, for example when the number of counts per minute reported shows zero, checking the Geiger tube might be necessary, and the following indicators should be verified:

    Voltage on tube

    Assuming the uRADMonitor unit is otherwise functional, it should first be connected to the LAN Network to get a valid IP, so that it can be accessed locally by opening the IP in the web browser:
    uradmonitor_web
    The voltage on tube is displayed in the web interface, together with several other parameters. The voltage on tube should read 380V +- 5V. The duty cycle must be between 25% and 45%.
    This method of checking the tube voltage is preferred over directly measuring high voltage inverter output for a several reasons:
    – it is safe: no electric shocks can accidentally occur by touching the high voltage sections of the circuit
    – a high impedance voltmeter would otherwise be needed to directly measure the voltage on the board. A 10M impedance voltmeter (or higher) would be needed to measure the voltage directly, to avoid the voltage drop and so erroneous readings to a maximum extent. The high voltage inverter is a low current high voltage supply.
    If both the "radiation" and the "average" fields show zero while the "voltage" is correctly measured close to 380V, it could indicate a tube failure. For certainty in this case, direct tube verification is needed, and the following approaches should be used:

    Geiger tube pulses

    The purpose of the Geiger tube is to count radiation induced pulses. When the tube internal environment is ionised by intersecting radiation, it becomes conductive for a very short amount of time. The anode (for example 10M) and cathode (for example 220K) resistors form a resistive divider. If the signal is collected from the cathode, then the maximum pulse amplitude for 380V across the entire assembly will be Vout = 8V according to the following calculations:
    voltage_divider
    To test the tube is functioning properly, we need to check it is able to count radiation pulses. In the absence of an active radiation source, the background radiation can be used as a source, which for the SBM-20 should be about 20CPM (counts per minute), depending on the particular region. So a first test would be to see if the tube registers any pulses, and to count them to see if we get the expected number, that is approximatively 20 pulses in a minute. Due to the random nature of radiation, we will get more or less, but repeated tests should slowly tend to reach this value. On the other hand absolutely no pulses at all, would clearly be an indication of tube failure.

    The following tube tests can be used: http://www.uradmonitor.com/checking-the-geiger-tube/

View all 57 project logs

Enjoy this project?

Share

Discussions

ghzatomic wrote 07/03/2014 at 15:38 point
Very nice man ... great project ... i hope to help the world with my projects as well as you

  Are you sure? yes | no

Radu Motisan wrote 07/03/2014 at 20:44 point
Thank you, let's hope for the best!

  Are you sure? yes | no

paolo wrote 06/29/2014 at 17:39 point
you can add more sensors:
pollution sensor
co2 sensor
radon sensor
uv sensor

  Are you sure? yes | no

Radu Motisan wrote 06/29/2014 at 20:31 point
I did for the first station built, see: http://www.pocketmagic.net/2012/10/uradmonitor-online-remote-radiation-monitoring-station/#charts . But for these distributed detectors, I need to keep a balance between costs and reaching the target. What I presented here is the Model A, there will also be a model B, featuring temperature and barometric pressure sensor (needed to estimate altitude).

  Are you sure? yes | no

Victor Cazacu wrote 06/29/2014 at 14:19 point
Awesome work Radu! ;)

  Are you sure? yes | no

Radu Motisan wrote 06/29/2014 at 20:30 point
Thank you!

  Are you sure? yes | no

Mads Barnkob wrote 06/29/2014 at 12:19 point
Great to see this project! Most of the other distributed radiation networks is only concentrated in the US with a few measurements from Europe.

I am really looking forward to a greater number of monitors spread around the globe and the possibilities to visualize the data with the google maps API.

Keep up the good work!

  Are you sure? yes | no

Radu Motisan wrote 06/29/2014 at 12:23 point
Thanks Mads!

  Are you sure? yes | no

Łukasz Przeniosło wrote 06/29/2014 at 10:04 point
Hey there, great project :). One thing i noticed regarding projects containing ethernet connection is that ppl still tend to use the enc28j60 chip with an 8 bit mcu instead of a 32 bit mcu with ethernet pheripheral on board.
This isnt an attack on your project of any sort! It was just an outloud thought. I wonder either this trend is going to change anysoon.

  Are you sure? yes | no

Radu Motisan wrote 06/29/2014 at 10:14 point
Most likely yes, as things evolve, despite there being a rather large inertia on change. Personally I opted for this combination based on previous experience, and for this project there so many obstacles - I had to choose things I knew they would work straight ahead, where possible.

  Are you sure? yes | no

Does this project spark your interest?

Become a member to follow this project and never miss any updates