Radu Motisan
-
Producing the uRADMonitor – New units available
11/14/2014 at 22:39 • 0 comments![14_11_14_header]()
In an effort of expanding the network even further, several new units have been prepared and are ready to ship. But, creating a device that will function perfectly in a distributed environment is not an easy task. Yet, from its relatively early start, uRADMonitor has already spread to all major continents and continues to grow.
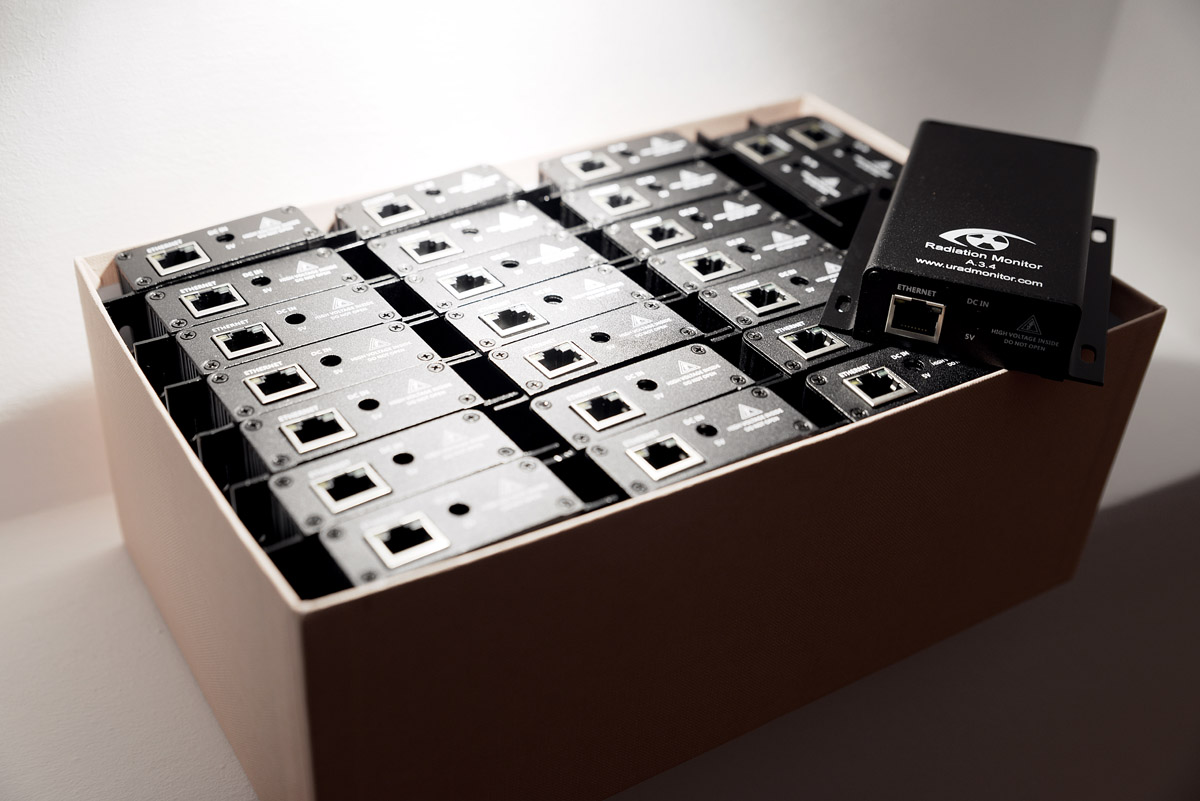
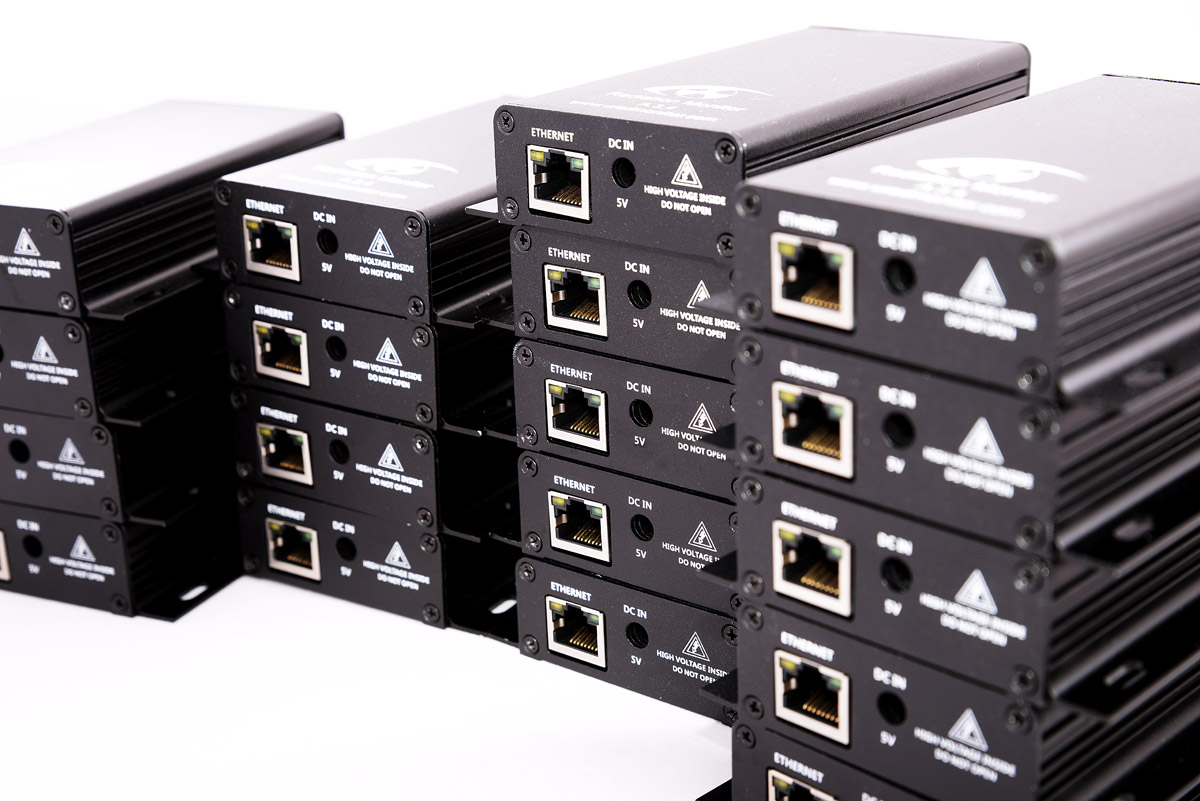
![uRADMonitor_new_units_10]()
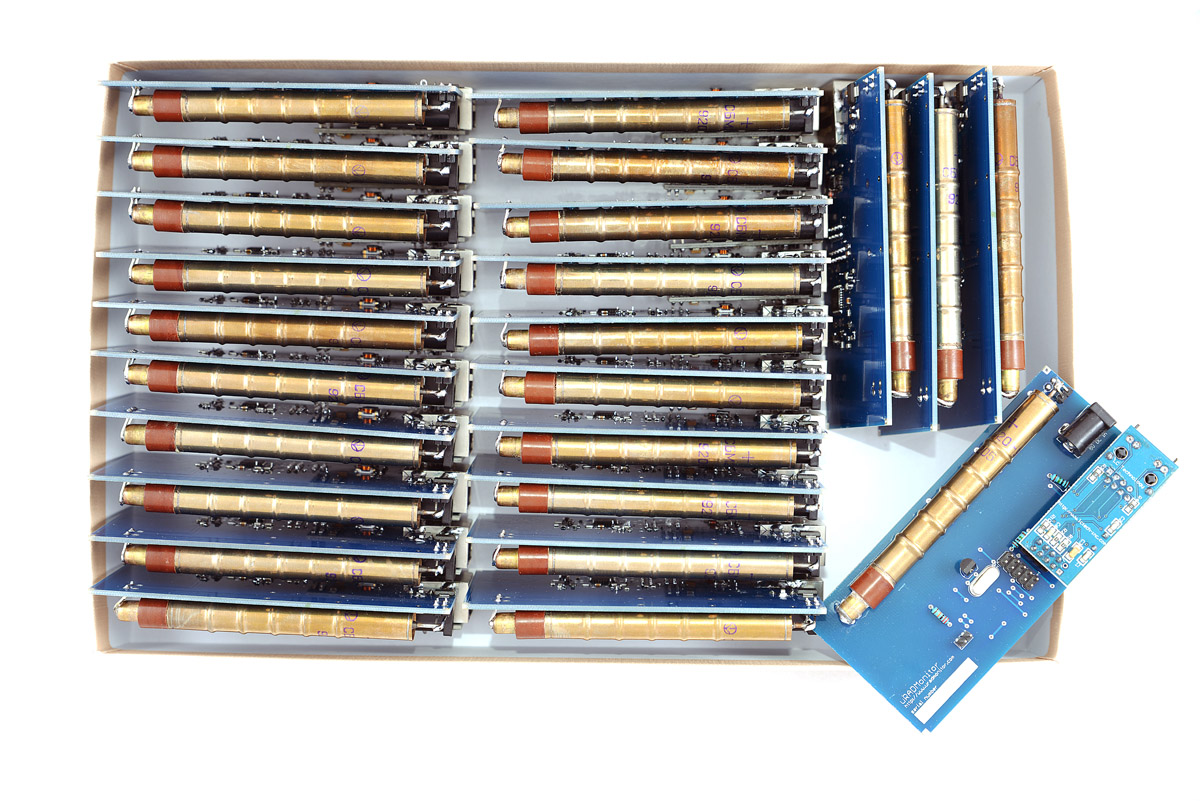
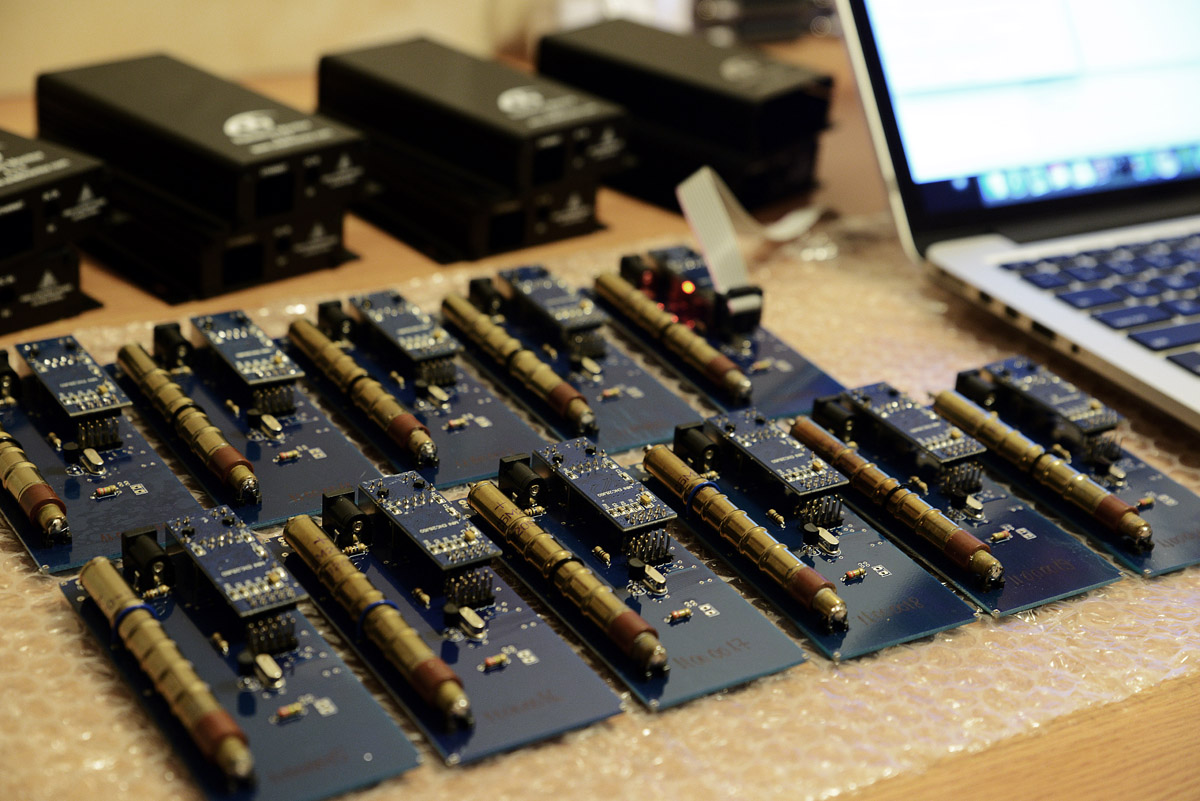
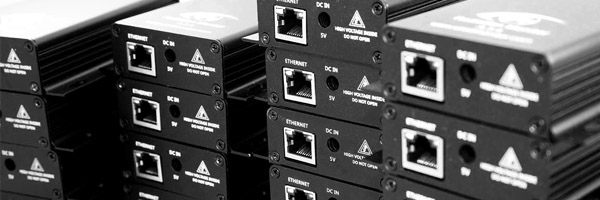
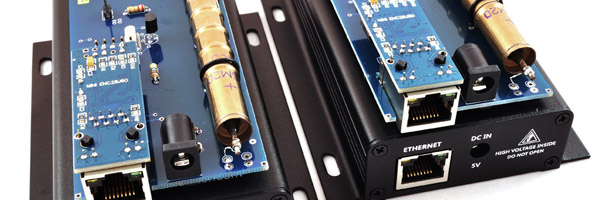
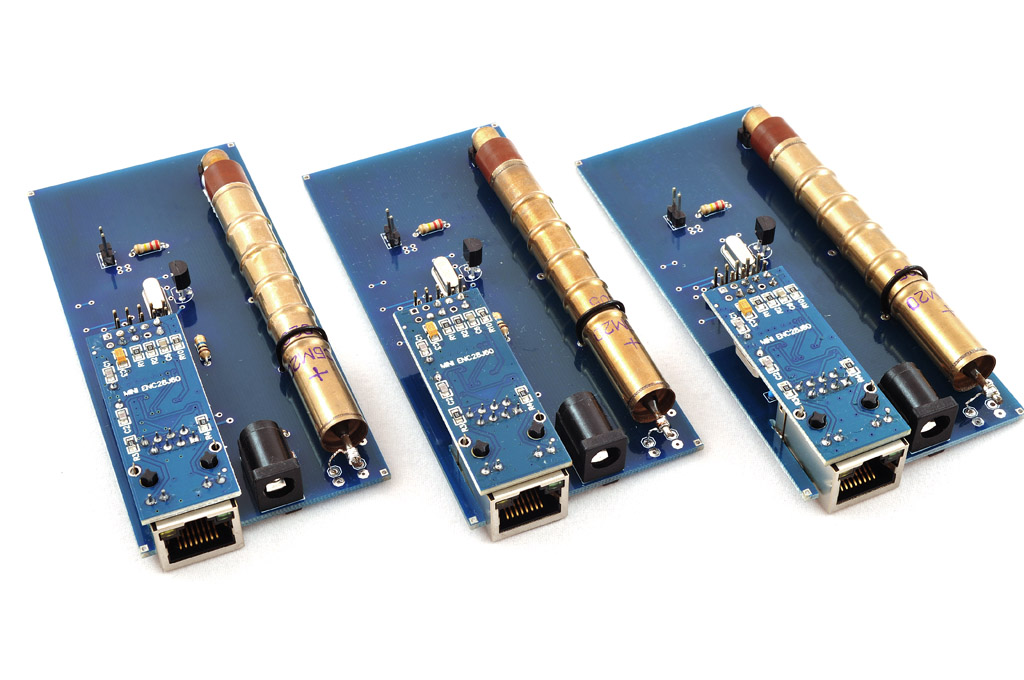
The entire process starts with the uRADMonitor circuit board, the most delicate and time consuming component. At the beginning of the project, manufacturing the PCBs was a laborious manual task. But now the preassembled PCBs with most components soldered are saving precious time. Even if produced in a specialised factory, the PCBs can still have issues, so they are carefully inspected, and any problems corrected. Finally, the Geiger Tubes are connected and so this step is completed.![uRADMonitor_new_units_06]()
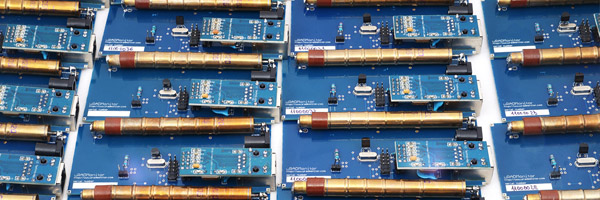
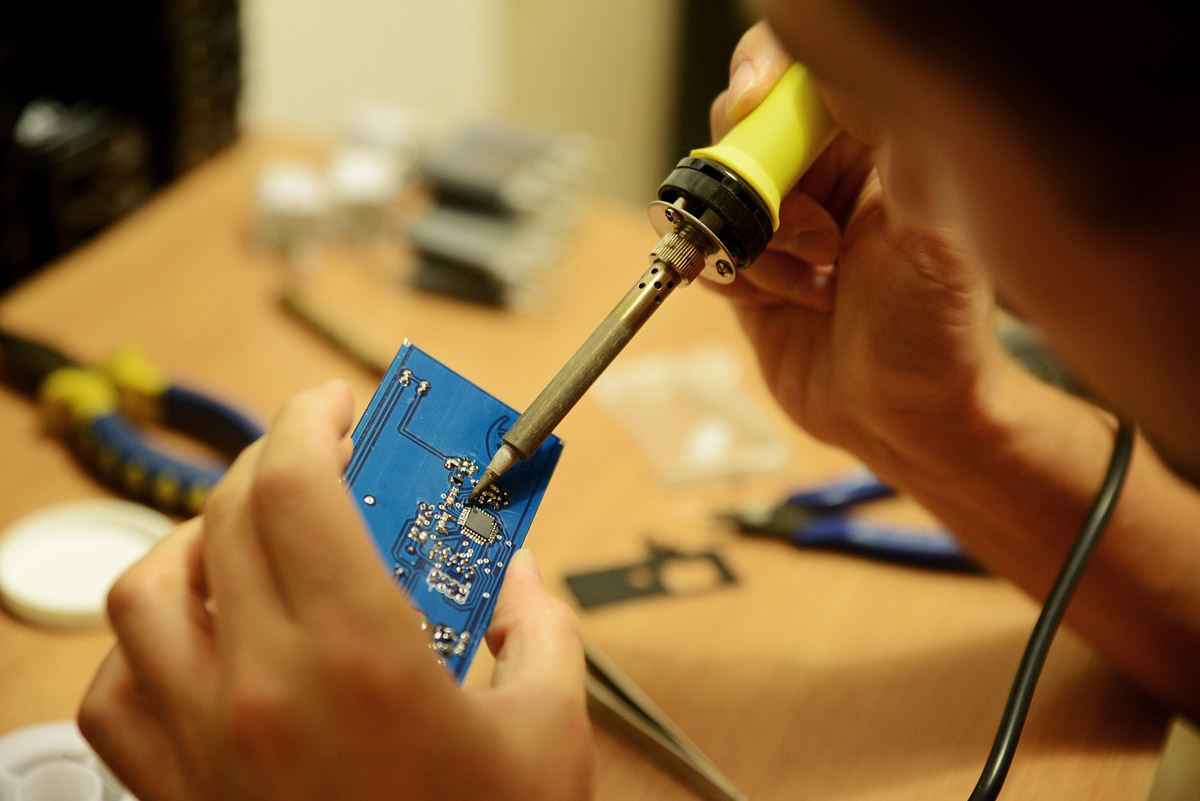
Next, the software must be written into the microcontroller's memory. The software is unique to each unit, because of the Device ID, allocated one for every unit. Using a programmer, the units are connected to a computer so the code can be downloaded. One at a time.![uRADMonitor_new_units_02]()
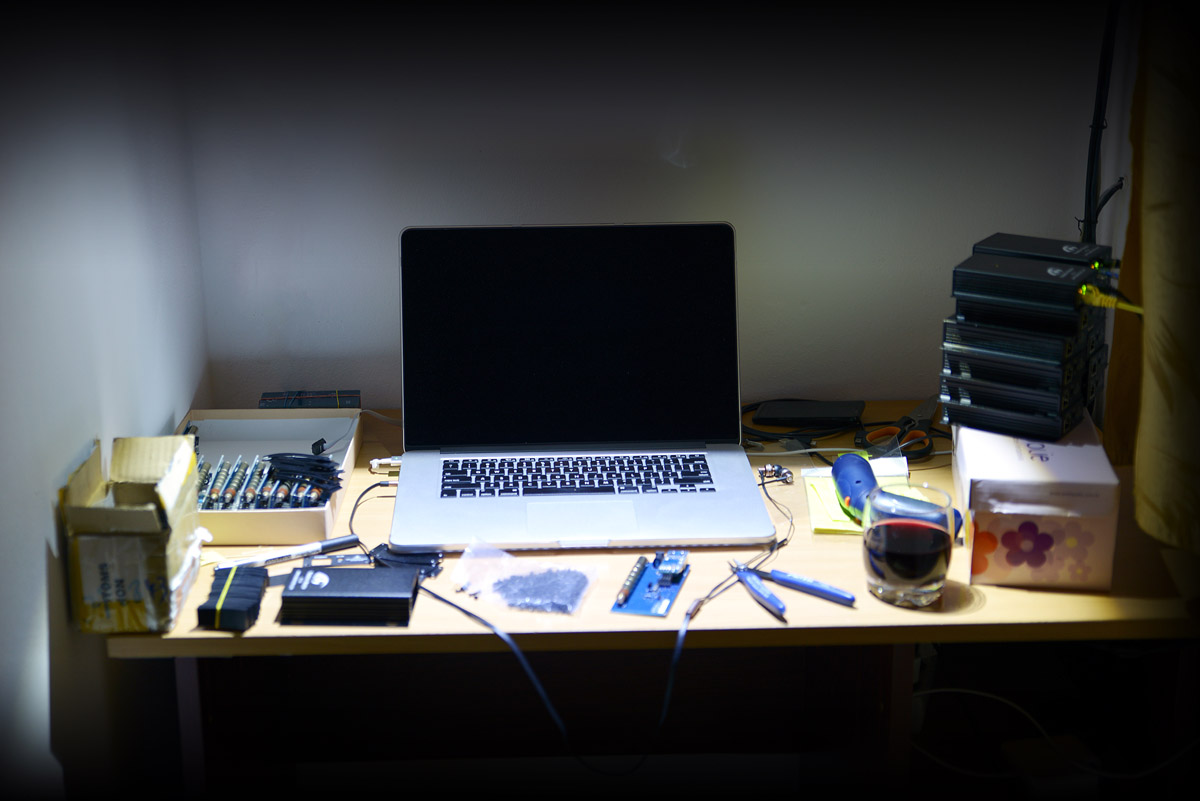
The units are then tested: network connectivity, sensor readings, inverter parameters, duty cycle safety limits, Geiger tube readings for background radiation and a fixed radioactive source. Usually 20% won't work on first run, and corrections are needed. Sometimes bugs are hard to track: dead Geiger tubes, wrong value resistor in the voltage divider feedback circuit affecting the inverter output voltage, unsoldered pins/pads resulting in 0 radiation readings, or many other original and intriguing issues. Detecting the causes and correcting the problems takes time:![uRADMonitor_new_units_03]()
![uRADMonitor_new_units_08]()
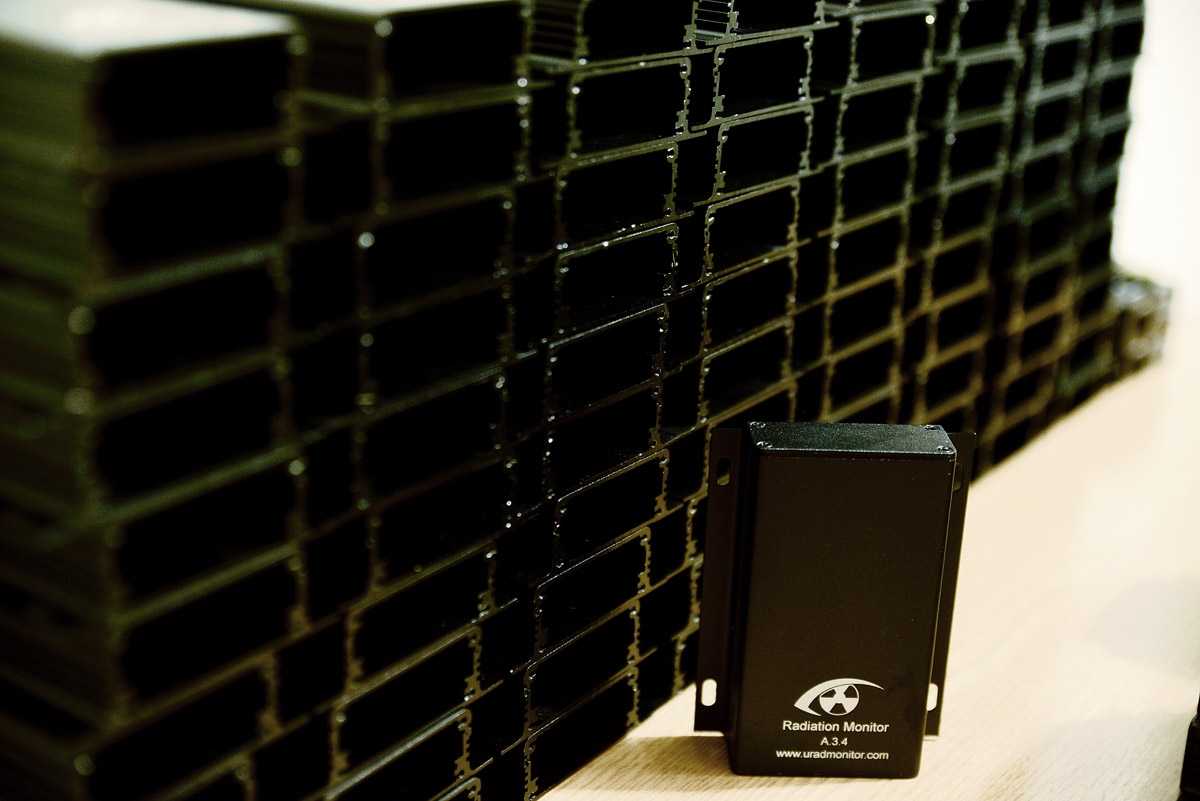
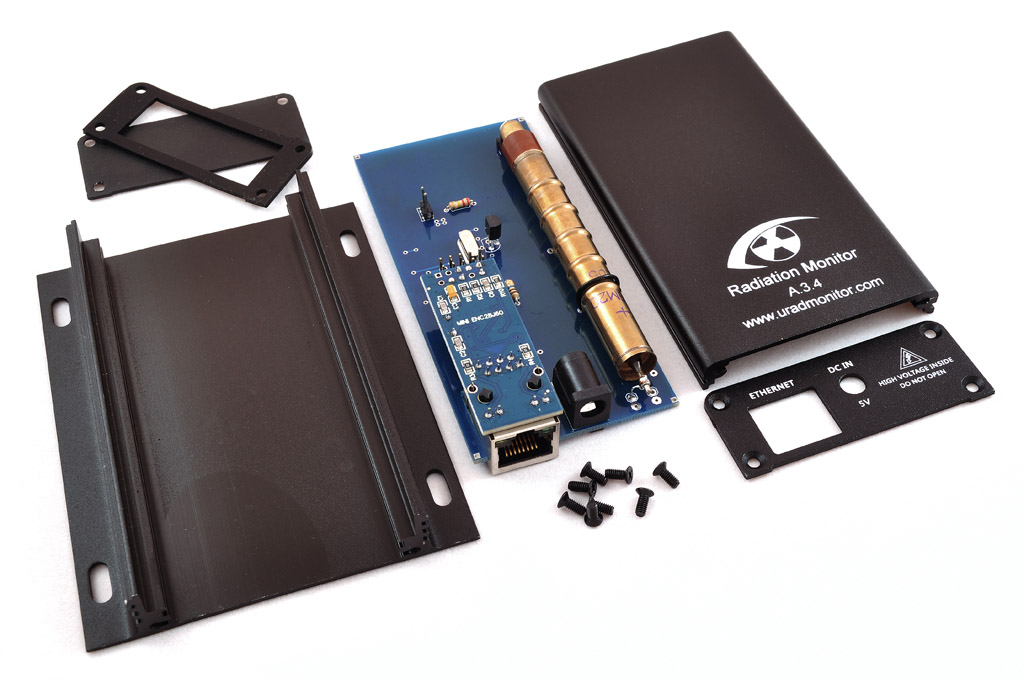
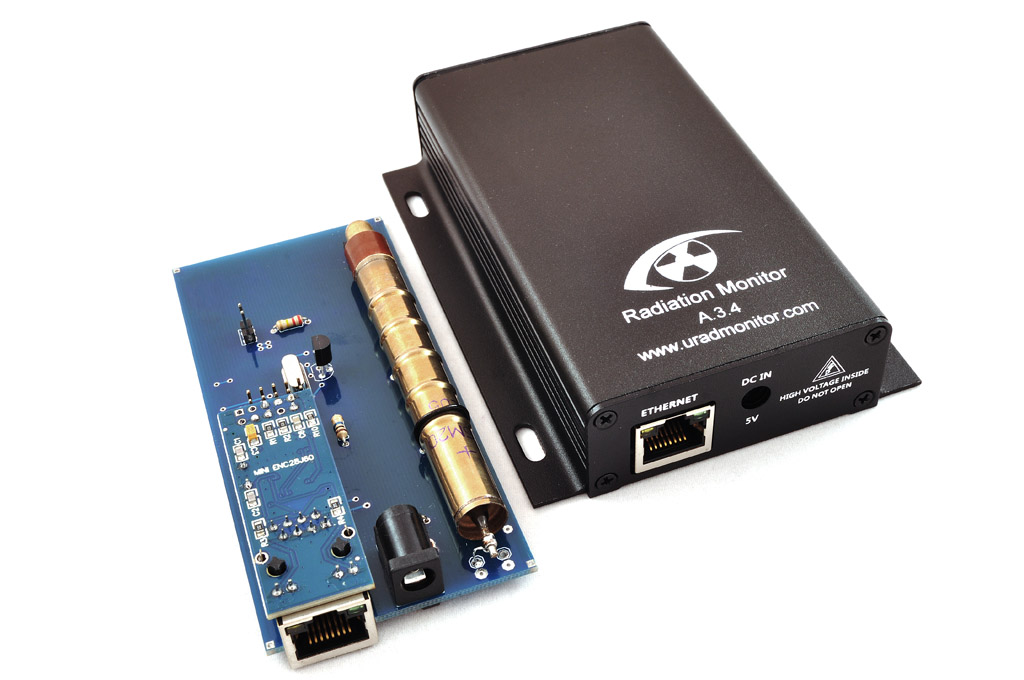
The Aluminium cases are composed of two metallic parts that join together and a rubber gasket to seal the top end and 4 screws on each side. Everything is mounted together:![uRADMonitor_new_units_04]()
The PCB is inserted, a small wooden piece is added to lock the PCB in place and the open lid is closed. Finally, a fully functional unit is ready.
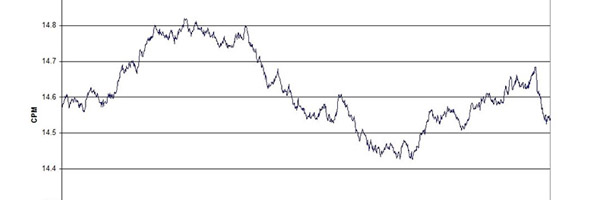
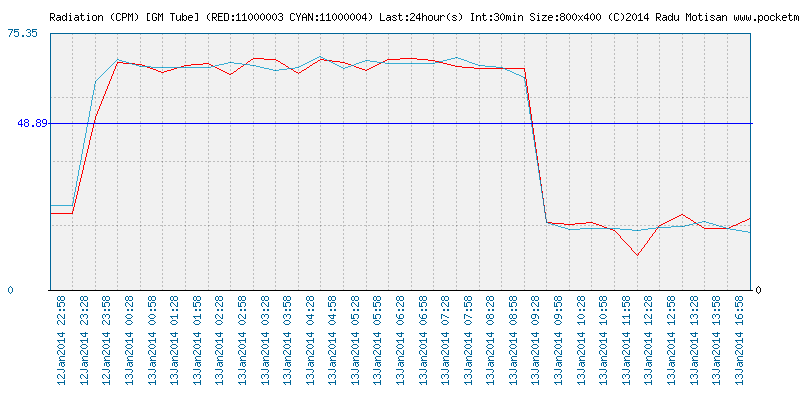
A long run test of exposure to a fixed dose radiation source is started, while carefully paying attention to distance and geometry. The results are compared to a fixed reference. Any considerable differences will indicate an issue with the Geiger tube that would be replaced. Here is an example of measurements collected during one of these tests:![11000003_11000004_cpm]()
One colour corresponds to the unit under testing, while the other colour is the reference unit. The radiation source is placed symmetrically to the two. Obviously, the measurements must match.By involving careful manufacturing and testing procedures, where enough time is allocated to every single unit, we can guarantee the consistency of the results provided by the uRADMonitor network. We believe this is a key feature of our technology, allowing direct comparison of the measurements presented, regardless of unit or location, giving us a clear indication on variations and their causes.
-
Several new units went online worldwide
11/12/2014 at 12:23 • 0 comments![14_11_12_header]()
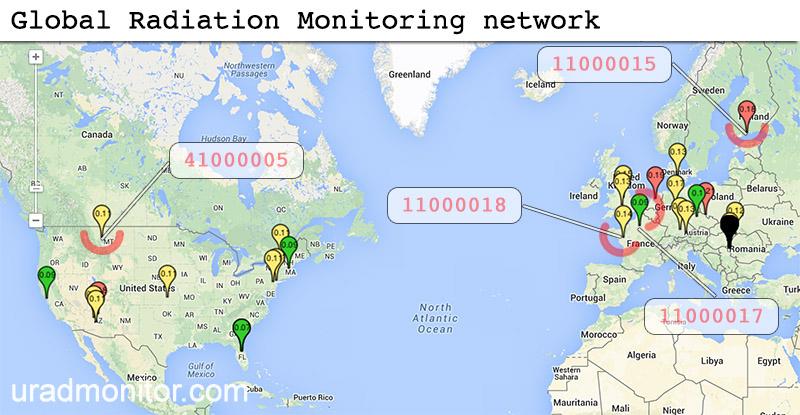
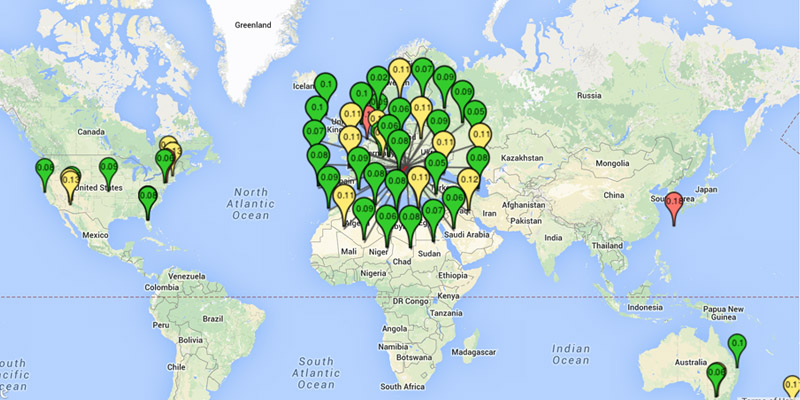
Following the large number of units recently shipped out, several new units went online in various corners of the World:
![dosimeters_network_multiple]()
- 41000005, in Belt, Montana, US
- 11000015, in Helsinki, Finland
- 11000017, in Paris, France
- 11000018, in La Breille les Pins, France
As these new devices reached their destination and were connected to the Internet, all 4 popped up on the map automatically. The uRADMonitor units were designed to be as close as possible to plug and play. The localisation works using the external IP addresses, but in some cases the position on the map is adjusted manually, to better suit the user's interests (better privacy or better accuracy).
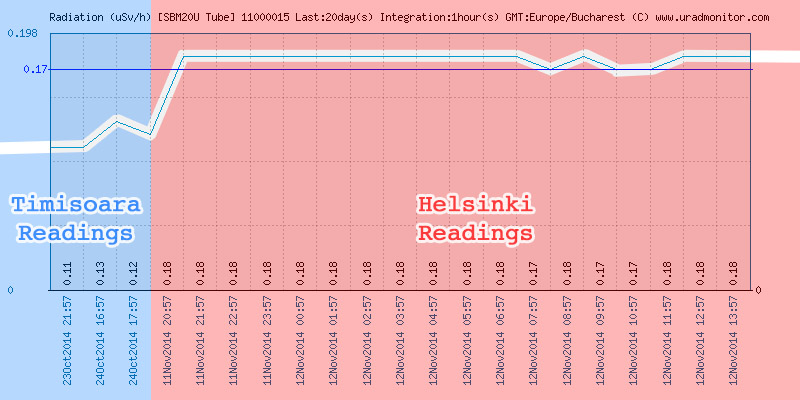
All the above units show normal readings, except the one in Helsinki, where we probably see another case of naturally occurring higher radioactivity, similar to the situation in Česká Čermná:
![11000015 high readings Helsinki]()
This will be investigated and discussed in a separate article, soon.At this point it is increasingly difficult to post articles on a single unit only. This, of course, is correlated to the fact that the network is expanding fast, which is good news. For those interested in hosting their own units, see the Join the network section.
-
Multiple new units joining the network
11/07/2014 at 23:23 • 0 comments![14_11_07_header]()
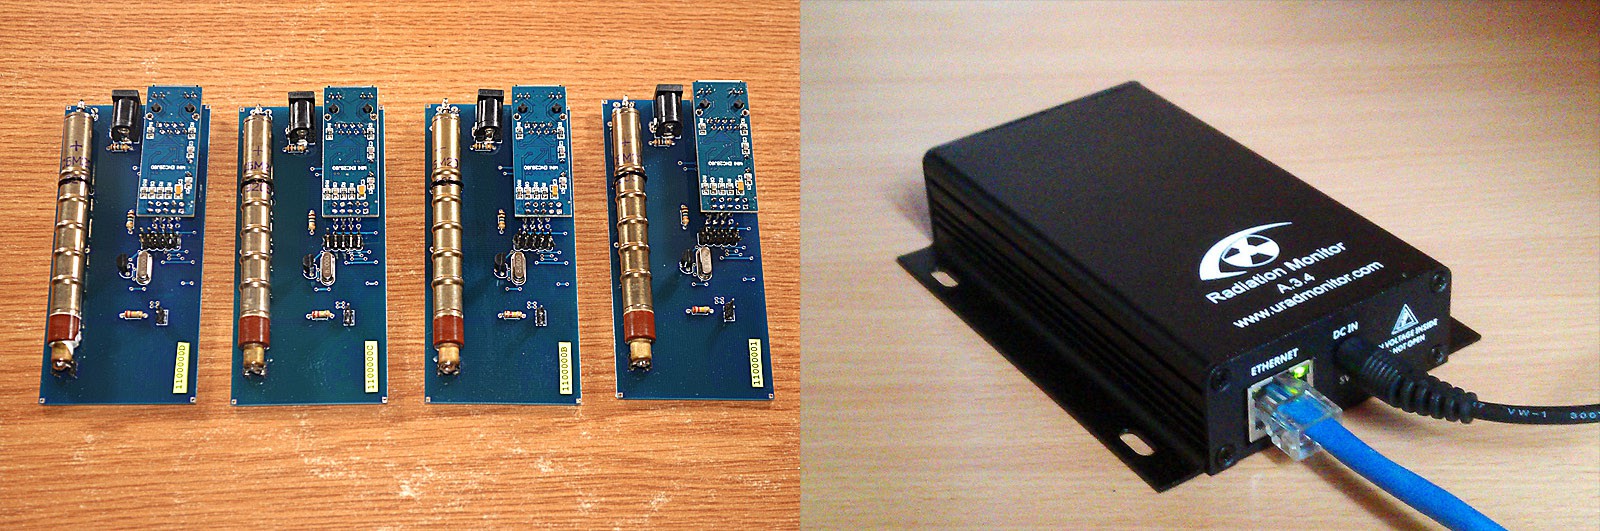
Some of you might have noticed the high number of units that recently appeared on the map around Timisoara. They are part of a new batch of units with some of them already in transit to locations all across the Globe. The units were tested and calibrated manually, to make sure they will function perfectly. As they reach their destinations, the spiral formation on the map will unfold, and we will see the new units being moved automatically at the new coordinates.
![new_units_uRADMonitor-1]()
It's been a huge effort developing enough units to cover all the major locations but it's worth it. Thank you to all of you for supporting this project.![uRADMonitor_6]()
![uRADMonitor_7]()
More improvements will follow shortly, focusing mainly on improving the webportal and the data access. A mobile application is also scheduled for before the end of this year. -
Brisbane, Australia joining the network
09/19/2014 at 09:11 • 0 comments![14_09_19_australia]()
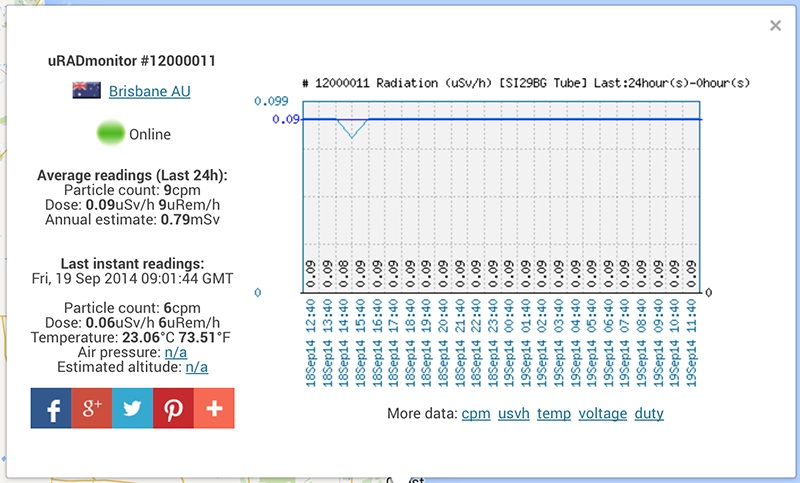
Unit 12000011 just joined the network from Brisbane, Australia, as the third unit on this continent. The measurements show relatively low radiation levels:
![12000011_values]()
And here is a comparison to initial tests done in Timisoara:![12000011_initial]()
-
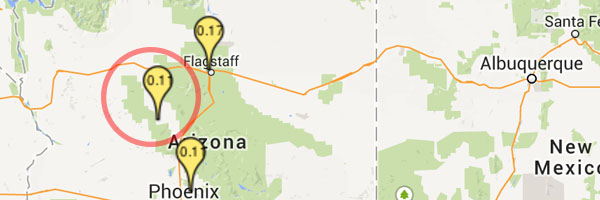
New unit in Arizona
09/07/2014 at 23:35 • 0 comments![14_09_05_header]()
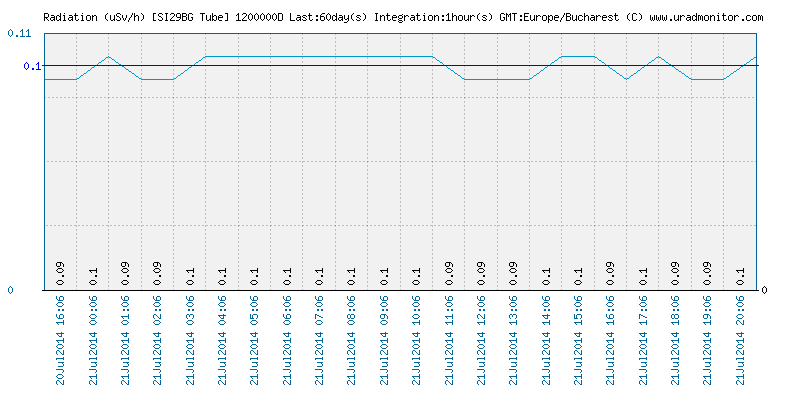
The 10th unit in the US is now online from Prescott, Arizona. The average measured radiation level is currently at 0.11uSv/h:
![1200000D]()
Very similar to initial measurements in Timisoara:![1200000D_initial]()
-
Model A – Production Ready!
09/01/2014 at 20:46 • 1 comment![14_09_01]()
The uRADMonitor Project is a network of radiation detectors covering locations all over the Globe. The Model A is the first designed, it is an automated GM detector in a rugged aluminium housing which responds predominantly although not exclusively to gamma radiation. Count rate data is recorded and transmitted continuously via built in Ethernet adapter to the central server of the uRADMonitor network. Real time measurements from each of the units in the network are available on www.uradmonitor.com.
![uradmonitor_model_A_2]()
Following months of improvements, tests and verifications, both in hardware and software, the final model A design has been put into production and first batch of test units is now available. These will be used to expand the network even further. The quality of these units is impressive: small in size and optimised for low power consumption, they are ready to keep an eye on the radiation levels as independent radiation monitors.![uradmonitor_model_A_4]()
![uradmonitor_model_A_3]()
This first civilian open network of distributed detectors takes advantage of geographic dispersion, similar design with reasonable calibration, constant autonomous monitoring, all at the cost of very low power consumption.![uradmonitor_model_A_1]()
Getting a unit
To get a device and join the network, see “Join the network”. There is also one unit listed on Ebay: http://www.ebay.com/itm/131285294964 -
Just a teaser
08/27/2014 at 10:54 • 0 commentsA picture says more than a thousand words. So be it:
![]()
Interested in getting one? Yes, you can: Join the network
-
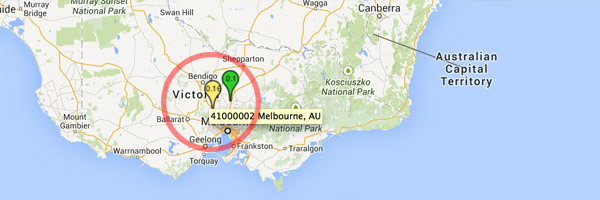
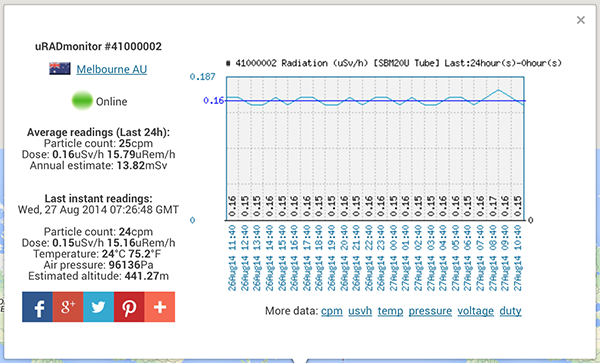
A new unit in Melbourne, Australia
08/26/2014 at 22:23 • 0 comments![14_08_26_unit_41000002_header]()
The second uRADMonitor unit in Australia went online today. This is one of the limited 5 model A2 units announced some time ago. It currently shows an average of 0.10uSv/h :
![unit_41000002_current]()
The readings are higher than those measured during the initial tests in Timisoara:![unit_41000002_initial_tm]()
-
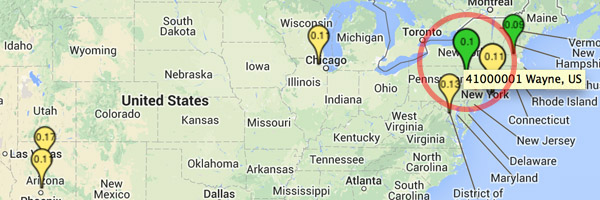
A new uRADMonitor unit in the USA
08/25/2014 at 16:09 • 0 comments![14_08_25_unit_41000001_header]() This new unit is the second in the New York area or the 9th in the entire US. The 41000001 is one of the newer A2 Models with barometric pressure sensor. Taking advantage of the recent server side changes, all the unit’s measurements are available in the new compact web interface.
This new unit is the second in the New York area or the 9th in the entire US. The 41000001 is one of the newer A2 Models with barometric pressure sensor. Taking advantage of the recent server side changes, all the unit’s measurements are available in the new compact web interface.The unit currently shows an average of 0.10uSv/h .
![41000001]()
Previous measurements recorded during the initial tests, indicated similar values, placing the background radiation levels in Timisoara, to the same value like those measured in the current location:![41000001_usvh]()
![41000001_cpm]()
-
Observations on diurnal indoor variations in gamma ray count rates
08/25/2014 at 11:11 • 0 comments![14_08_25_header]()
Richard Prettyman, August 2014
Background
A close correlation between gamma count rate at ground level, and soil derived Rn-222 flux has been demonstrated in work which has also studied the effects of meteorological and diurnal factors on Rn out-gassing and hence gamma count rate (Szegvary et al, 2007). Under conditions of settled weather with no precipitation it has been observed that there is a diurnal cycle in gamma ray count rate with maxima around sunrise presumed due to accumulation of Rn and Rn progeny in near-surface air overnight (Greenfield et al, 2002).
There is little or no description in the scientific literature of whether indoor gamma count rates exhibit the same cyclical variations. The current indoor installation of the uRad Monitor radiation detector #1200000C provided an opportunity to investigate this.Methods
Detector – uRad Monitor (Motisan R, 2014) is a network of GM-based ionising radiation detectors located currently in Europe, North America, Australia, New Zealand and Japan. uRad Monitor #1200000C is a SI29BG-based detector in an aluminium housing which responds predominantly although not exclusively to gamma radiation. Count rate data is recorded and transmitted continuously via built in Ethernet adapter to the server of the uRad Monitor network.
Setting – Detector #1200000C is currently located at my home in Leicestershire, UK (52.60, -1.07; 90m elevation). It is on a table top 0.6m from the floor in a ground floor room that is well ventilated. Flooring is carpet over wooden boards and the void under the floor is in communication with outside air via structural vents.
Data collection, analysis and presentation – Count-rate data were extracted from the server on execution of the following php command on 2014-08-07:
http://uradmonitor.com/data/0.1/export.php?id=1200000C¶m=cpm&start=480&stop=0&integration=1&gmt=Europe/London
Count rate data were returned in the form of a CSV file containing 1-minute resolution data from 2014-07-19 to 2014-08-07. These data were imported into an Excel spreadsheet for further manipulation and analysis.
The raw 1minute data were subjected to two levels of smoothing using a simple moving average (SMA) function with 60 minute and 100 minute periods. The 60 minute SMA was calculated by a function averaging the 30 data points before and 30 points after the index point. The 100 minute SMA was calculated as the average of 50 points either side of the index point. The moving average provides an effect in the time domain that is equivalent to a low pass filter in the frequency domain.
For each of the 1440 minutes in the day, corresponding 1-minute data points were averaged across an 18 day period commencing 2014-07-19. This composite data series was presented as a line graph.
Meteorological data (including temperature, humidity, barometric pressure and rainfall) for the locality of the observations was available from a WH1080-type weather station. The external sensor for this is located 20m away from the nearest building at a height of approximately 3m above the ground.Results
The 18+ day period starting 19th July was dominated by high pressure and settled weather conditions for much of the time at the location of the experiment although weather fronts associated with some rainfall occurred at the beginning and end of the period. Day time temperature maxima were in the range 22-32 deg Celsius (see figures 1-4 below). There was negligible precipitation. GM tube voltage as read out from the device was nominally stable over the 18 day period varying between 380v and 384v.![figure-1]()
![figure-2]()
![figure-3]()
![figure-4]()
Internal temperature read out from the device showed a cyclical variation reflecting the diurnal cycle of indoor ambient temperature at this location.
On visual inspection (see figure 5 below) there was no obviously discernible regular diurnal fluctuation in count rate and no clear longer-term fluctuations that might reflect changing atmospheric conditions such as pressure changes.![figure-5]()
The combined smoothed minute to minute data are presented in figure 6 below. When processed in this way, a modest cyclical variation over the 24 hour period is seen with minimum count rate of 14.45 cpm being seen at c16.00 hrs and maximum of 14.80 cpm at c06.00 hrs.![figure-6]()
Conclusion and comment
* A small magnitude diurnal fluctuation in gamma count rate was observed in the 18-day aggregated data although this was hard to spot day to day in the raw data. This seems broadly in line with published data for outdoor observations.
* An obvious limitation to the interpretation of this data is that the absolute magnitude of the diurnal variation in count rate is small (range approx 0.45 cpm) compared with the standard deviation for the data c 0.3 cpm) so the findings may not be statistically significant.
* Replication of the experiment with a longer period of observation will reduce the dispersion in the data and allow for more confident interpretation.References
* Greenfield, M. B.; Domondon, A. T.; Okamoto, N.; Watanabe, I.
Journal of Applied Physics, Volume 91, Issue 3, pp. 1628-1633, 2002 (abstract accessed ashttp://scitation.aip.org/content/aip/journal/jap/91/3/10.1063/1.1426248)
* Motisan R http://www.uradmonitor.com/ 2014
* Szegvary, T., Leuenberger, M. C., and Conen, F.: Predicting terrestrial 222Rn flux using gamma dose rate as a proxy, Atmos. Chem. Phys., 7, 2789-2795, doi:10.5194/acp-7-2789-2007, 2007 (full text accessed as http://www.atmos-chem- phys.net/7/2789/2007/acp-7-2789-2007.pdf)The article as PDF is available here: observations on diurnal indoor variations in gamma ray count rates v1.1.
Global radiation monitoring network
The uRADMonitor is a plug-and-play, low power, self contained radiation monitoring device, connected to a centralised server component.


 This new unit is the second in the New York area or the 9th in the entire US. The