Radu Motisan
-
Server software improvements
08/24/2014 at 22:50 • 0 comments![14_08_24_header_uradmonitor_server]()
The uRADMonitor project has a complex architecture, involving both hardware and software. The software level also has two separate components, one is the client firmware – the software running on the dosimeter’s microcontroller, and the other is the software running on the server.
The last posts have shown a lot of progress on the hardware side but due to limited time, the software was left behind. Now, important upgrades have been made on the server, and this post will show a few of them.
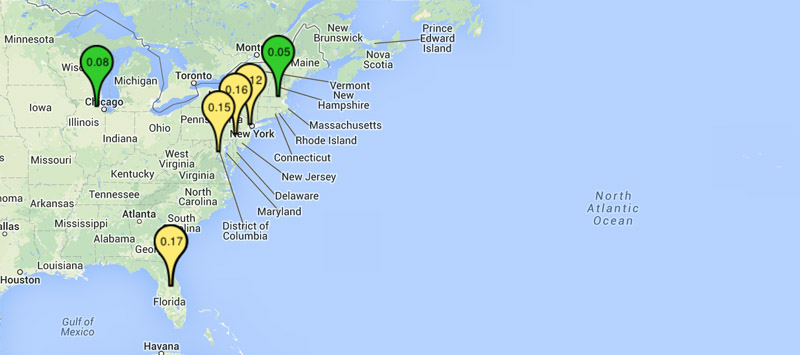
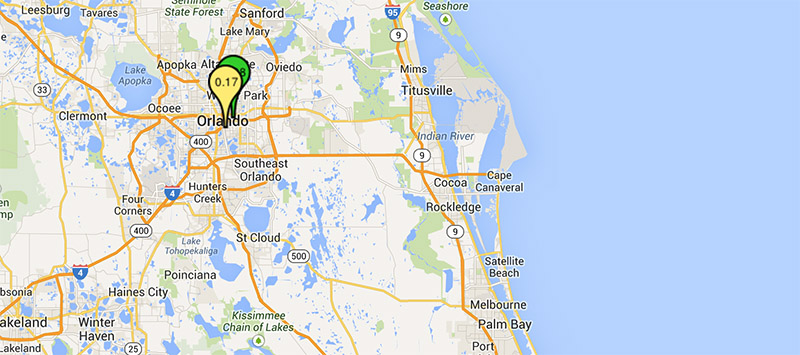
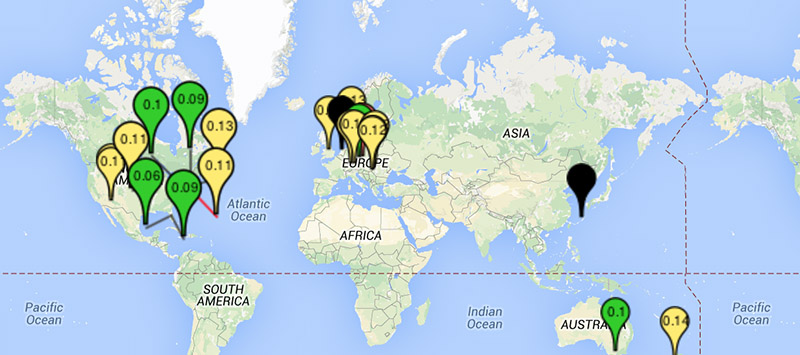
There were a few problems that had to be addressed. For stations running in close proximity, the symbols were overlapping, and the only way of selecting / clicking all of them, was to zoom in enough to see them separately and so be able to click them. Here are the two stations in Florida, running close to each other:
![florida-overlapping-1]()
![florida-overlapping-2]()
Not that easy to select, and certainly not convenient. So the first fix was to find a way to allow the user to select the desired station even when the map is zoomed out. We’ve opted for ‘OverlappingMarkerSpiderfier’, and the results were good. Also the pins have been made smaller, and they get larger when selected in a circle:![spidermap]()
The above photo shows how clicking a group of stations at maximum zoom opens a circular list were we can easily click the unit we are interested in . Hovering the cursor over a map marker (unit pin symbol) will show a label with the unit’s ID and the city where it is located.![unit_label]()
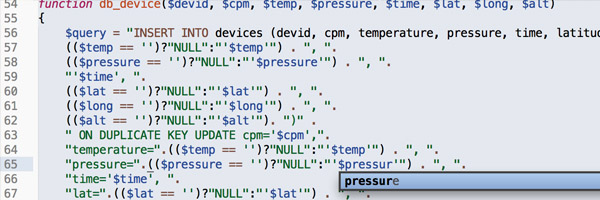
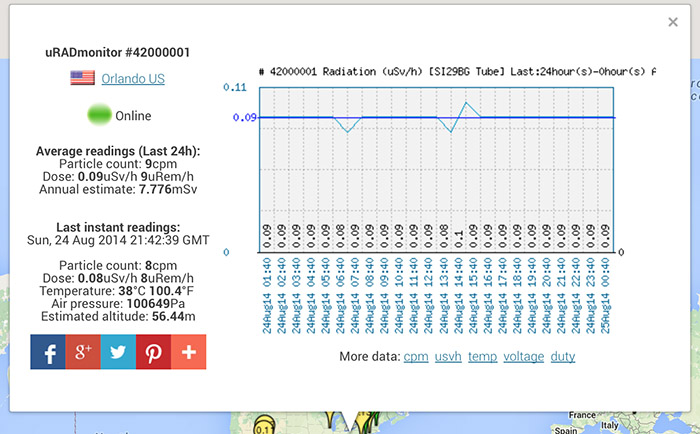
But the difficult part was to improve what happens when the user clicks a map marker – the popup showing detailed unit measurements. The previous version was a little rough, getting out of the screen and requiring additional mouse work to see it properly. The new version packs all relevant data, and brings new features: the right side shows the last 24h chart, while the left shows the city, the country and the flag (new!), clicking the city will open its Wikipedia page (new!).
The radiation chart image is pre-generated every 10 minutes with an automated job on the server, so we no longer get a blank image while waiting for the chart to be generated (it happened before).
The next lines show the average 24h radiation measurements, both as particle counts (CPM) but also the approximation for radiation equivalent dose (in uSv/h and mrem/h). The marker colours on the map are using this averaged value, so no more random colour changes on the map (the previous implementation was using the last instant value, which was fluctuating a lot). The instant measurements are next, featuring radiation data, temperature (now supporting the A2 models), barometric pressure (only for the A2), and estimated altitude based on the barometric pressure of dry air (only for A2).![uradmonitor_detailed_view]()
You can share the data using the social buttons at the bottom. Below the chart image there are also a few additional links that you can use to access more data for radiation, temperature, tube parameters (voltage and inverter duty cycle). -
The second unit in Florida, USA
08/21/2014 at 17:14 • 2 comments![14_08_21_header]()
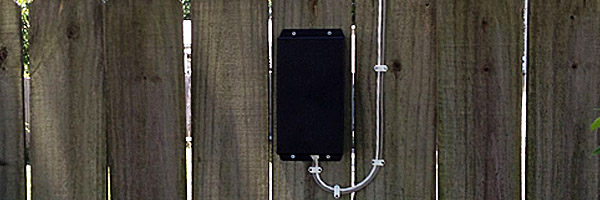
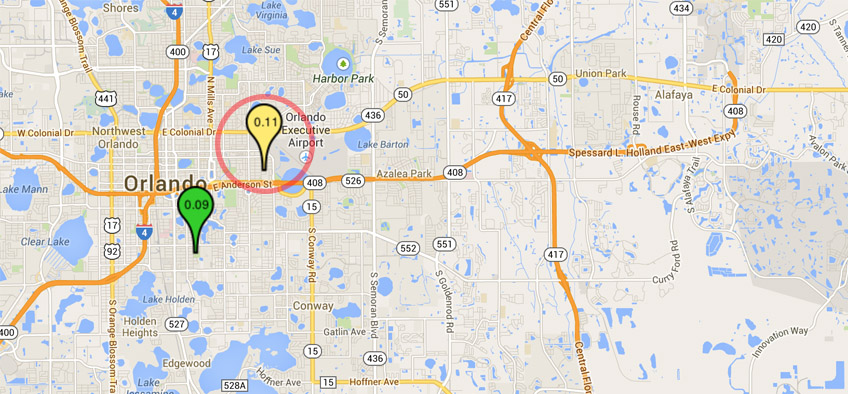
Just a day or two after announcing the first uRADMonitor unit in Orlando, Florida, a new unit went online, 1200000E, not far from the first. The way the unit was mounted looks highly professional, and it gets the best score so far for correctly following the installation instructions.
![1200000E_orlando]()
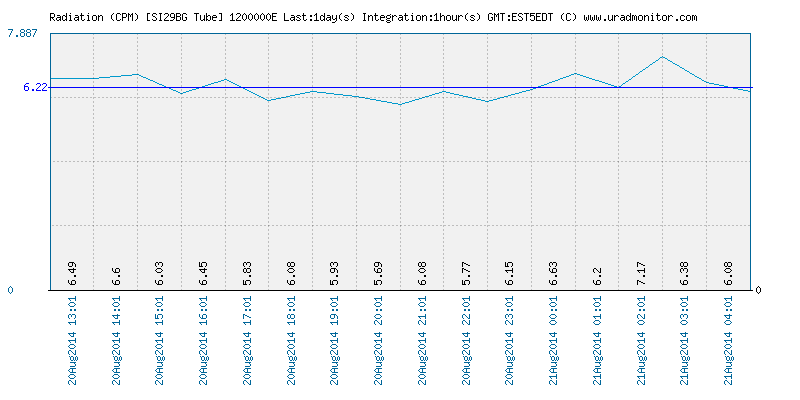
The first measurements indicate very low radiation levels:
![1200000E_cpm]()
![1200000E_usvh]()
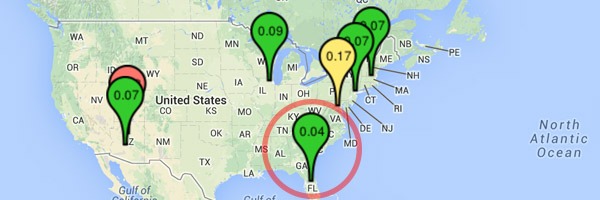
To view the two units in Orlando, zoom in the Global radiation map:
![1200000E_map_orlando]()
You can compare the readings to the initial measurements registered in Timisoara:
![1200000E_initial_cpm]()
-
Producing the uRADMonitor - the aluminium enclosure (2)
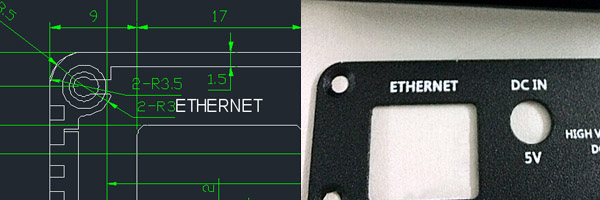
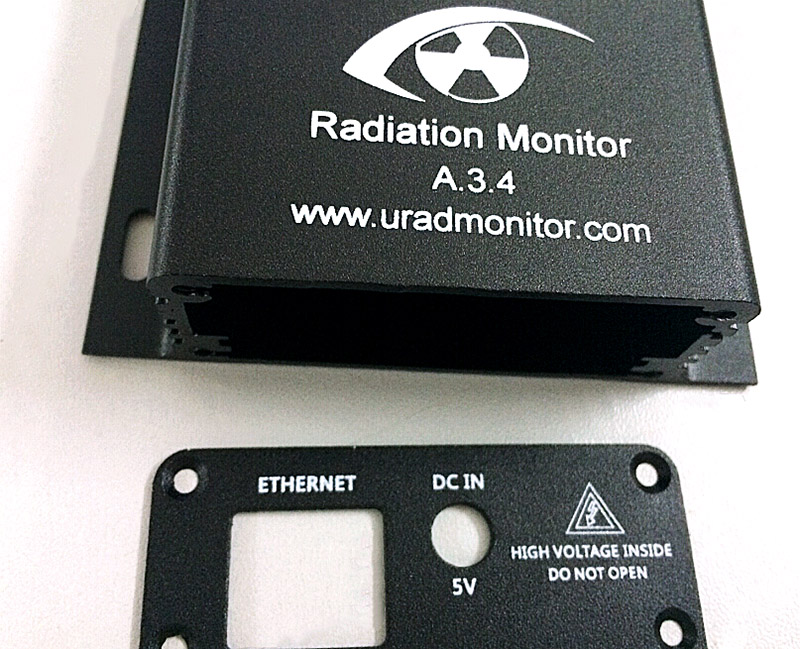
08/21/2014 at 09:14 • 0 comments![14_08_21_aluminium_cases]() One of the previous posts shared some details on the rugged aluminium enclosure production. You can read it here. It was a long road from the drawing board to the production, but the cases are finally ready. Combined with the rubber gaskets, we have a perfect rainproof solution for deploying the uRADMonitor units outdoors:
One of the previous posts shared some details on the rugged aluminium enclosure production. You can read it here. It was a long road from the drawing board to the production, but the cases are finally ready. Combined with the rubber gaskets, we have a perfect rainproof solution for deploying the uRADMonitor units outdoors:![uradmonitor_rugged_enclosure-1]()
![uradmonitor_rugged_enclosure-2]()
More on www.uradmonitor.com
-
uRADMonitor in Florida, USA
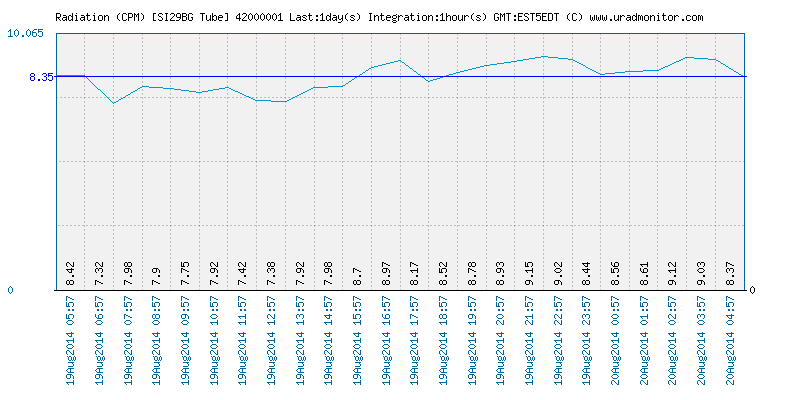
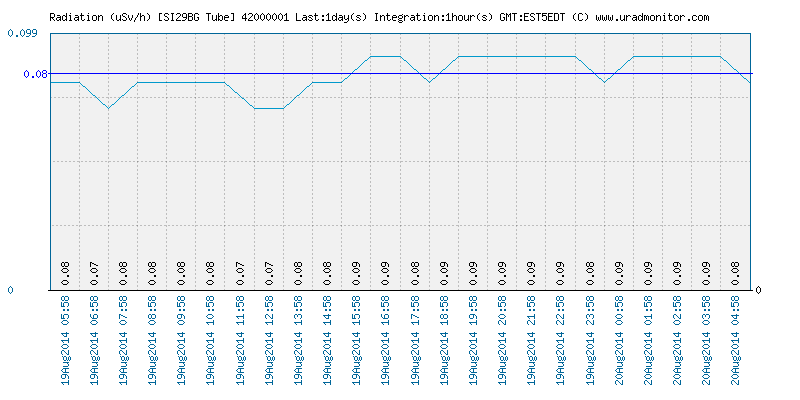
08/20/2014 at 09:07 • 0 comments![14_08_20_header]() The 7th uRADMonitor detector in the US went online recently and is transmitting from Orlando, Florida. This is one of the newer A2 revision units, that were available in limited quantity a few weeks ago.
The 7th uRADMonitor detector in the US went online recently and is transmitting from Orlando, Florida. This is one of the newer A2 revision units, that were available in limited quantity a few weeks ago.Besides radiation and temperature, this unit also monitors the barometric pressure, helping to our understanding on weather impact on background radiation changes. Here are some of the measurements:
![42000001_barometric]()
![42000001_cpm]()
![42000001_usvh]()
Initial radiation measurements in Timisoara:
![42000001_cpm_initial]()
See the real time data online on www.uradmonitor.com
-
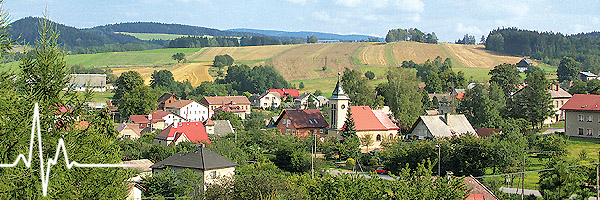
Česká Čermná
08/13/2014 at 17:53 • 0 comments![14_08_13_header]()
Česká Čermná is a village and municipality in Náchod District in the Hradec Králové Region of the Czech Republic. The village is located close to the Polish border. A dedicated website is available where you can find more information on this location.
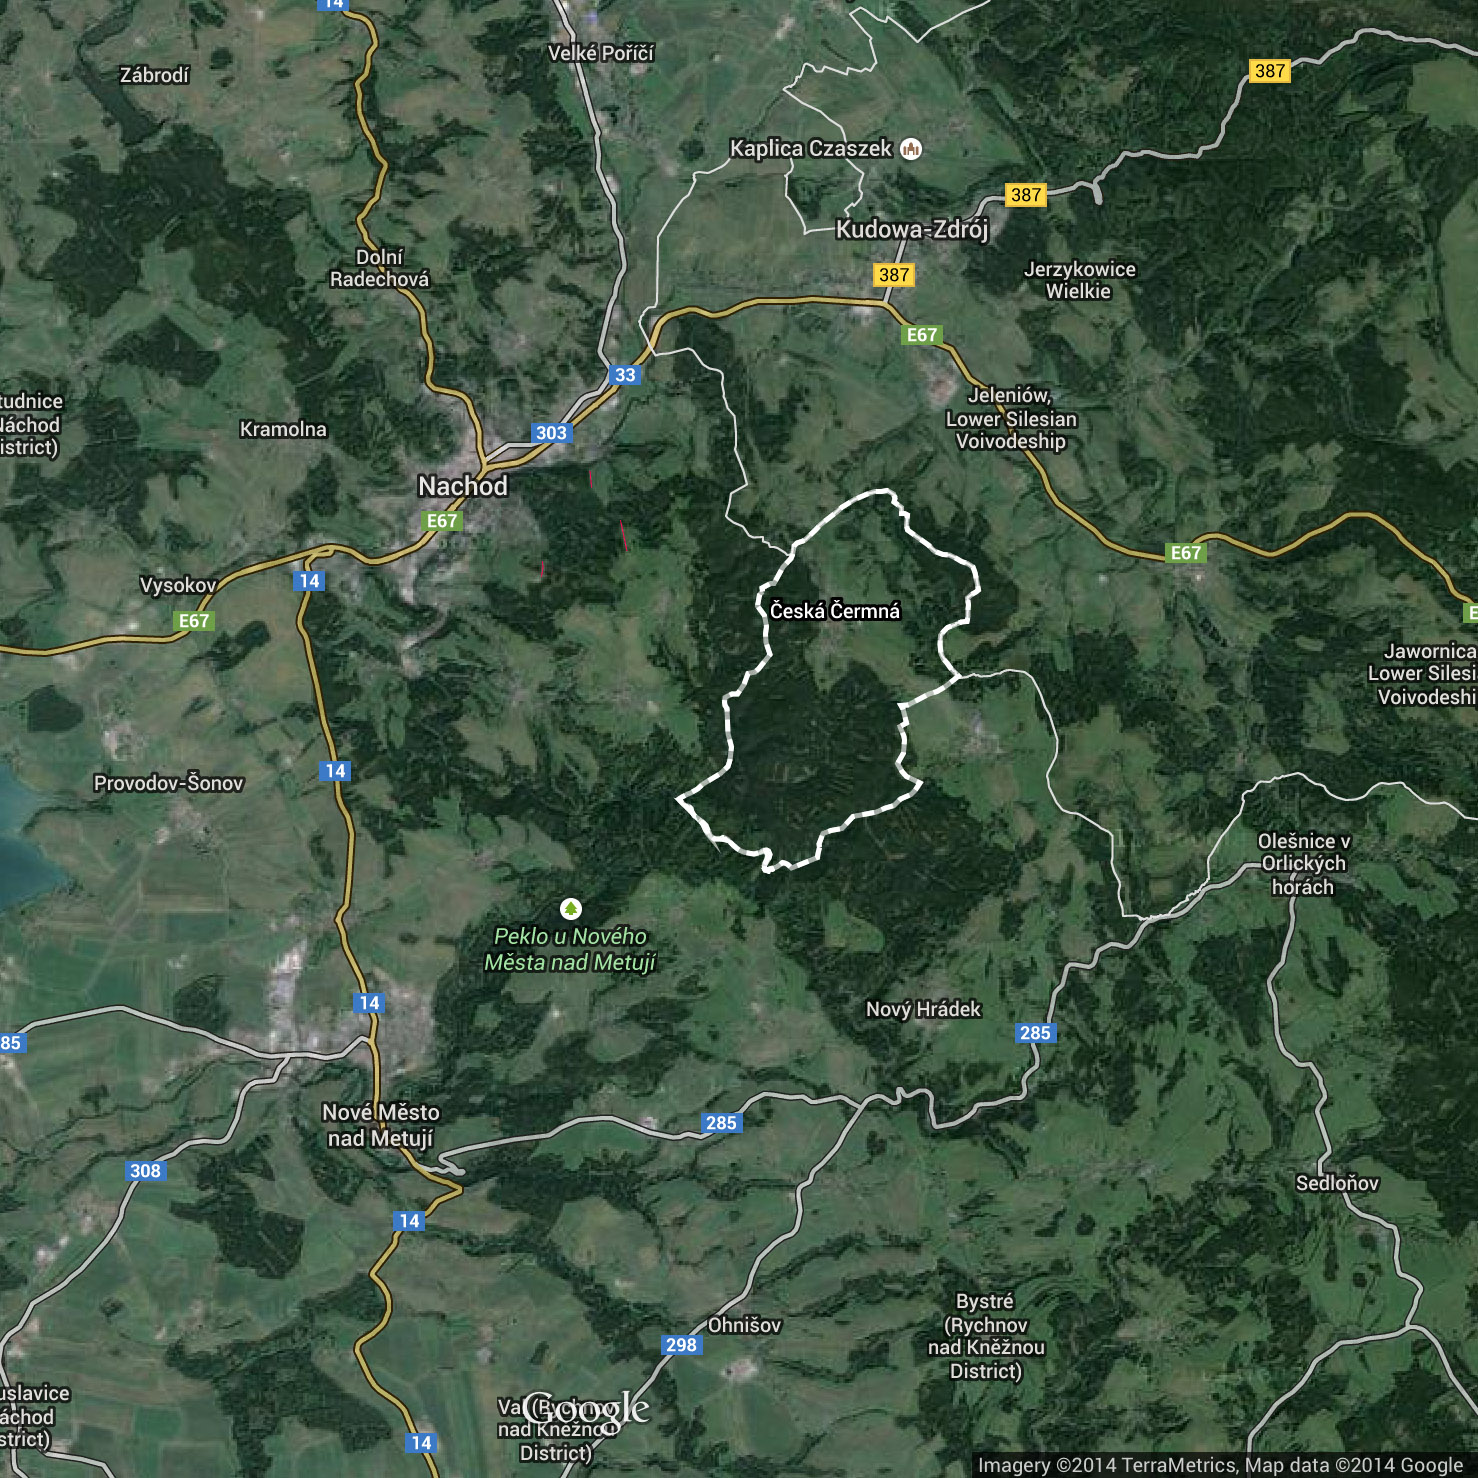
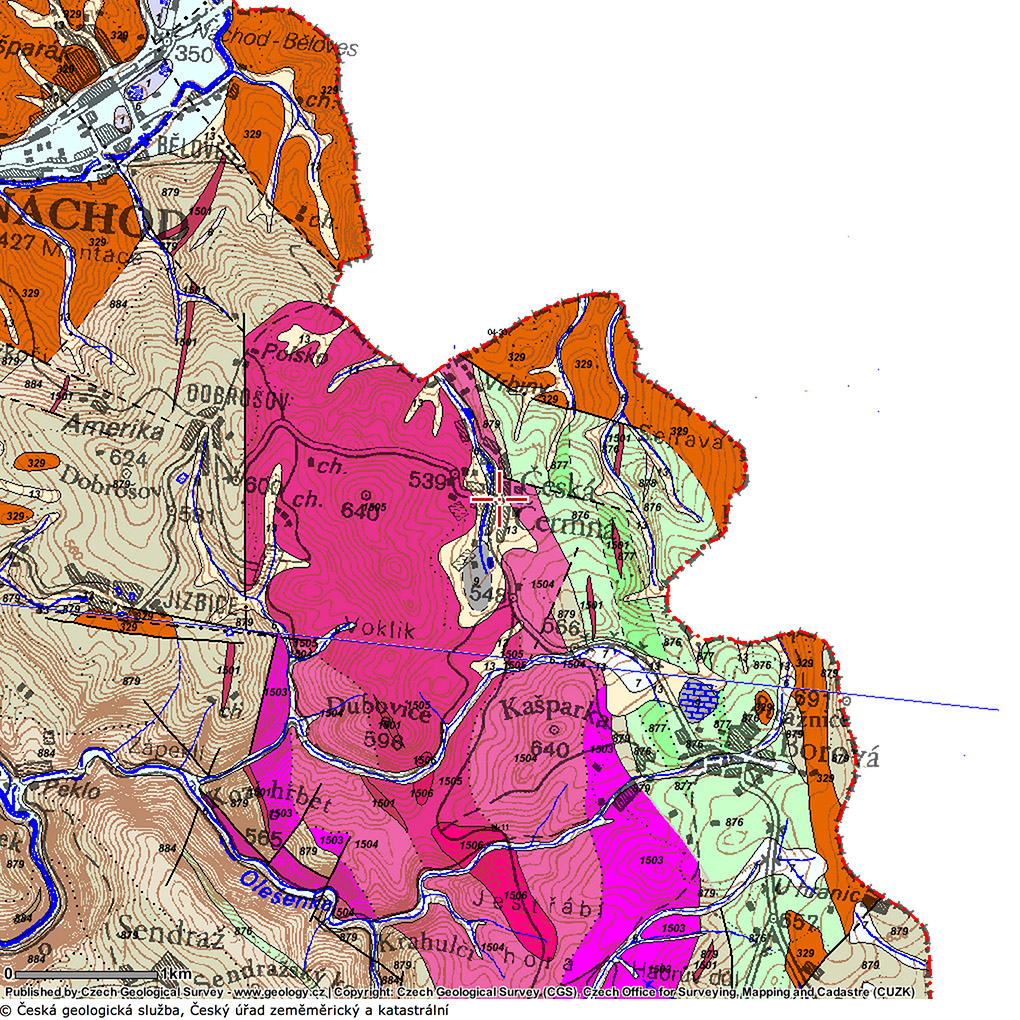
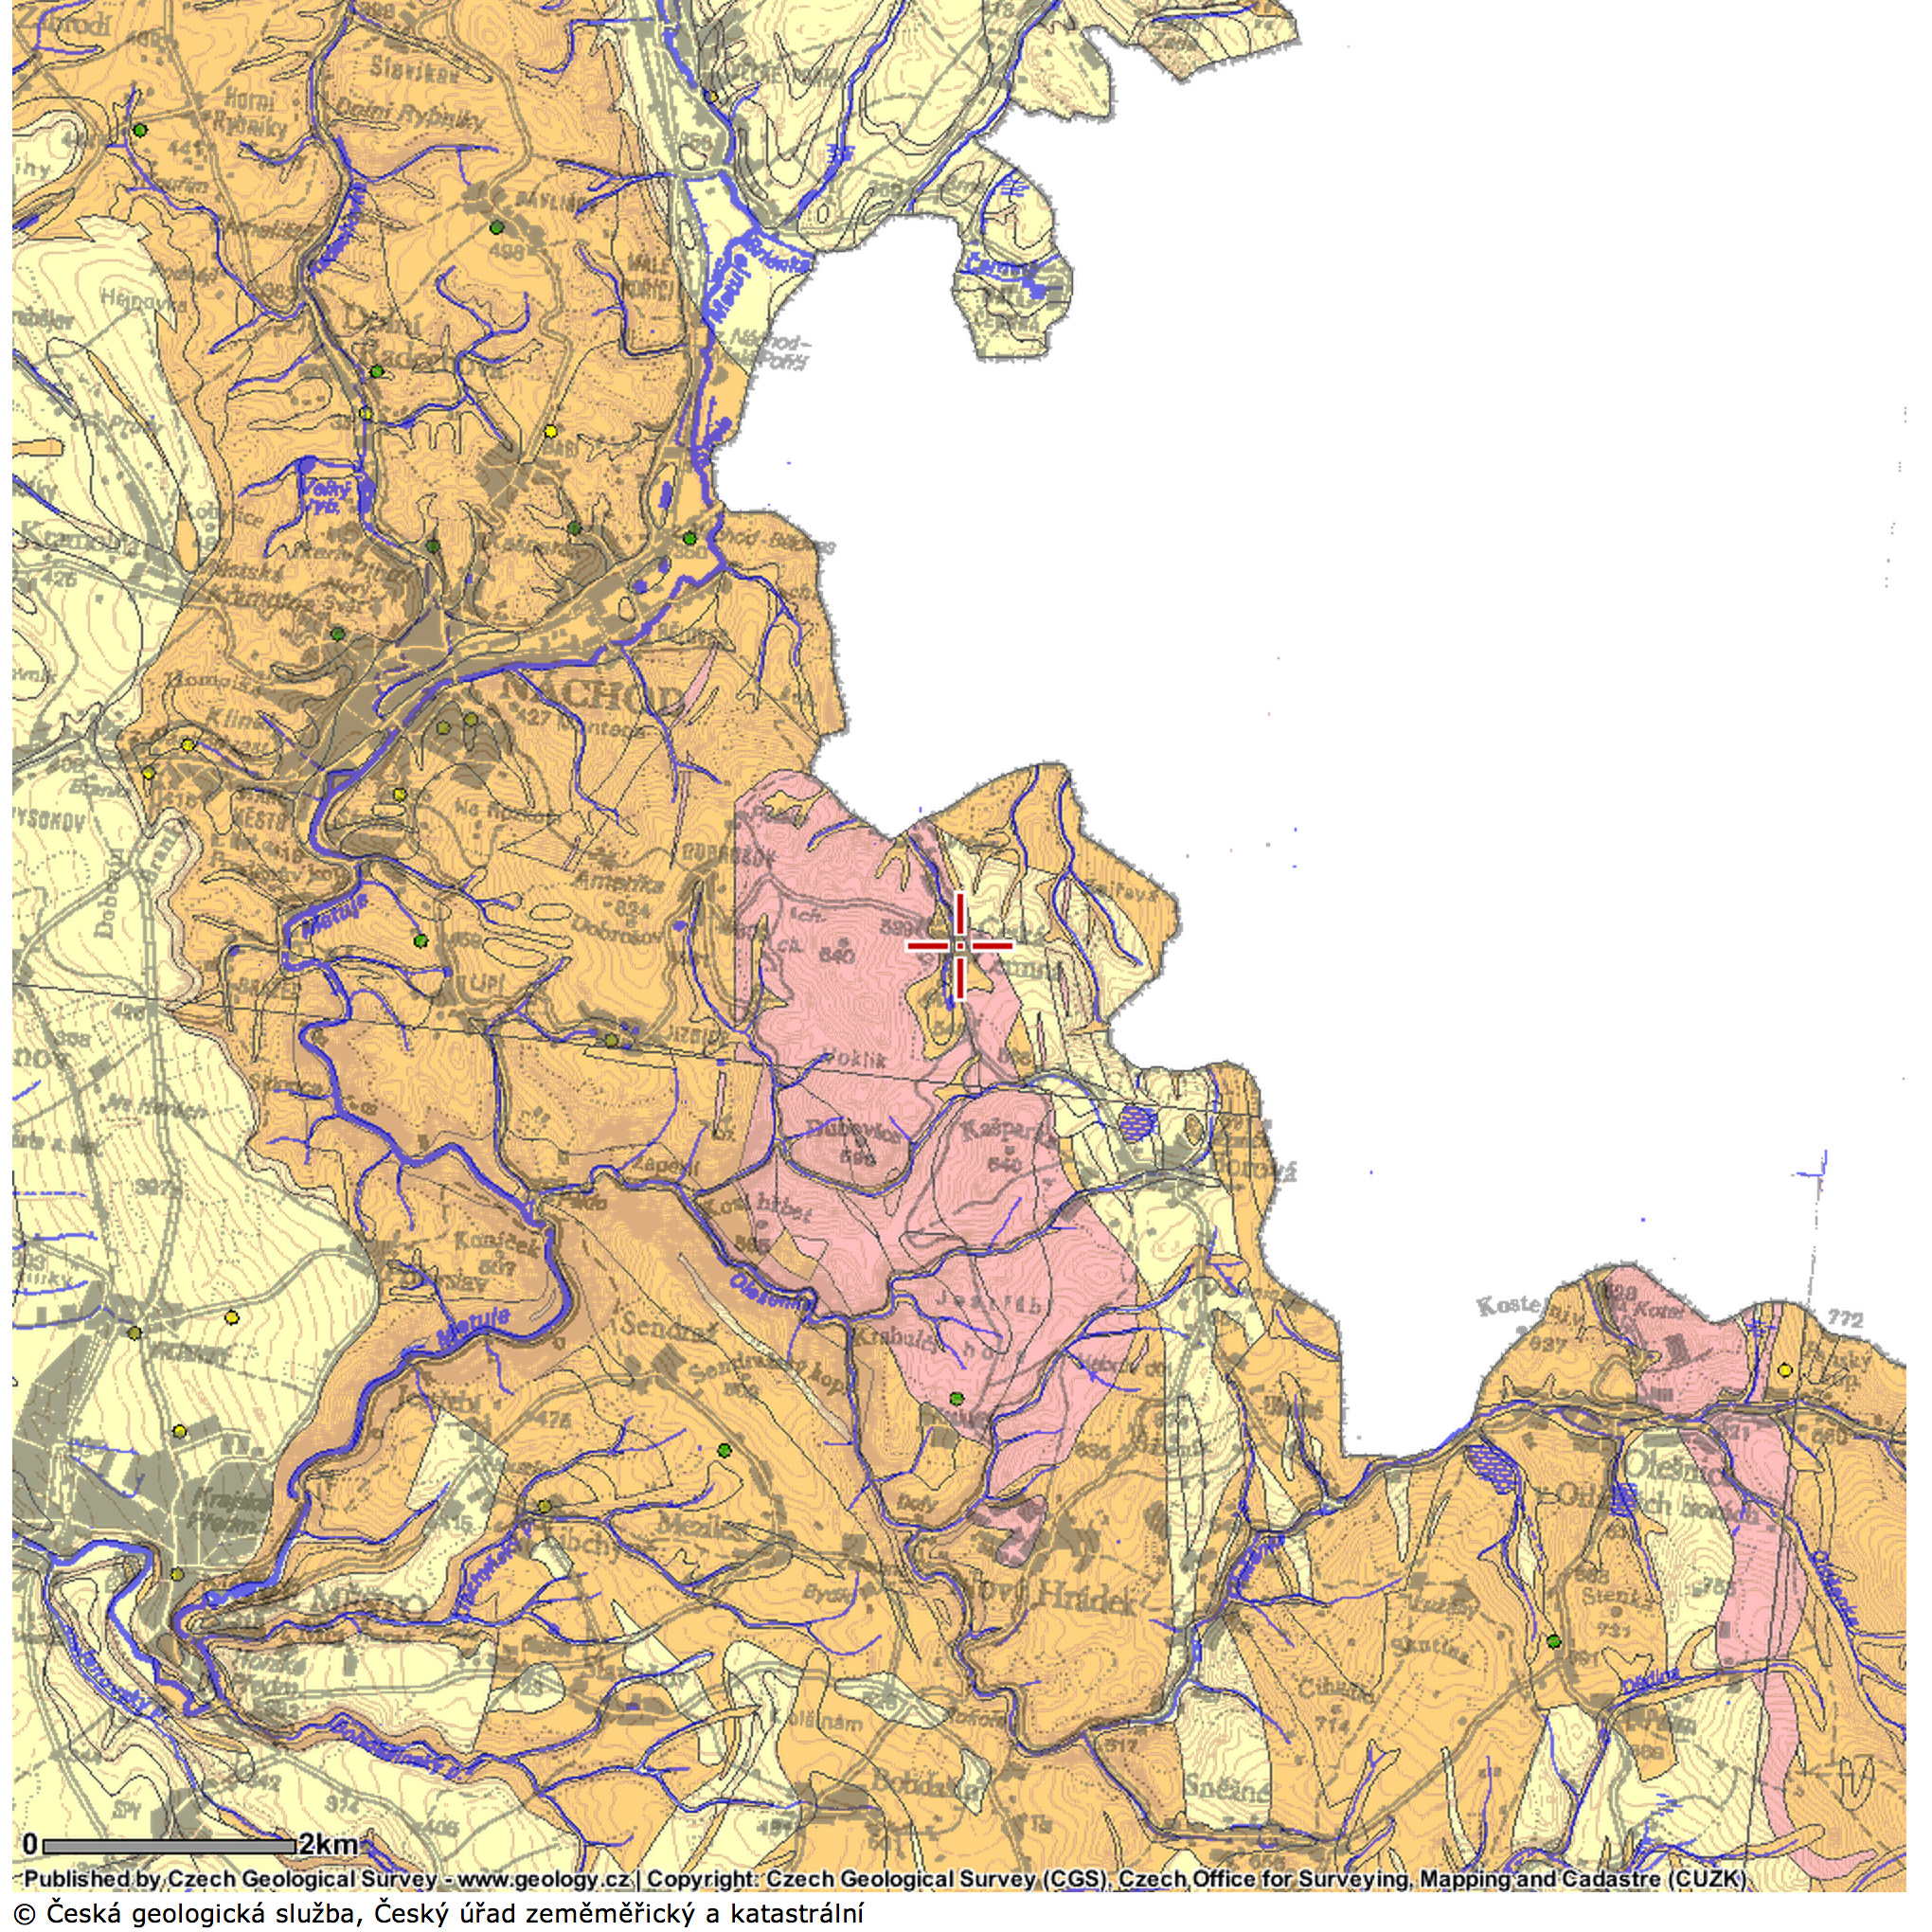
The village location is covered by the excellent Geology.cz website, where we can find some interesting data on the soil and continental crust composition. First, here is a map that will show the some of the rocks contained. The red pointer in the second picture, indicates the location of the Česká Čermná:
![map-3-googlemaps]()
Source![map-1-rock-small]()
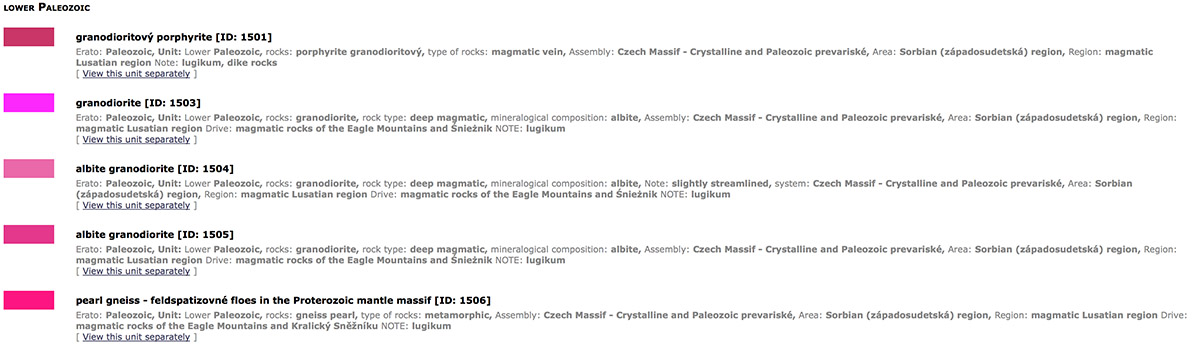
SourceFor the second photo, the legend on the geology website indicates the following composition:
![granodiorite]()
The granodiorite and the albite-granodiorite minerals contain small amounts of Thorium-232 and Uranium-238 . As a result there is a slightly increased natural radioactivity in the area, and a bigger concentration of Radon, as presented here:![map-2-radon]()
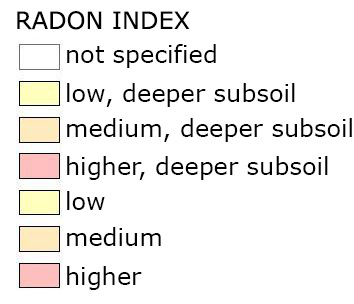
“These maps of radon index (originally known as radon risk maps) roughly indicate the average level of activity (occurrence) of radon in different geological units. The geological bedrock is yet the most important source of radon in buildings. Maps of radon index (radon maps) but have only indicative nature and does not serve for radon or risk to the individual plots or even in specific buildings! These maps were used for example in locating the radon detectors to objects within the radon program.” Source
The Legend shows clarifies the colour map information on radon distribution:![radon map]()
A few Czech sources present some interesting details on Radon:
Natural radioactivity and radon problem
Radioactivity in water and possible remedial measures
How radon enters a house
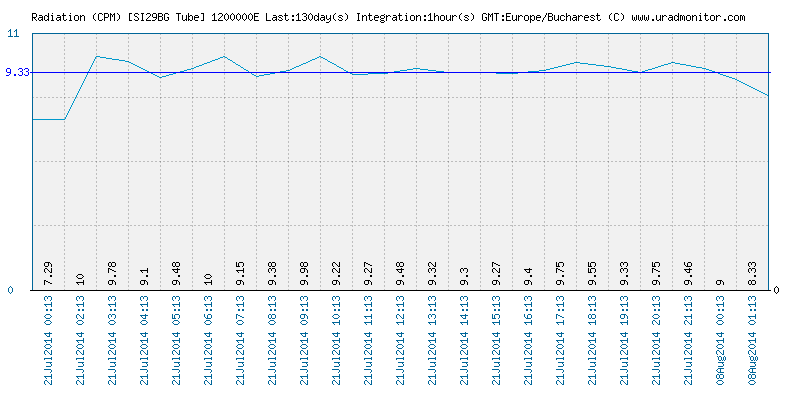
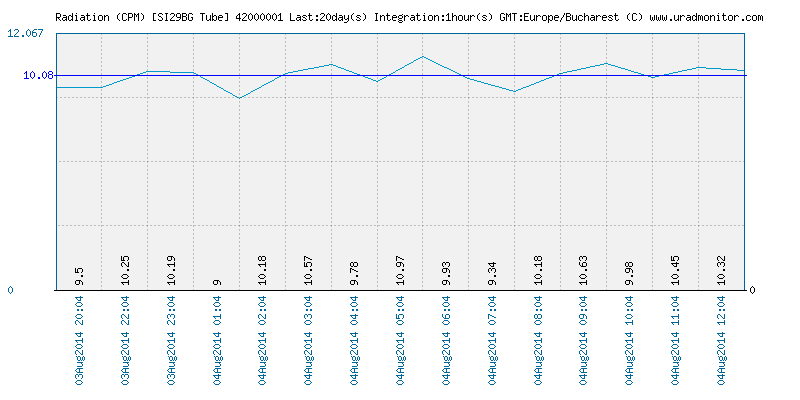
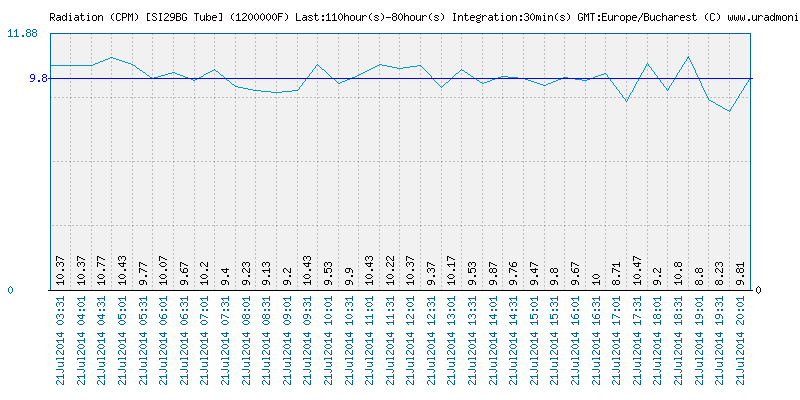
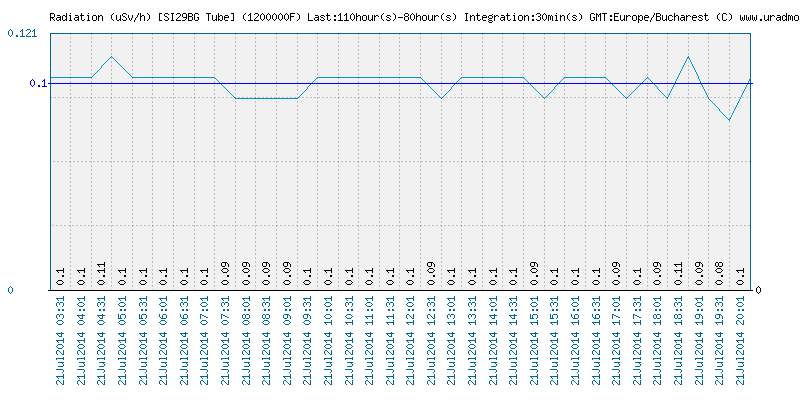
Radon Risk mappingRecently a uRADMonitor unit went online in Česká Čermná, unit 1200000F. The unit measured an average of 9.8CPM in Timisoara Romania, computed over 7hours:
![1200000F-initial-cpm]()
![1200000F-initial-usvh]()
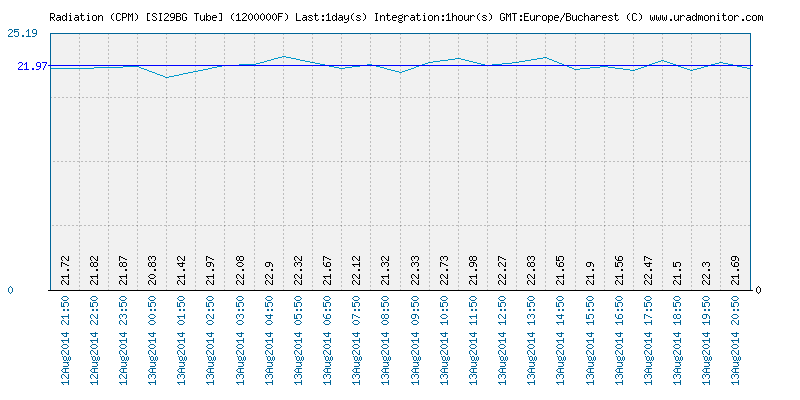
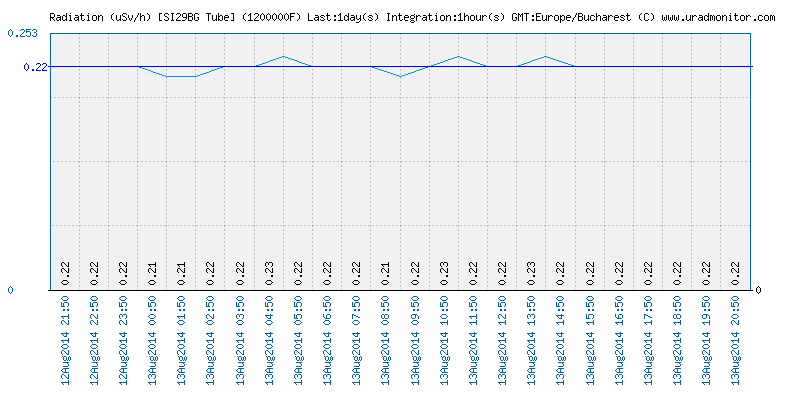
When the unit arrived at it’s destination, the indications raised to almost double, 21.97CPM:![1200000F-final-ceska-cermna-cpm]()
![1200000F-final-ceska-cermna-usvh]()
The readings are the highest amongst all other uRADMonitor units currently available in the network. The data can be viewed here.
-
Producing the uRADMonitor – the circuit boards
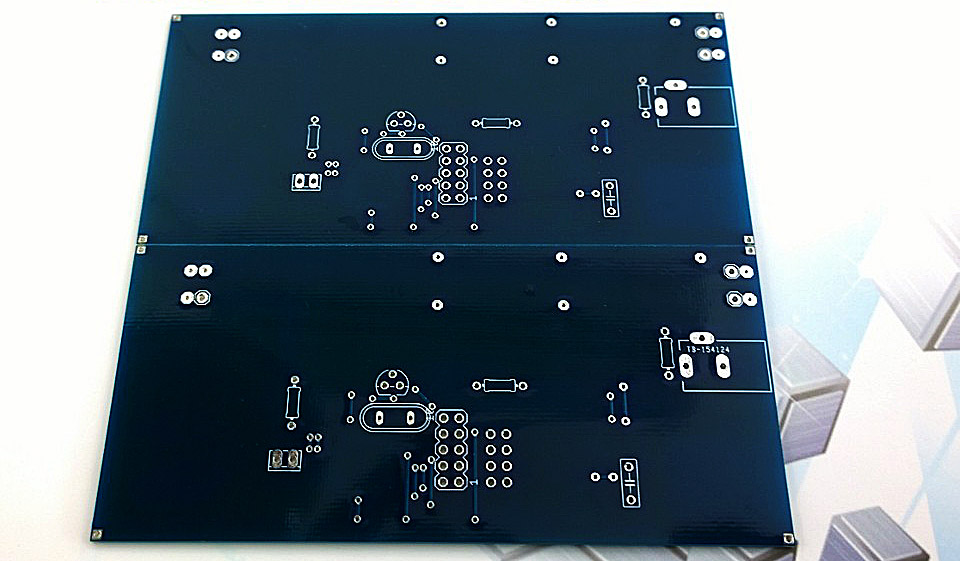
08/12/2014 at 23:10 • 0 commentsA new entry on this ongoing project: the first professional PCBs have been manufactured, pending assembly, including mounting all the critical components. The tubes will be added last, due to their fragile nature.
![uradmonitor-pcb-1]()
A few more details here: Producing the uRADMonitor – the circuit boards
-
The Geiger tubes
08/10/2014 at 11:26 • 0 commentsI just got my hands on a new batch of Geiger tubes, all shiny brand new SBM-20U tubes.
![DSC_4469]()
These will be used for the next set of uRADMonitor dosimeters, in parallel with the SI29BG tubes that were also used. The network is expanding constantly. Most of these tubes will be used with the new PCBs manufactured and assembled in China - I'll post pics soon.
More details here: The Geiger Tubes
-
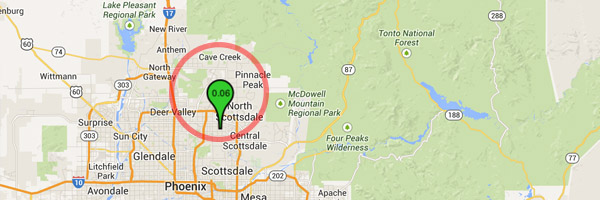
New unit in Phoenix, Arizona
08/09/2014 at 17:25 • 0 comments![14_08_09_header]()
The second uRADMonitor unit in Arizona just went online. Unlike the other unit to the North – that is run at higher altitude and shows increased readings, the new unit measures an average of 11.3CPM (on a SI29BG tube), approximated for the background radiation to a dose of 0.11uSv/h, not unlike what it has seen during the initial tests in Timisoara:
![12000005_cpm]()
![12000005_usvh]()
The data is available online, here.
-
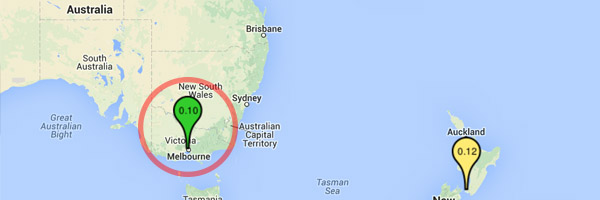
Unit in Australia up and running
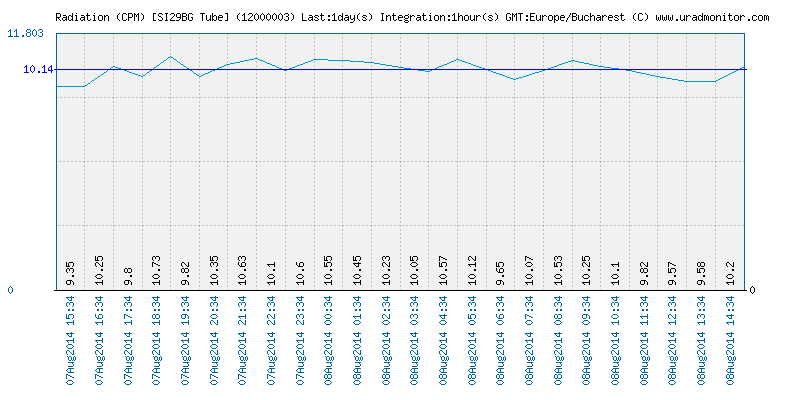
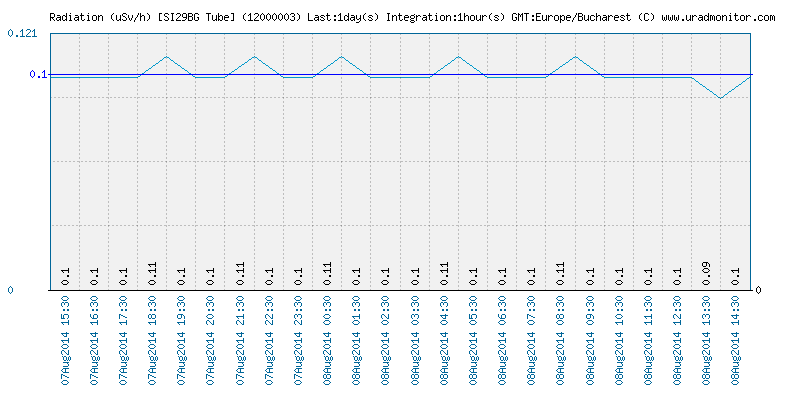
08/08/2014 at 11:51 • 0 comments![14_08_08_header]() The first uRADMonitor unit on the Australian continent went online the last few days. Located in close vicinity to Melbourne, the uRADMonitor unit #12000003 offers continuous background radiation surveillance.
The first uRADMonitor unit on the Australian continent went online the last few days. Located in close vicinity to Melbourne, the uRADMonitor unit #12000003 offers continuous background radiation surveillance.The unit’s current measurements show an average of 10CPM (approximated to 0.10uSv/h):
![12000003_australia_cpm]()
![12000003_australia]()
To get a unit and contribute to the network with data in your location, visit: Join the network
-
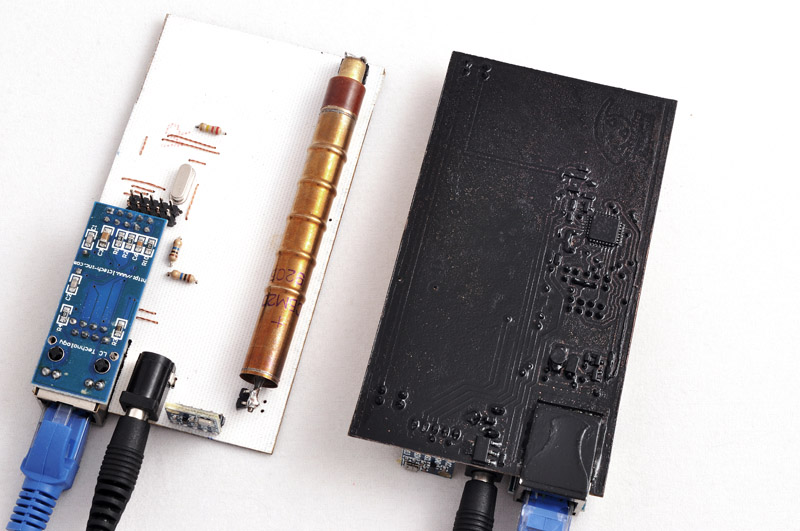
uRADMonitor A2 with Barometric sensor
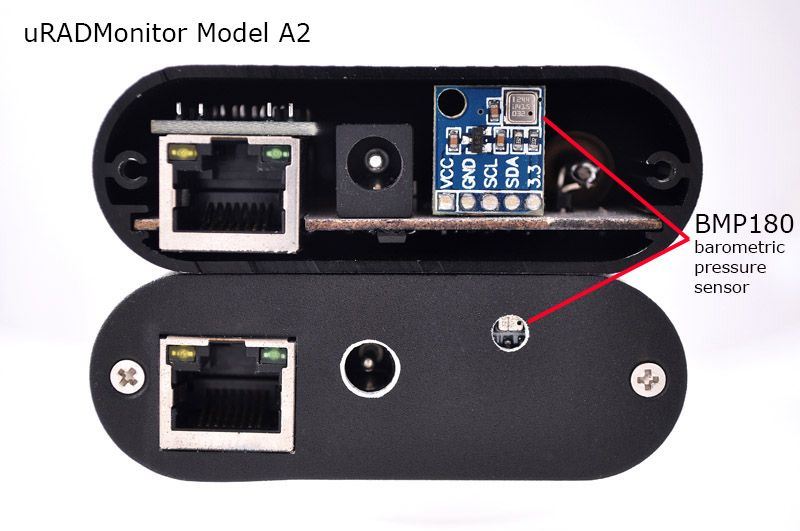
08/05/2014 at 19:03 • 0 commentsHere is a revision of the current Model A uRADMonitor detector. Codenamed the A2, it replaces the internal DS18B20 temperature sensor with the more versatile BMP180. The BMP180 is a low power, high resolution temperature and barometric pressure sensor, manufactured by Bosch. It comes with pre-calibration parameters that are used for accurate measurements.
![uradmonitor_A2_barometric_2-text]()
The aluminium case has an extra hole that exposes the sensor directly to atmospheric conditions, unlike the model A that has the temperature sensor inside. This is a limited series of devices that will probably be distributed to locations where the pressure factor is essential for understanding the changes in background radiation levels. It is possible to also estimate the altitude based on the temperature and pressure readings.![uradmonitor_A2_barometric_3]()
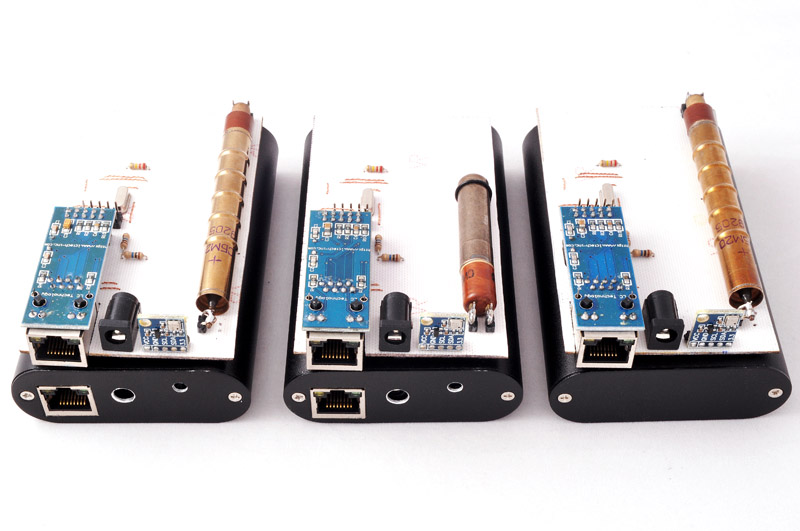
These units are enclosed in the rugged aluminium enclosure as previous Model A units. When mounted outdoors, the connectors and the BMP180 sensor opening should be facing down, to avoid rain getting inside and damaging the sensitive electronics.![uradmonitor_A2_barometric_8]()
There are only a few A2 units available. To get one, click here. More pictures available on the uRADMonitor Facebook page. Share, like, spread the word, to help the network expand!
Global radiation monitoring network
The uRADMonitor is a plug-and-play, low power, self contained radiation monitoring device, connected to a centralised server component.


 One of the previous posts shared some details on the rugged aluminium enclosure production. You can
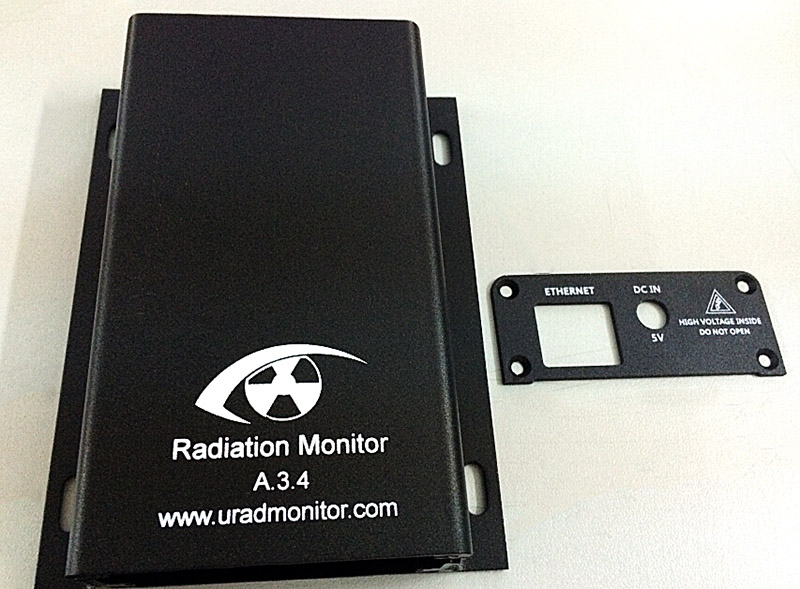
 The 7th uRADMonitor detector in the US went online recently and is transmitting from


 The first uRADMonitor unit on the Australian continent went online the last few days. Located in close vicinity to Melbourne, the uRADMonitor unit