 Nir H
Nir H-
1All of the steps for the project!
Let’s get to it!
Install Arduino IDE, the esp32 board and the Fixed Libraries.
To install the ESP32 board in your Arduino IDE, follow these next instructions:
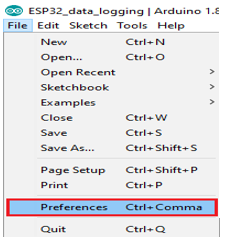
1) Open the preferences window from the Arduino IDE. Go to File> Preferences
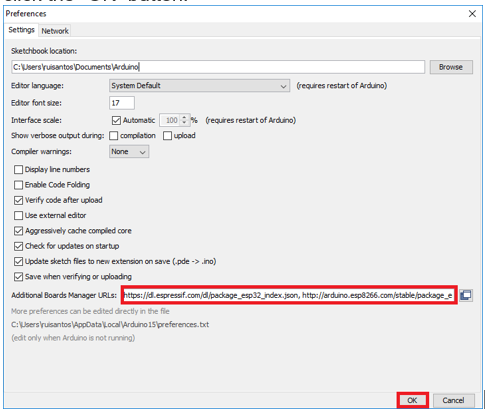
2) Enter https://dl.espressif.com/dl/package_esp32_index.json into the “Additional Board Manager URLs” field as shown in the figure below. Then, click the “OK” button:
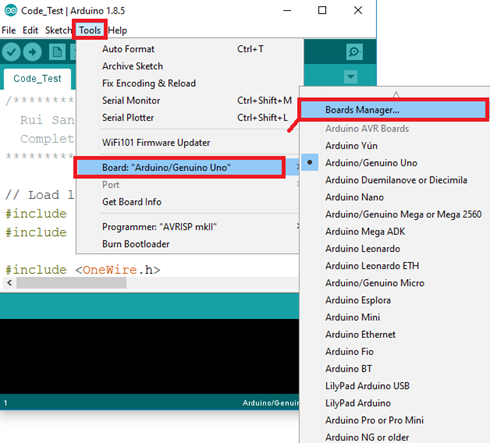
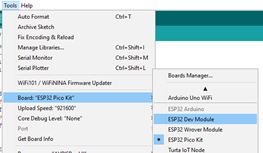
3) Open boards manager. Go to Tools > Board > Boards Manager…
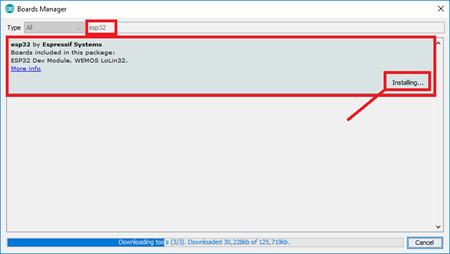
4) Search for ESP32 and press install button for the “ESP32 by Espressif Systems“:
5) That’s it. It should be installed after a few seconds.
Select the esp32 board in the board selection in the Arduino interface.
I’ve downloaded all of the libraries and insert them here, please notice, the sds011 library that I’ve used had an issue getting the sds to sleep, in the githab there’s a whole session about it, I had to modify the sleep function so this code includes the already modified sleep code. Please download "libraries.rar" file.
Copy the libraries to the libraries installation folder – ex.
C:\Program Files (x86)\Arduino\libraries
Components and Connections.
I tried using schematics software, but most of them didn’t have the sds011 and the usb that goes with it so I will write down the connections and will add some pictures. Promise, it will be clear!
Here’s the components list, links to buy and pictures:
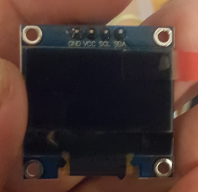
OLED
https://www.aliexpress.com/item/32835854912.html?spm=a2g0s.9042311.0.0.1cf14c4d7dUugj
2 cables Power
https://www.aliexpress.com/item/32893801288.html?spm=a2g0s.9042311.0.0.27424c4db4AmVL
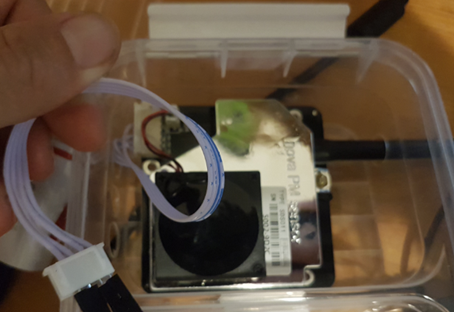
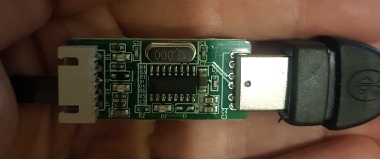
SDS011 with cable and usb
https://www.aliexpress.com/item/32606349048.html?spm=a2g0s.9042311.0.0.27424c4dOHYWhd
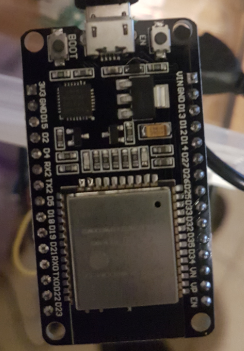
ESP32 (please notice, there might be different versions of esp32 boards, so when pushing code you might need to select the “ESP32 Pico Kit” instead of the Dev kit here:
https://www.aliexpress.com/item/32849567377.html?spm=a2g0s.9042311.0.0.27424c4dvyXTvC
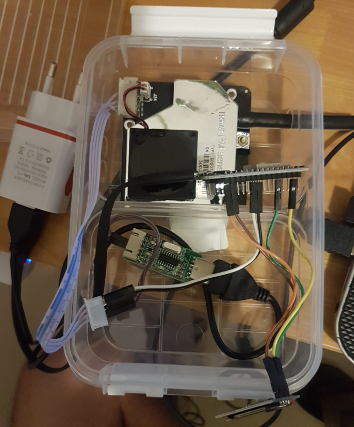
Ok, now that we have all of the necessary parts, we will connected everything as following:
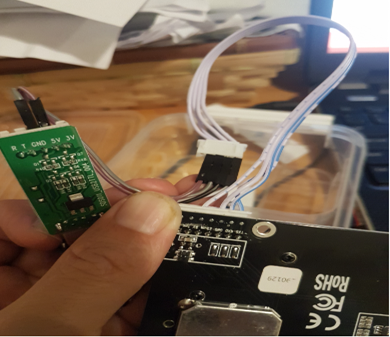
- Connect the cable that came with the sds011 to the sds011.
- Connect the 5v to the v5 on the USB dongle that came with the esp32 and well as the ground.
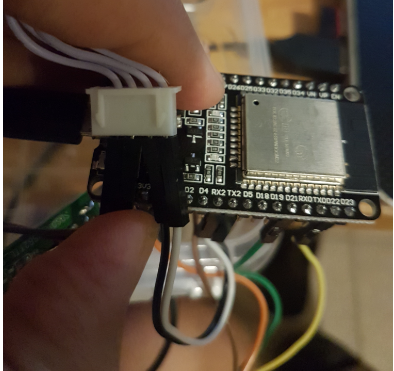
- Connect the RX of the sds011 to the TX2 on the ESP32 and the TX of the sds011 to the RX2 of the ESP32:
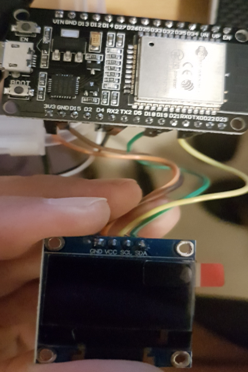
- Connect the OLED 3v(VCC) to the 3v of the ESP32, the GND of the OLED to a GND in the ESP32, the SCL of the OLED goes to D21 of the ESP32 and the SDA of the OLED goes to D22 of the ESP32:
- Connect the Cables to the Power so the whole device should look something like this:
ESP32 Code
Now for the ESP32 Code, Here’s a final version of the code, after a lot of troubleshooting and modifications. I have put it in github and will updated in case we need to change anything.
Here’s the link to github: https://github.com/niriho/ESP32_SDS011/tree/master
I've also attached the code in the project, please download "esp32_sds011.ino"
The code do the following:
- Connect to wireless.
- Gets the time.
- Wake up SDS011
- Get Values from SDS011
- Send the Values to the remote server.
- Get the SDS011 to sleep.
- Wait ~5 minutes and does the loop again…
(Everything is being displayed on the screen of course.)
As you can see from the Code there are a lot of waits between the operations, restart every few runs and in case wifi doesn’t work etc. please go thru the code and notes and let me know if you have any questions/suggestions.
Remote server
OK, now we have our values on the remote server – Let’s look at the remote server components and configurations!
Components
- .Net site: Receiving the file using GET requests.
- Powershell script: Zeroing the files in case of a none working Sensor.
- Cacti: Making Graphs.
Let’s dive in to each Component.
- .Net site
A very simple code that uses .Net 4(I believe), so you will just need to create new site in IIS copy these files from github:
https://github.com/niriho/ESP32_SDS011/blob/master/DataCollectorFiles.rar
or get it here in the project: "DataCollectorFiles.rar"
Now go to \App_Code\WebService.cs and edit the location of the destination files ex.
{
using (StreamWriter writer = new StreamWriter("C:\\inetpub\\wwwroot\\DataCollector\\Files\\" + Filename))
}
The above will write the files to “C:\\inetpub\\wwwroot\\DataCollector\\Files\\”,
PLEASE MAKE SURE IIS USER HAS WRITE PERMISSIONS TO THE DESTINATION FOLDER!
After that a simple get call to your site as following will create a file and the content you want in that file, ex:
http://1.1.1.1:81/WebService.asmx/CreateFile?Filename=FileName.txt&Content=FileContent
This will create a file name “FileName.txt” and the content will be “FileContent”
Please notice I’ve set the port to 81… you can use anything you’d like as long as you set your IIS correctly...
- Powershell script: Zeroing the files in case of a none working Sensor.
In the RAR folder under \Files\Zeroing_Files.ps1 you also have a simple powershell script that when it runs it will go over all of the Sensor*.* files and if they were not modified in the last 15 min will insert a “0” into them as we don’t want strait lines that will confuse us. So in case a sensor is down we will see 0 in the graphs. Please modify the location of your files and the Name of the files in the script ex:
$folder="C:\inetpub\wwwroot\DataCollector\Files\Sensor*"
So if you have a folder ‘d:\MyFolder’ and your files are named ‘AirFiles’, it will look like this:
$folder=" d:\MyFolder\AirFiles*"
- CACTI
- We shall start by installing cacti, as you notice from the above .net, I am using a windows box so we will download the cacti installation for windows, please go here and download the last version:
https://www.cacti.net/downloads/packages/Windows/
Once you have Cacti Installed, follow the instructions and login to your new CACTI.
For getting the actual graphs in place I will be doing explanation and screenshots, as it’s not so intuitive (for some (myself included)).
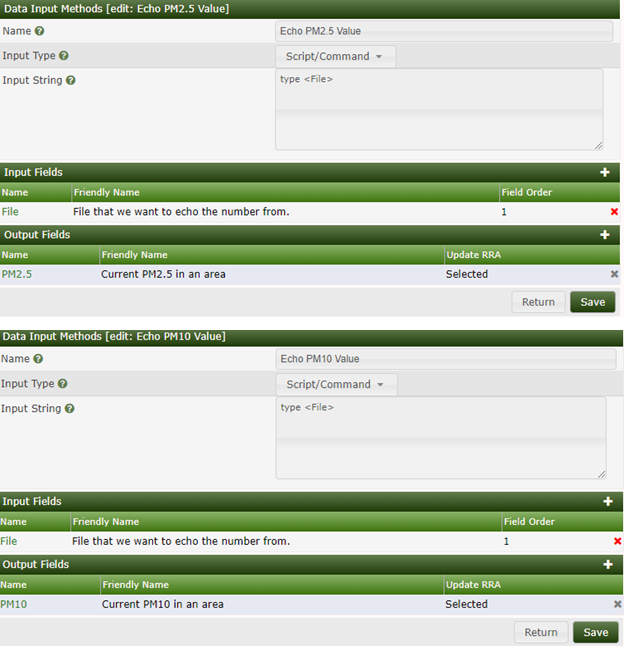
- Create a New Data Input Method
Go to “Data Collection -> Data Input Methods” and click the plus sign and create two of them:” Echo PM2.5 Value” and “Echo PM10 Value” they should look like this:
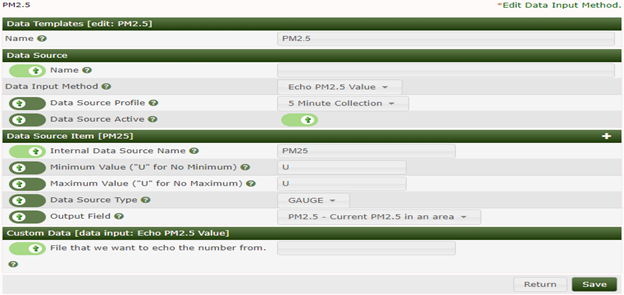
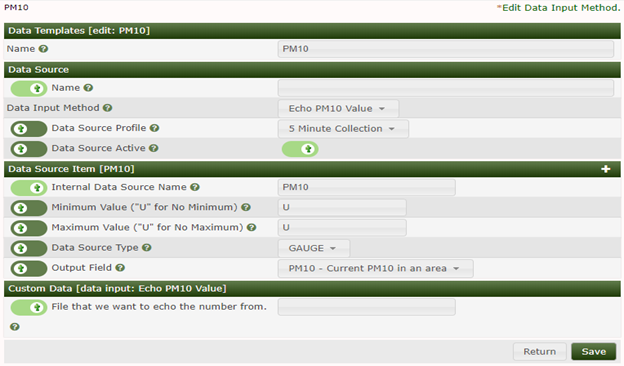
- Now let’s create a new data source, go to Templates->Data Source and click on the plus sign to create a new one, we will create again two of them: “PM10” and “PM2.5”, they should look like this:
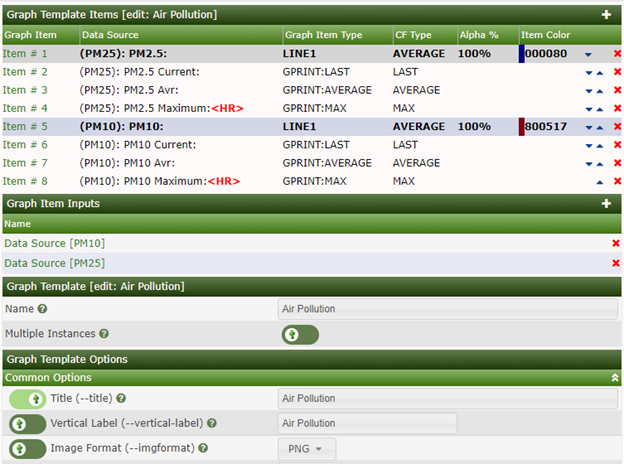
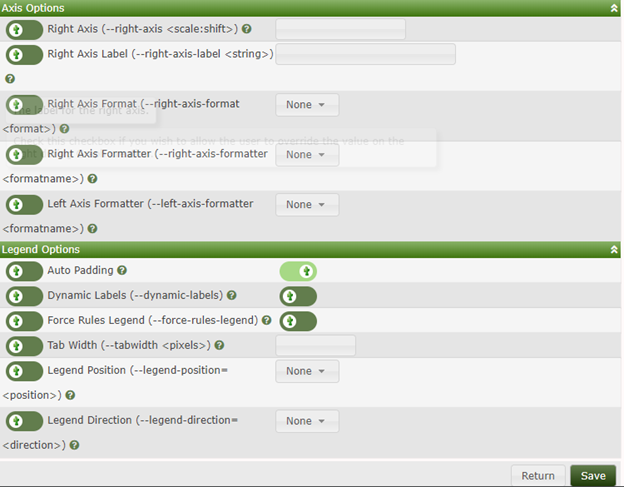
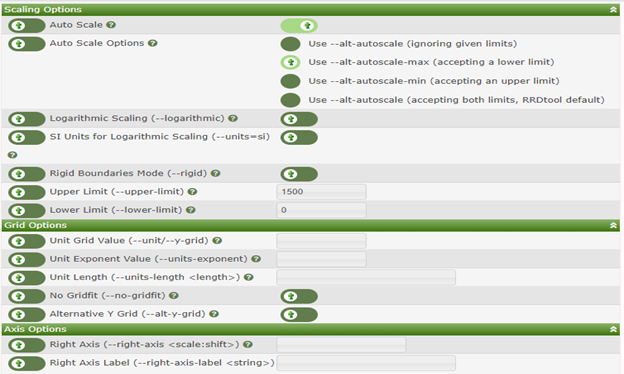
- Let’s create the Graph template, I’ve called it "Air Pollution”, you will be able to call the graphs anything you’d like later on of course. So let’s go to “Templates->Graphs” and click on the plus sign, as usual…we will need to add the Graphs inputs that we created and the graph templates of course. The configuration of the template should look like this:
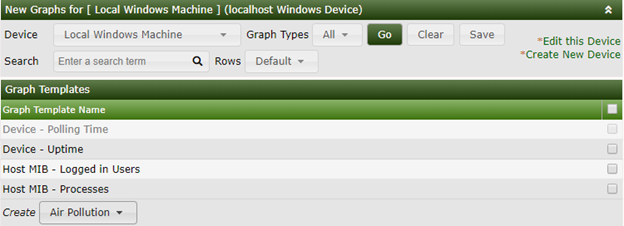
- OK, Now we can finally create the a graph for our device, go to “Create->New Graphs” on the device I usually have my “Local Windows Machine” (as I didn’t add anything else…), I will just use if for all of my graphs…Under the graph templates we will select the “Air Pollution” template and click on “Create”
at the bottom, this is how it should look:
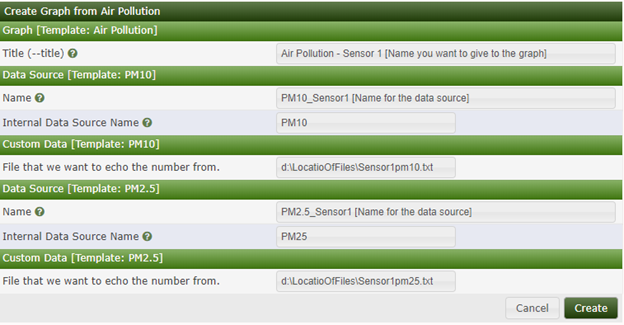
Now we will get to the graph creation…:
Title: name of the graph.
Under “Data Source [Template: PM10]”
Name: *doesn’t really matter but I use something that will ring a bell…
Internal Data Source Name: *Leave as it is.
Custom Data [Template: PM10]: The actual file locatio that has the number for the graph.
Same as the above for “Data Source [Template: PM25]”
Here’s how it should look like:
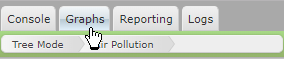
Now, click on Create! Ok we are all set, to view the graph we will just click on the Graph tab:
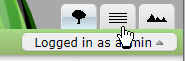
And on the right side we can select the tree view or the List View. Let’s go to the list view:
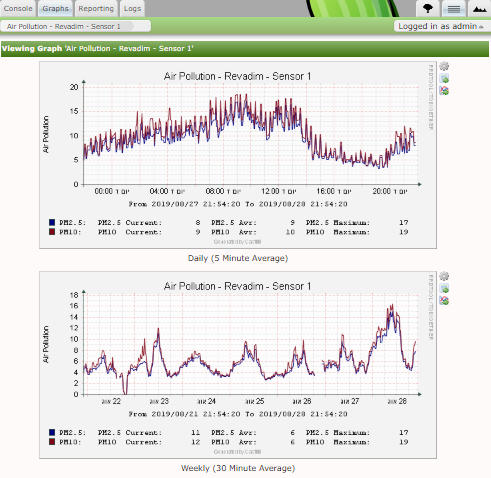
And select our new Graph, now we can view our graph and history:
Please notice,
- It takes cacti a few polls for the graphs to actually start working so please be patient – give it at least 15 minutes!
- There are A LOT of options in Cacti, you are welcome to read thru the documentations and set your own configuration. Such as specific trees view for specific users, and tones more options, Cacti is GREAT!.
If you have any questions, please don’t hesitate to contact me, either here to my email.
Air Pollution Monitoring Project
Monitoring and graphing pm2.5 and pm10 air particles with ESP32, SDS011 and Cacti.

Discussions
Become a Hackaday.io Member
Create an account to leave a comment. Already have an account? Log In.