Close
0%
0%

Gcode Playground

Writing my own Gcode generator for pen plotter

Similar projects worth following
The midTbot pen plotter uses Gcode. You can generate this from vector graphics using one of the extensions in Inkscape, but isn't it fun to generate it yourself? That's what this project's all about.

Having built my own midTbot I was interested in generating my own gcode as a fun way to learn how it works. By far the best I've found is the quick gcode tutorials on cnc cookbook. I played a bit, then wrote a Python script that generates the gcode to draw the Seed of LIfe.
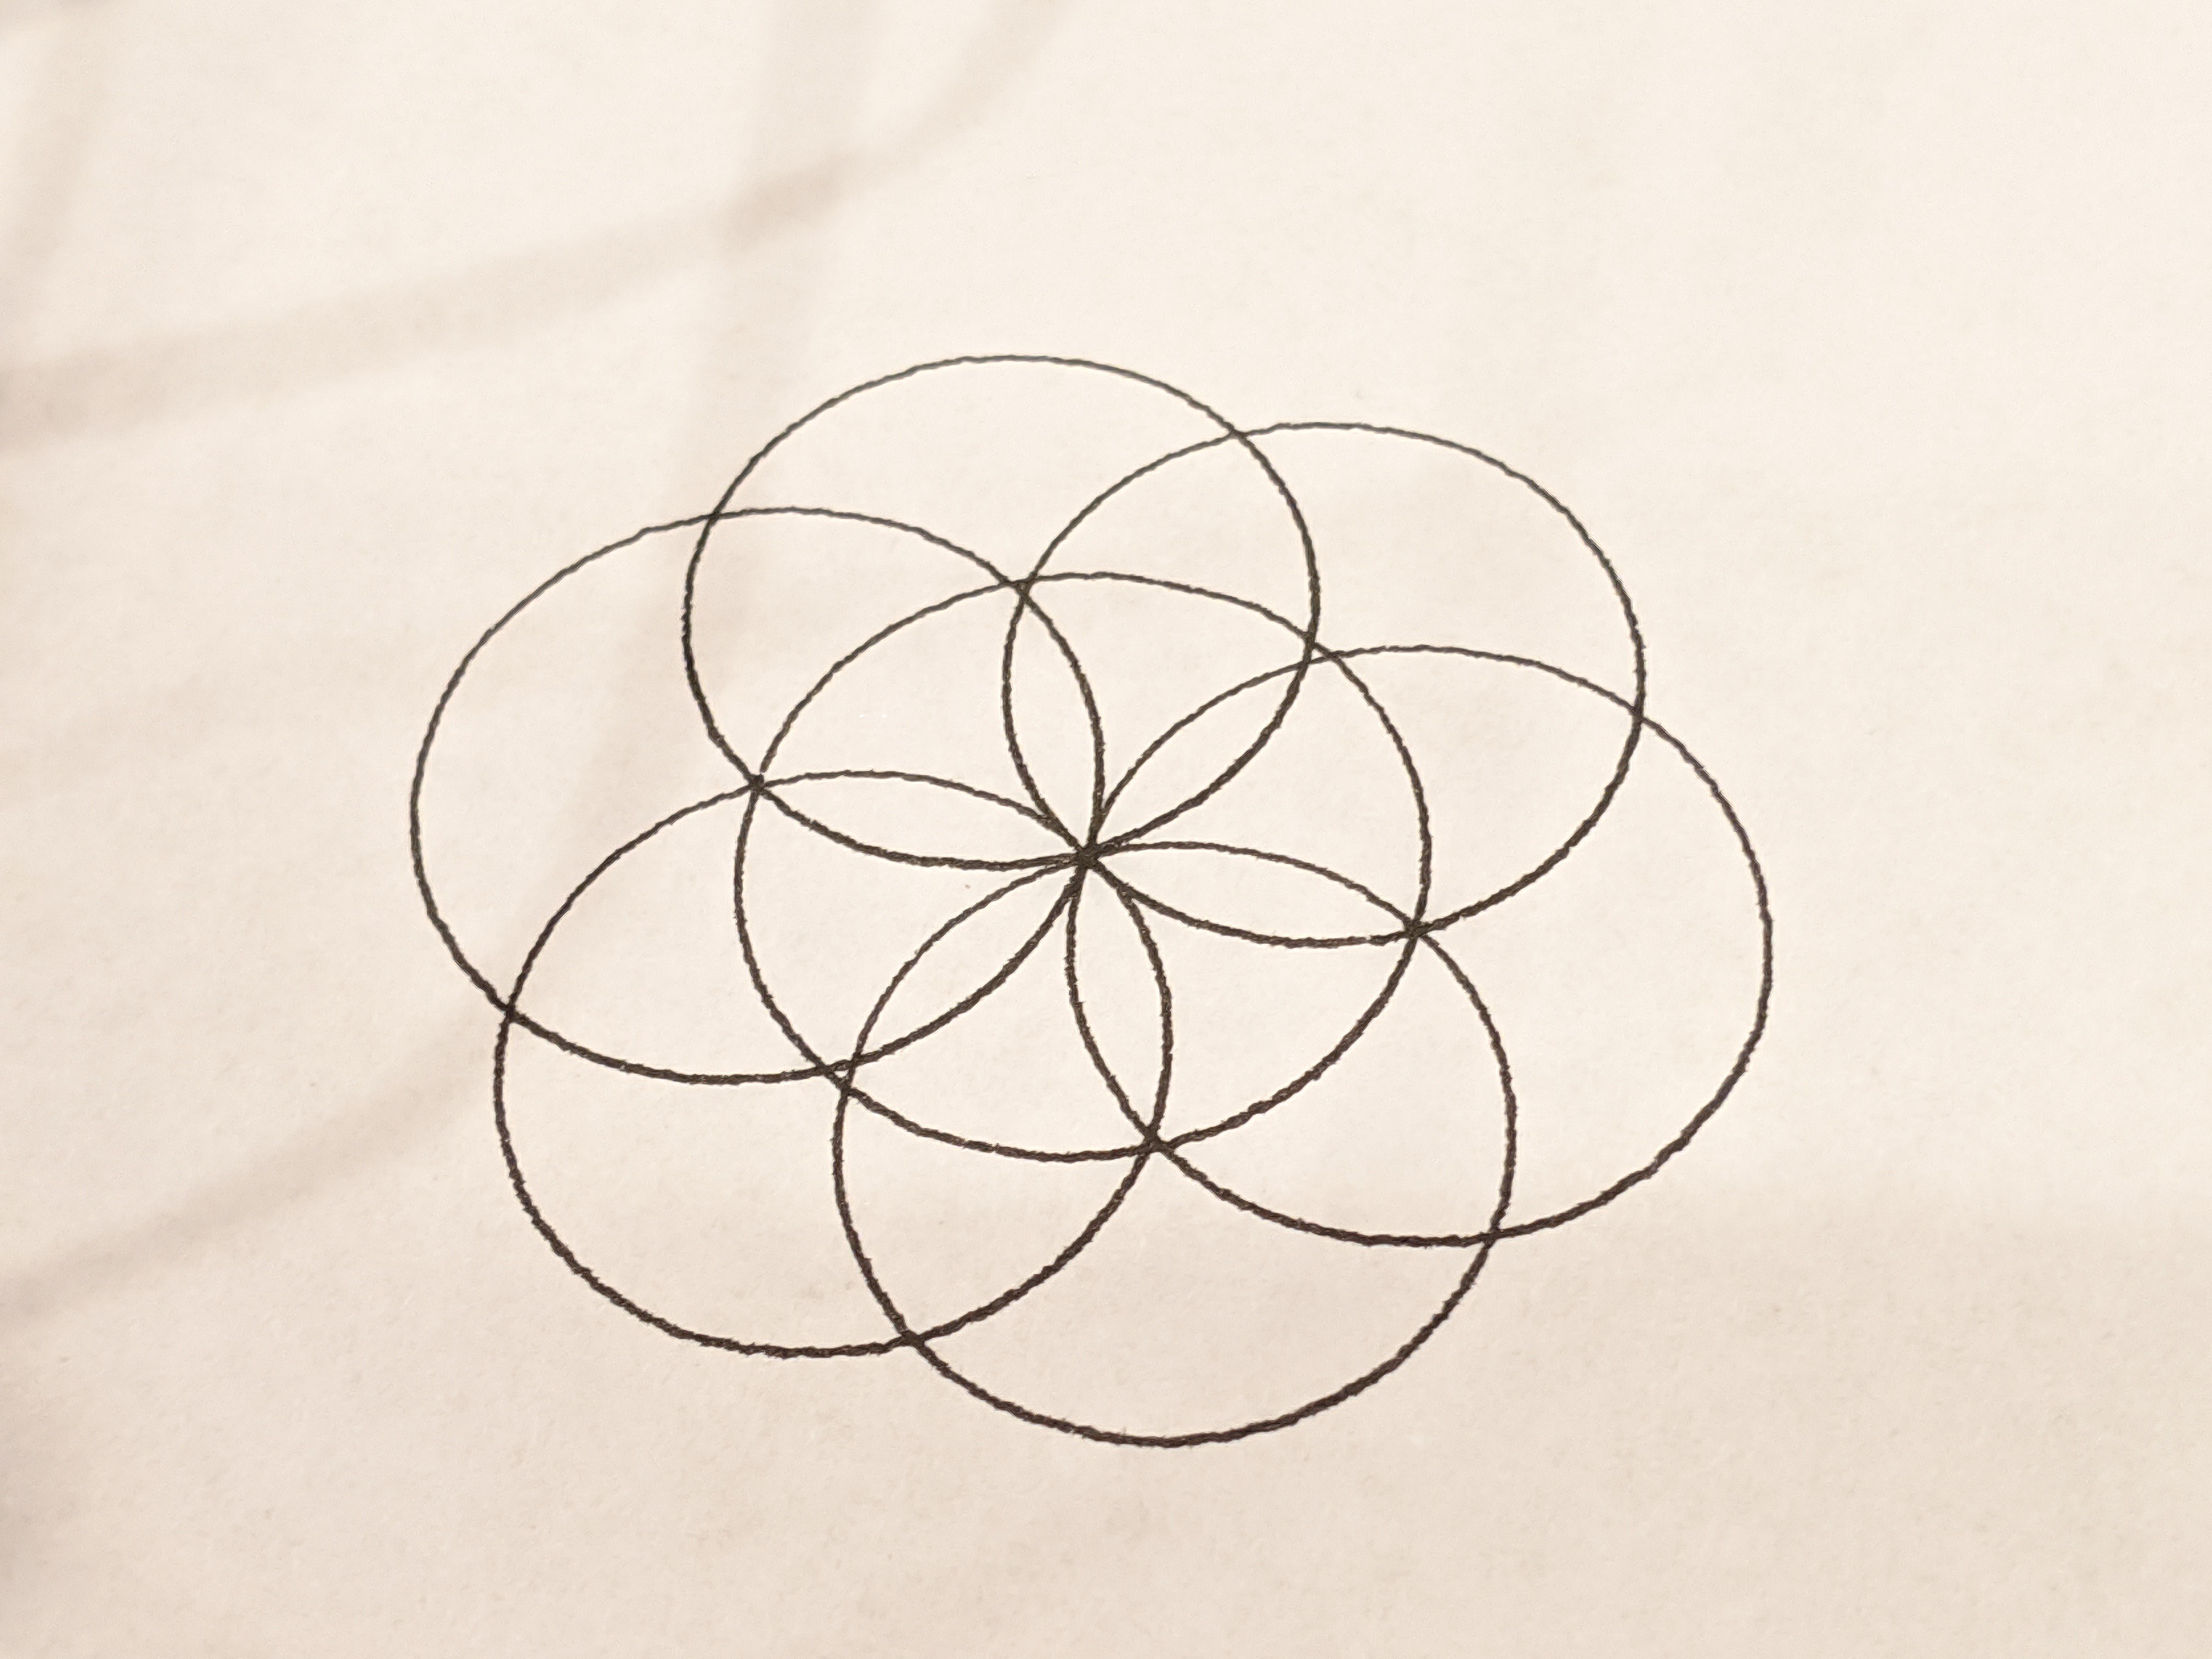
Seed of Life is a pretty good exercise to start with. It uses arcs, and gcode has an arc option based on where the pen is currently located, where the ending point is, and the location of the center of the arc. Seed of Life sets centers defined by a triangle that has the radius as the hypotenus, and 1/2 the radius as the short leg. So calculate the long leg and you have all the info needed for the gocde.

Code is pretty simple:

  • G0Z[0..5] lifts and drops the pen
  • G0X#Y# moves the pen
  • G2X#Y#I#J# draws an ark with:
    • Current pen position as starting point
    • X#Y# as ending point
    • I#J# as pivot point of arc (center of circle) relative to the current pen position.

This is the gcode that drew the image:

G90
G0Z5 F400
G0X70Y90 F4000
G0Z0 F400
G2X70Y90I10J0 F4000

G0Z5 F400
G0X80Y90 F4000
G0Z0 F400
G2X80Y90I10J0 F4000

G0Z5 F400
G0X80Y90 F4000
G0Z0 F400
G2X80Y90I5J8 F4000

G0Z5 F400
G0X80Y90 F4000
G0Z0 F400
G2X80Y90I-5J8 F4000

G0Z5 F400
G0X80Y90 F4000
G0Z0 F400
G2X80Y90I-10J0 F4000

G0Z5 F400
G0X80Y90 F4000
G0Z0 F400
G2X80Y90I-5J-8 F4000

G0Z5 F400
G0X80Y90 F4000
G0Z0 F400
G2X80Y90I5J-8 F4000

G0Z5
G0X0Y0

This is the Python that generated that gcode:

import math

def triangleLongLeg(r):
    #Solve for the long leg of the triangle
    return math.sqrt( (r**2) - ((r/2)**2) )

def circleGcode(penx,peny,centerx,centery):
    print("G0Z5 F%i" % zfeed)
    print("G0X%iY%i F%i" % (penx, peny, xyfeed))
    print("G0Z0 F%i" % zfeed)
    print("G2X%iY%iI%iJ%i F%i" % (penx, peny, centerx, centery, xyfeed))
    print("")

x = 80
y = 90
r = 10

zfeed = 400
xyfeed = 4000

#Calculate Centers:
centers = list()
longleg = triangleLongLeg(r)

centers.append([x,y])
centers.append([r,0])
centers.append([(r/2),longleg])
centers.append([0-(r/2),longleg])
centers.append([0-r,0])
centers.append([0-(r/2),0-longleg])
centers.append([(r/2),0-longleg])

#Generate the gcode
print("G90") #Set absolute mode
points = centers[0]
circleGcode(points[0]-r,points[1],r,0)
for points in centers[1:]:
    circleGcode(centers[0][0],centers[0][1],points[0],points[1])
print("G0Z5")
print("G0X0Y0")

About the Machine

The pen plotter I'm using has a plot area of about 142mm x 142mm. The design is called midTbot by Bart Dring who has well documented everything about the project, and sells driver boards on Tindie.

hilbert.py

x-python - 1.84 kB - 12/20/2019 at 07:26

Download

hilbert.gcode

gcode - 15.30 kB - 12/20/2019 at 07:26

Download

seedoflife_gcode.py

Python file to generate seed of life gcode

x-python - 927.00 bytes - 12/20/2019 at 04:43

Download

seedoflife.gcode

seed of life gcode for running the midTbot

gcode - 409.00 bytes - 12/20/2019 at 04:43

Download

  • Zigzag algorithm notes

    Mike Szczys05/04/2020 at 18:15 0 comments

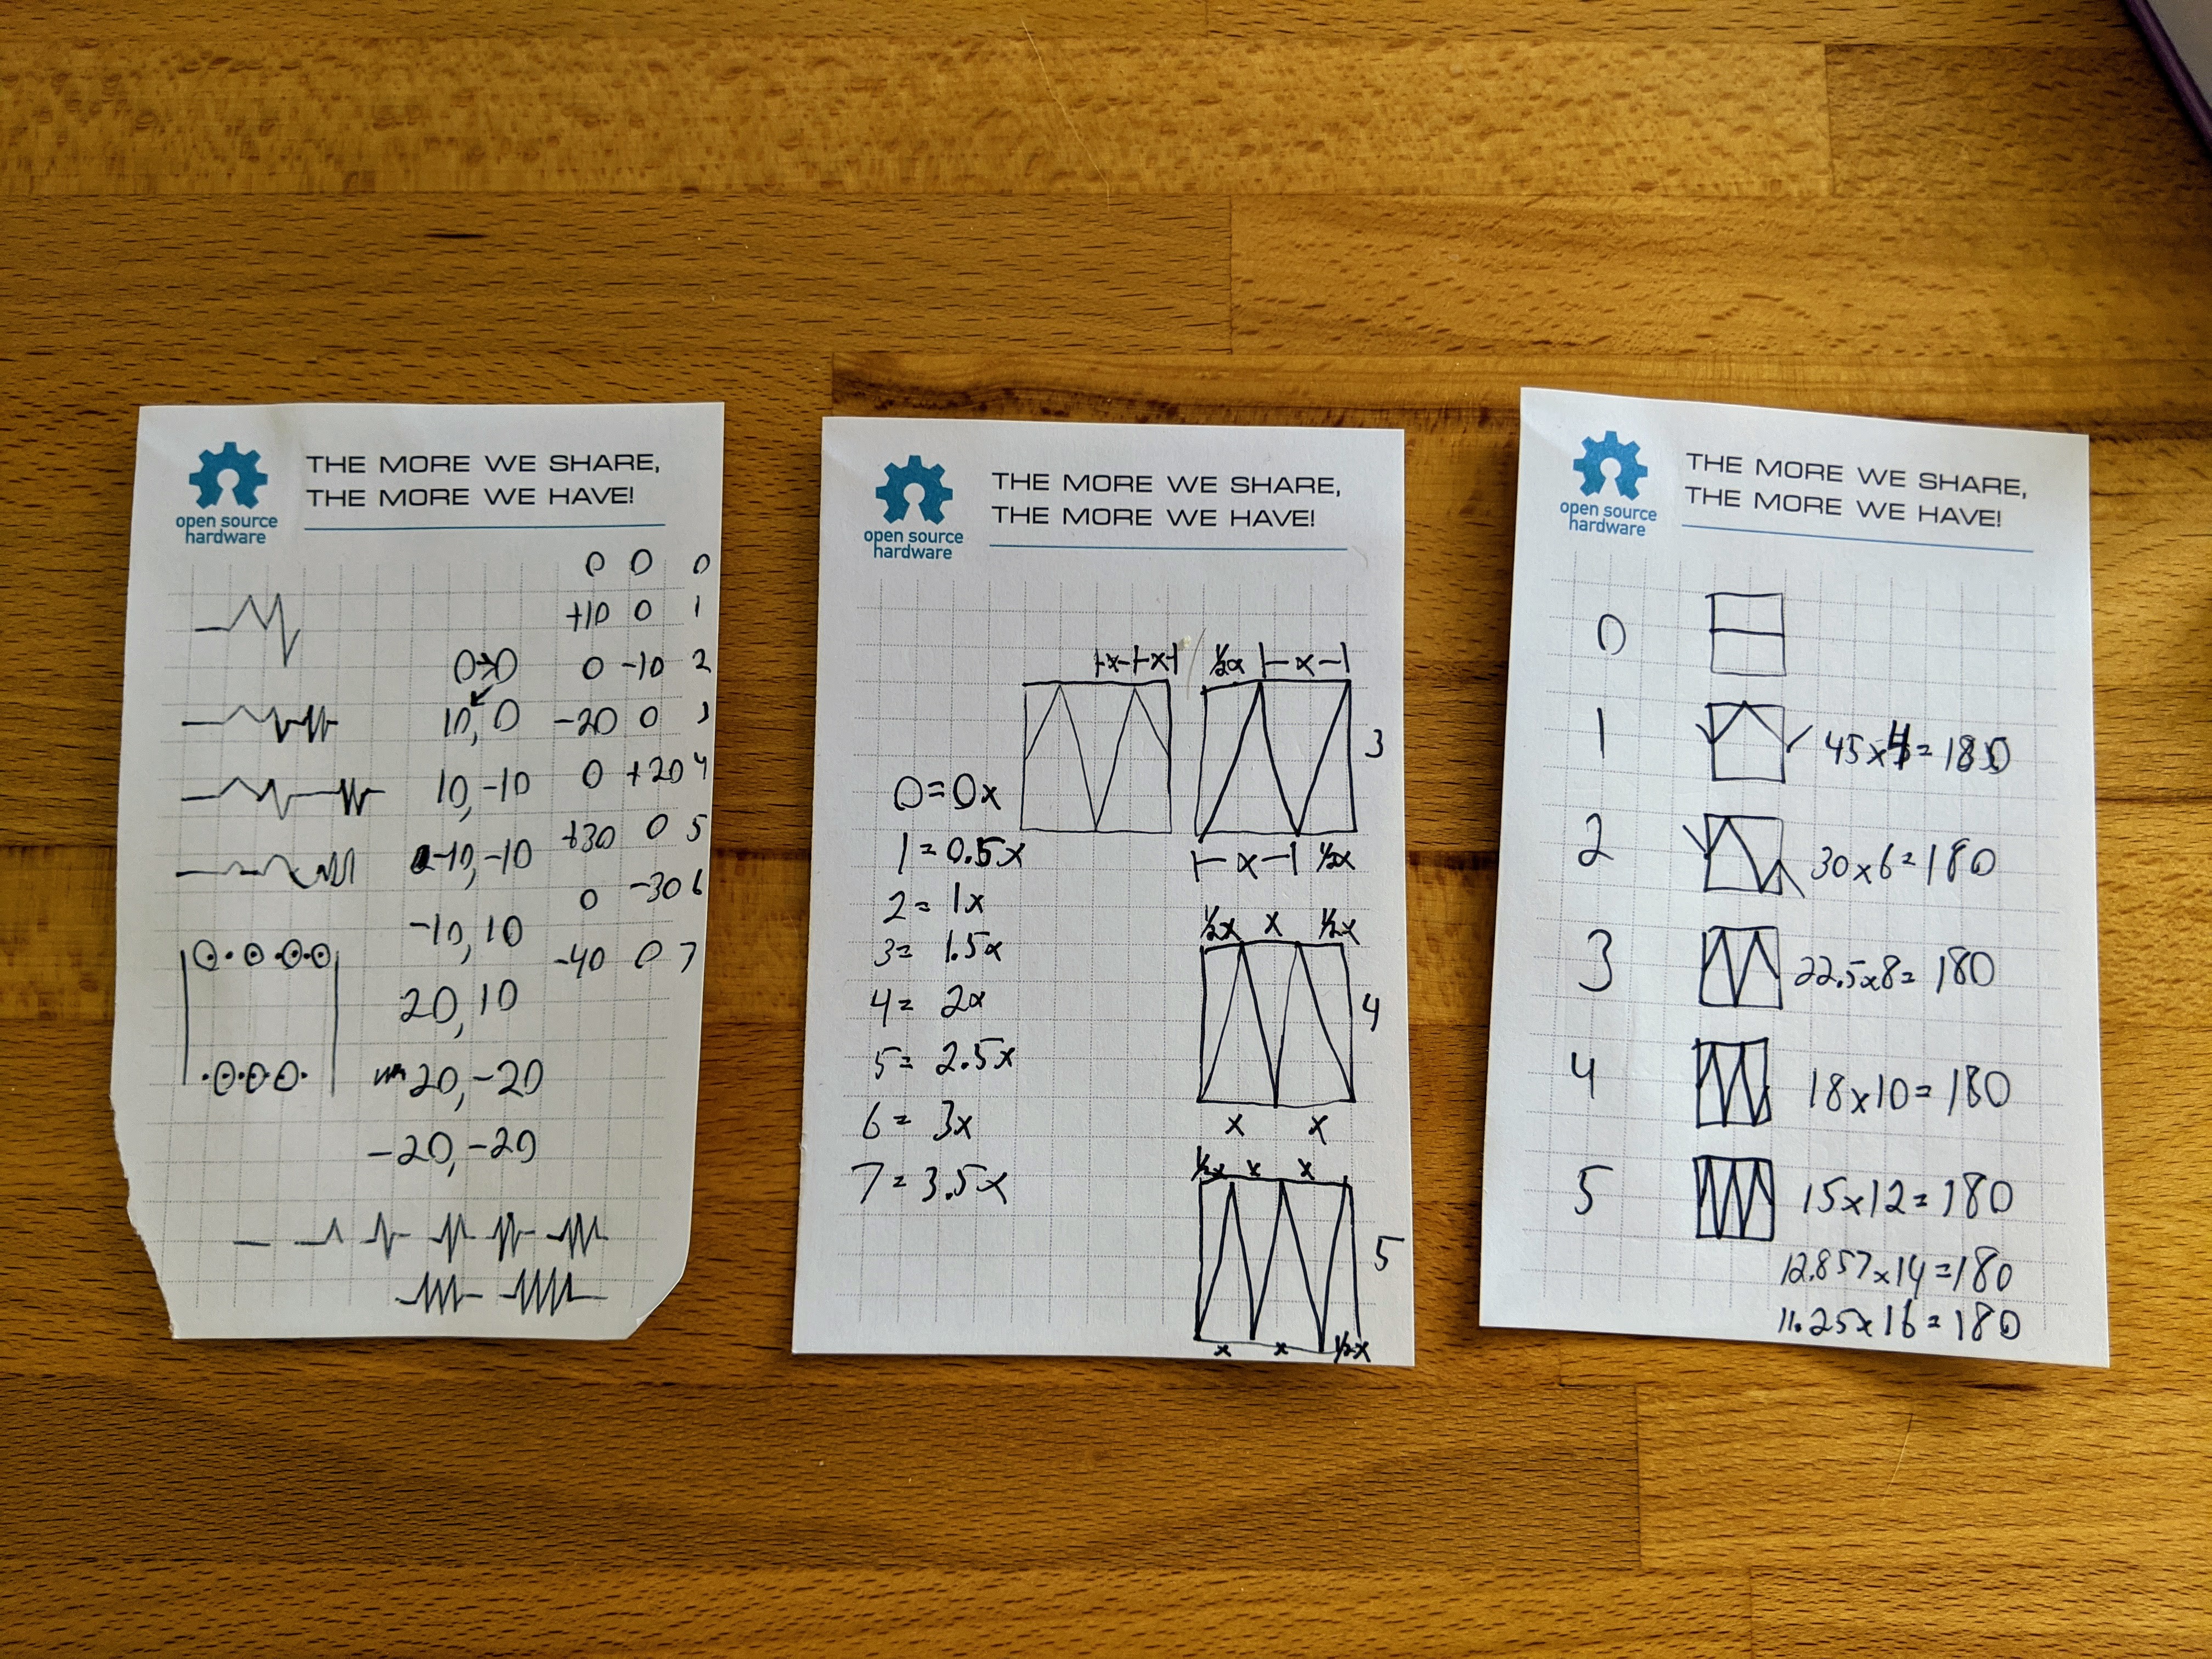
    This log is a bit out of order but I cleaned up my desk last week and want to get these papers off it lest I get back into the same mess I started in.

    These are my notes on how to write an algorithm for a zigzag within X space given N...N+7 peaks on the zigzags. Issues I encountered on conceptualizing this:

    • Tried to use angles at first, that was a complicated mess
    • I'm starting on the half-wavelength so tried to shift everything and account later
    • Final answer is that it's the number of segments of all combined crest and trough points that is all you need to calculate

    Also, the sets of numbers on the right half of the leftmost sheets is the literal points and the delta of those points for the spiral algorithm.

  • Plotting images with zigzag

    Mike Szczys05/02/2020 at 19:01 0 comments

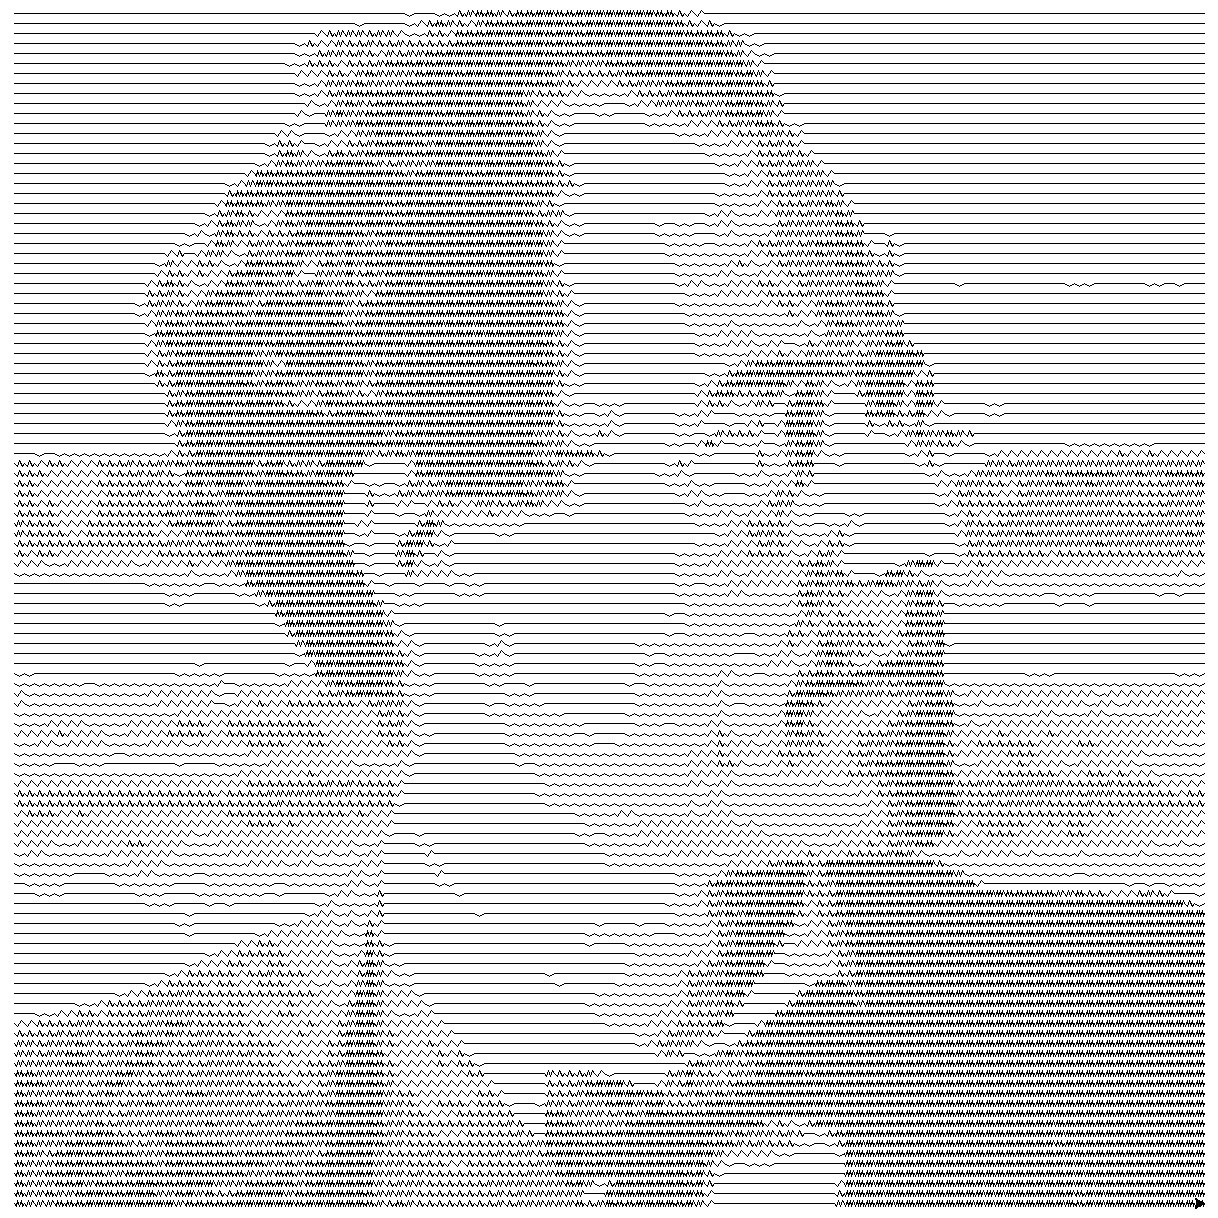
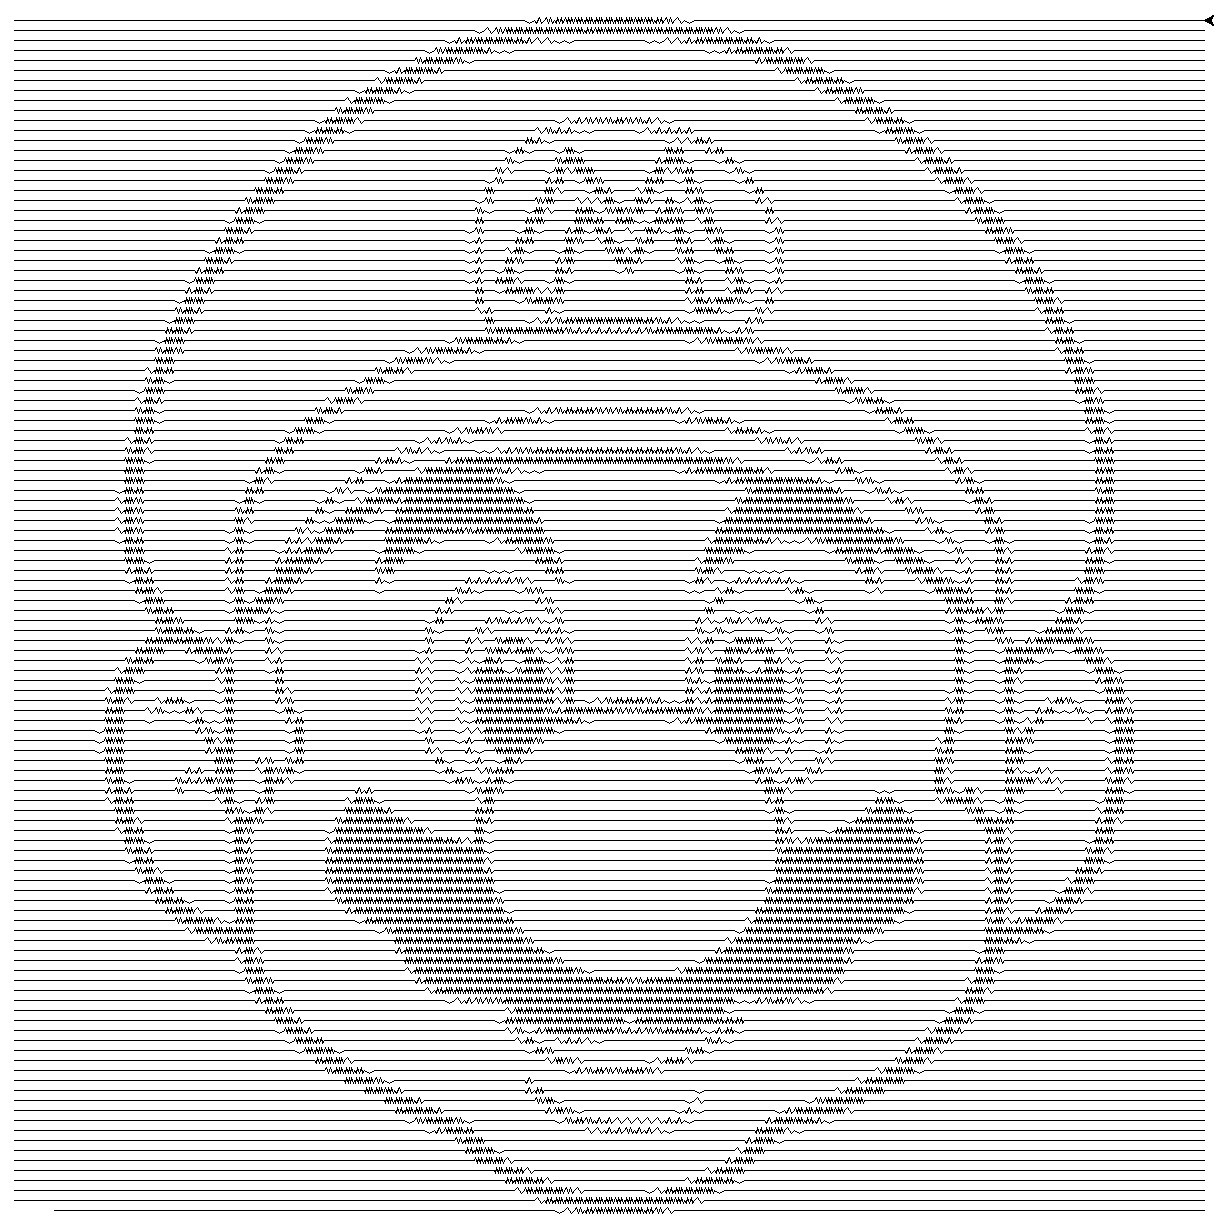
    I made two different test images to see how progress is coming along.

    Unfortunately these won't actually fit on the bed of the mid-t-bot as a 120mmx120m grid won't leave room for the 8 different levels of zigzag. I'll have to think about how to approach this. Maybe I need to do some zigzag tests on the plotter to find what my max resolution may be.

    These show promise but bring up a number of things I need to work on:

    • Last zigzag direction needs to be tracked. Currently zigzags always start with an upward stroke, but is last zigzag ended with a downward stroke this means an unsightly V shape.
    • Need to work on translating this to work on a spiral pattern. This was a quick and easy proof of concept, but the raster approach negates the use of a plotter. I think spiral will look much cooler while being drawn too
    • I'm currenlty pre-processing these in Gimp, converting to grayscale indexed images of 120x120 with 8 color palette, and exporting as .h files. It would be cooler if you could supply an image to Python and it would handle all of this
    • I'm still not actually generating g-code. I should probably break out all plotting functions to wrapper scripts which could then could turn on or off the g-code generation as well as trigger the turtle commands

  • XOR ZigZag

    Mike Szczys05/02/2020 at 17:02 0 comments

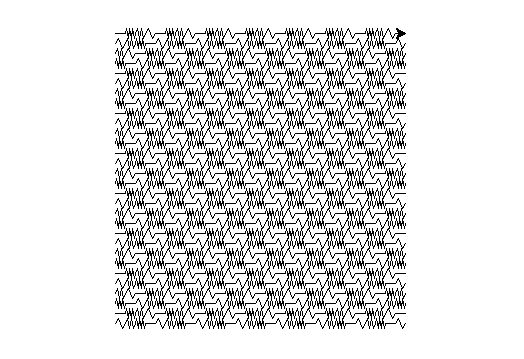
    I wanted to try out the zigzag patterns from the last project log. I found a little bug in how a 0 density was treated, but otherwise, drawing this XOR pattern worked out well. Next stop is processing images.

    def linesDemo(turtleObj, xlimit, ylimit, steps):
        for y in range(0, ylimit, steps):
            turtleObj.penup()
            turtleObj.setpos(0,y)
            turtleObj.pendown()
            for x in range(steps, xlimit, steps):
                density = (x ^ y) % 8
                zigzag(turtleObj, (x,y), steps/2, density)

    I ran the program which generated the image above with the following settings:  linesDemo(stylus, 300, 300, 10)

  • Drawing ZigZags

    Mike Szczys05/01/2020 at 23:00 0 comments

    To make my spiral patterns more useful I want to add some contrast element. Seems like drawing a zig-zag pattern is one way to do this as it fills more ink into a given space than merely drawing a straight line.

    from turtle import *
    
    stylus = Turtle()
    #stylus.setpos(100,100)
    
    def zigzag(turtleObj, endPosition, zigAmplitude, density):
        if density > 7:
            print("Warning: Density out of bounds, setting to zero")
            density = 0
        staticAxis = (endPosition[0] - turtleObj.position()[0], endPosition[1] - turtleObj.position()[1])
    
        #Don't zig if somethings wrong with coordiante sets
        if (staticAxis[0] == 0 and staticAxis[1] == 0) or (staticAxis[0] != 0 and staticAxis[1] != 0):
            print("Error: can't zig unles one and exactly one X/Y coordinate set is the same")
            #Just move to the end position and return
            turtleObj.setpos(endPosition[0],endPosition[1])
            return
    
        if density == 0:
            turtleObj.setpos(endPosition[0],endPosition[1])
            return    
    
        if staticAxis[0] == 0:
            #We should be moving along the Y axis because start and end X coord is the same
            staticStart = turtleObj.position()[1]
            peaks = returnZigPoints(staticStart,endPosition[1],density)
            amplitudeValues = (endPosition[0] + zigAmplitude, endPosition[0] - zigAmplitude)
            for i in range(len(peaks)):
                turtleObj.setpos(amplitudeValues[i%2],staticStart+peaks[i])
        else:
            #We're moving along the X axis
            staticStart = turtleObj.position()[0]
            peaks = returnZigPoints(staticStart,endPosition[0],density)
            amplitudeValues = (endPosition[1] + zigAmplitude, endPosition[1] - zigAmplitude)
            for i in range(len(peaks)):
                turtleObj.setpos(staticStart+peaks[i],amplitudeValues[i%2])
    
        #Send cursor to the final position
        turtleObj.setpos(endPosition[0], endPosition[1])
    
    def returnZigPoints(startPoint,endPoint,density):
        steps = (endPoint-startPoint)/(density+1) #There is 1 more segment between points than there are total points
        pointset = [steps]
        for i in range(1,density):
            pointset.append(pointset[-1]+steps)
        return pointset

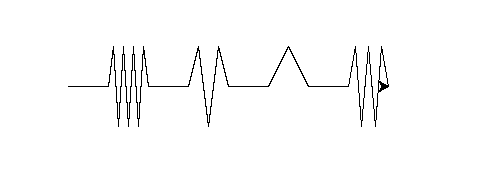
    Using this code:

    stylus.setpos(40,0)
    zigzag(stylus,(80,0),40,7)
    stylus.setpos(120,0)
    zigzag(stylus,(160,0),40,3)
    stylus.setpos(200,0)
    zigzag(stylus,(240,0),40,1)
    stylus.setpos(280,0)
    zigzag(stylus,(320,0),40,5)

    So if I combine this with a bit of image processing and add it to the spiral patterns I was drawing before, I should be able to make some kind of meaningful abstract representation of 3-bit grayscale. That's next on the challenge list!

  • Drawing Spirals

    Mike Szczys05/01/2020 at 22:52 0 comments

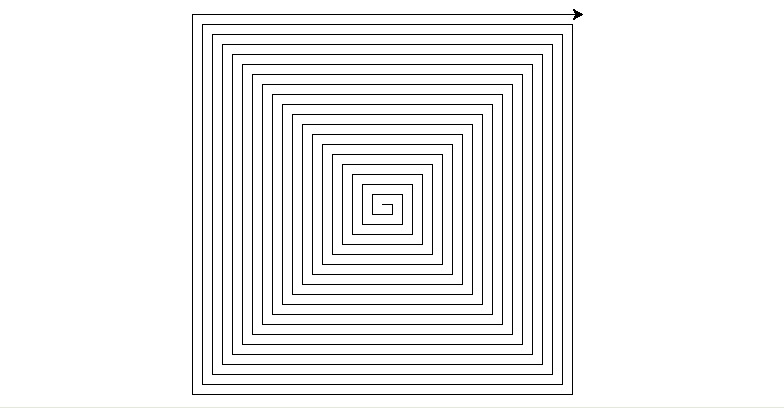
    I'm working on some code to generate spiral patterns. So far I'm using Turtle in Python to simulate the pen plotter (you may remember this from the Apple ][)

    from turtle import *
    
    stylus = Turtle()
    #stylus.setpos(100,100)        
            
    def drawSpiral(turtleObj,limit, steps):
    
        #0=right, 1=down, 2=left, 3=up
        
        increment = 0
        counter = 1
    
        while turtleObj.position()[0] < limit and turtleObj.position()[1] < limit:
            #if odd
            if counter%2 != 0:
                
                #increase by 10
                if increment < 0:
                    increment -= steps
                else:
                    increment += steps
                #change X
                turtleObj.setpos(turtleObj.position()[0]+increment,turtleObj.position()[1])
            #if even
            else:
                #flip polarity
                increment = increment * -1
                #change Y
                turtleObj.setpos(turtleObj.position()[0],turtleObj.position()[1]+increment)
            counter += 1

     Which when run using drawSpiral(stylus,191,10) gives us the nice demo below. This isn't spitting out g-code, but it shouldn't be hard to add that in when ready.

  • Hilbert Curves

    Mike Szczys12/20/2019 at 07:25 1 comment

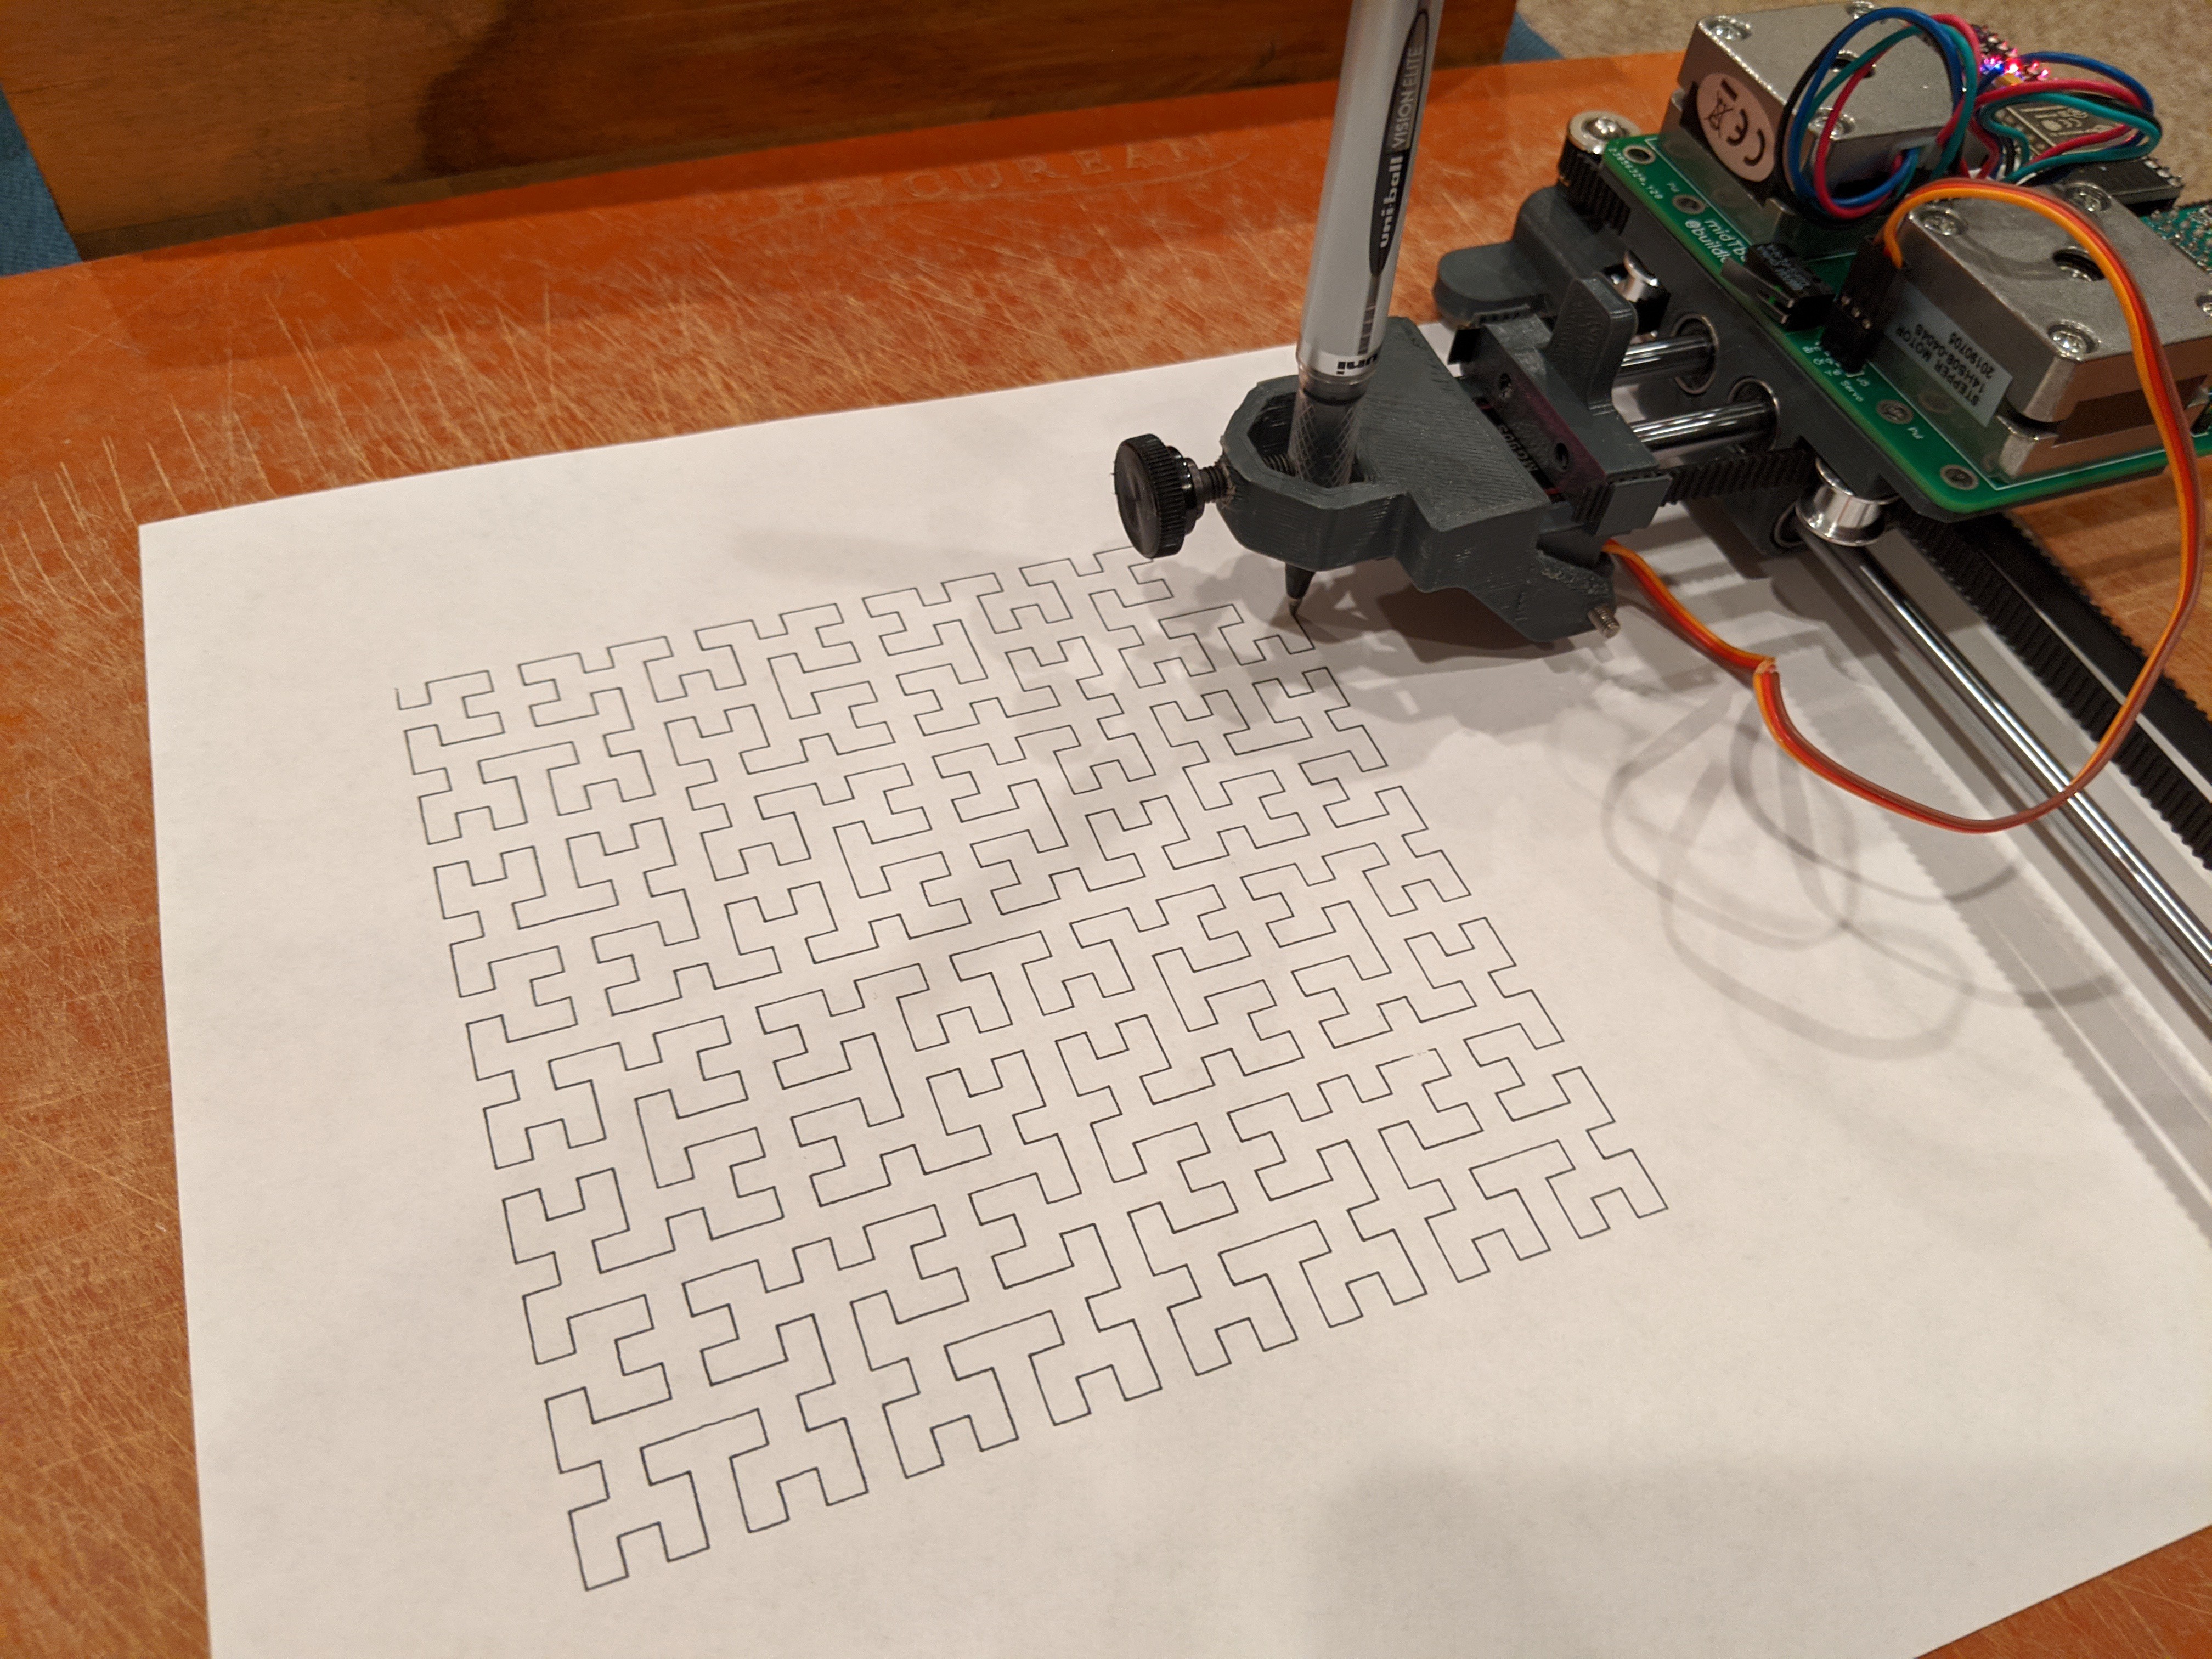
    I grabbed some simple Hilbert Curve code from this thread:

    https://stackoverflow.com/questions/7218269/hilbert-curve-analysis

    And added the ability to export gcode instructions as the recursive function played out. The result is very satisfying as the pen is never picked up.

    Code for this is available in the files section.

View all 6 project logs

Enjoy this project?

Share

Discussions

Andy Geppert wrote 05/01/2020 at 01:34 point

You've got some awesome precision going on there!

  Are you sure? yes | no

Similar Projects

Does this project spark your interest?

Become a member to follow this project and never miss any updates