-
Log 6. Pushing the performance envelope.
01/05/2021 at 21:00 • 0 commentsSo far I had a nice looking Visual Ear spectrum analyzer color bar, with a very fast processor and pretty nice response times, but I still didn't feel like the high frequency bands were responding fast enough.
Remember, my goal was to be able to "See" a drum-roll.
Although I had achieved a low latency response to new sounds by adopting a sliding window on the full 8192 sample audio input, I still had a problem that once a short sound was in the audio buffer, it tended to persist on the display until it has scrolled out of the sample window. Since the full duration of the sample buffer is 185 mSec, there is no way to see a pulsing drum-roll.
I seemed stuck between a rock and a hard place. I needed a full 185 mSec audio sample to capture and resolve low frequency sounds, but I really wanted a shorter buffer for rapidly changing higher frequency sounds.
So, since I had a super fast processor, I decided to see if I could keep up the same update rate, but utilize two FFT's optimized for upper and lower frequency bands.
As my code "readme" states... here's what I did.
---------------------------------------------------------------------------------------------
Note: Program constants are referenced in this description as follows: 64 (CONSTANT_NAME)
The Teensy audio library is used to sample the I2S digital microphone continuously at the standard 44100 Hz rate. Successive Bursts of 128 samples are cataloged and saved as an array of Burst pointers. This array holds 72 (NUM_BURSTS) Burst pointers. Only 64 (BURSTS_PER_AUDIO) of these are being processed at any time. The remaining 8 (EXTRA_BURSTS) are used to start capturing more audio while the current Packet of 64 Bursts is processed.
To cover the full 55-17,153 Hz spectrum, it’s necessary to acquire 8192 samples (64 Bursts of 128 samples). But this would take 185 mSec to collect, so it’s not practical to wait for the full sample to be collected before updating the display.
To permit faster display updates, a sliding window is created to process the most recent 64 Bursts, every time a new set of 4 (BURSTS_PER_FFT_UPDATE) Bursts have been received. This event occurs every 11.6 mSec, which becomes the update rate for the overall display (86 updates per second).
A standard FFT (Fast Fourier Transform) is used to convert the Audio Packet (8196 Samples) into frequency buckets. Initially, a single FFT was used to process the entire sample. This transform could be performed in the available 11.6 mSec, but a high frequency sound spike would be spread over the entire 185 mS sample duration. So a sudden sound would appear quickly, but it would persist on the display for the full 185 mSec. This effectively limits the responsiveness of the system to rapid sounds like a drum roll.
To accommodate BOTH slow low-frequency sounds, and rapid high-frequency sounds, the available Audio packet is now processed by two separate FFTs. Each optimized for a different frequency range. The Low FFT is looking for sounds in the 55-880 Hz range. The High FFT is looking for sounds in the 880-17,153 Hz range.
To capture and resolve low sounds, the Low FFT uses the entire Audio Packet, but it only processes every fourth sample. This enables the FFT to work with a smaller input sample set of 2048, which still produces 1024 frequency bins of 5.4Hz width.
To capture and resolve rapid high sounds, the High-FFT only uses the most recent quarter of the Audio Packet, but at the full 44.1 kHz sample rate. This enables this FFT to also work with a smaller input sample set of 2048, but produces 1024 frequency bins of 21.5Hz width. Since this FFT is only using a quarter of the sample history, short-pulse sounds only persist for a max of 46.4 mSec, which should be able to display a 10 Hz drum-roll.
The current performance specs are as follows:
- 59 Frequency Bands, spanning 55 Hz - 17163 Hz (8.25 Octaves)
- Each Band is displayed with a specific color, and 512 intensity levels (Using 2 LEDS per band)
- Display is updated with fresh data every 11.6 mSec (86 Hz update rate)
- Visual Latency: 13.5 mSec (11.6 mSec acquisition + 1.9 mSec for dual FFT & display)
- Low Freq (<800 Hz) Persistence: 185 mSec.
- High Frequency (> 880 Hz) Persistence: 46 mSec.
-
Log 5. Making it look nice.
01/01/2021 at 03:14 • 0 commentsNow things were working, I needed a way to mount the LEDs and electronics in a nice housing to make my Visual Ear a piece of furniture.
As soon as I had verified that the Teensy was a great choice for the project, I used EagleCad to design a simple PCB to hold the Teensy, Adafruit I2S microphone breakout and some switches. I then sent to files of to PCBway.com to get them turned into some PCBs.
To anyone who is still fighting with protoboards or hand-making PCBs, you REALLY need to try out PCBway. Learning a versatile schematic and layout program like EagleCad is a great investment, and then turning your ideas into clean PCBs couldn't be simpler, cheaper or faster than PCBway.
For this project I went with their 10 boards for $5 plus $27 for DHL 5-7 day shipping. The boards are made in 24 Hours and shipped from China. I typically get my finished boards within 7 days of sending the files. The customer support is pretty great considering the low costs, and then I often end up getting them to assemble low-medium quantities of boards if I'm going to sell them.
In this case, by the time I had ordered the LED mounting strip, and finished refining the design for the 3D printed end-cap, the blank PCBs turned up ready for me to assemble into the final product.
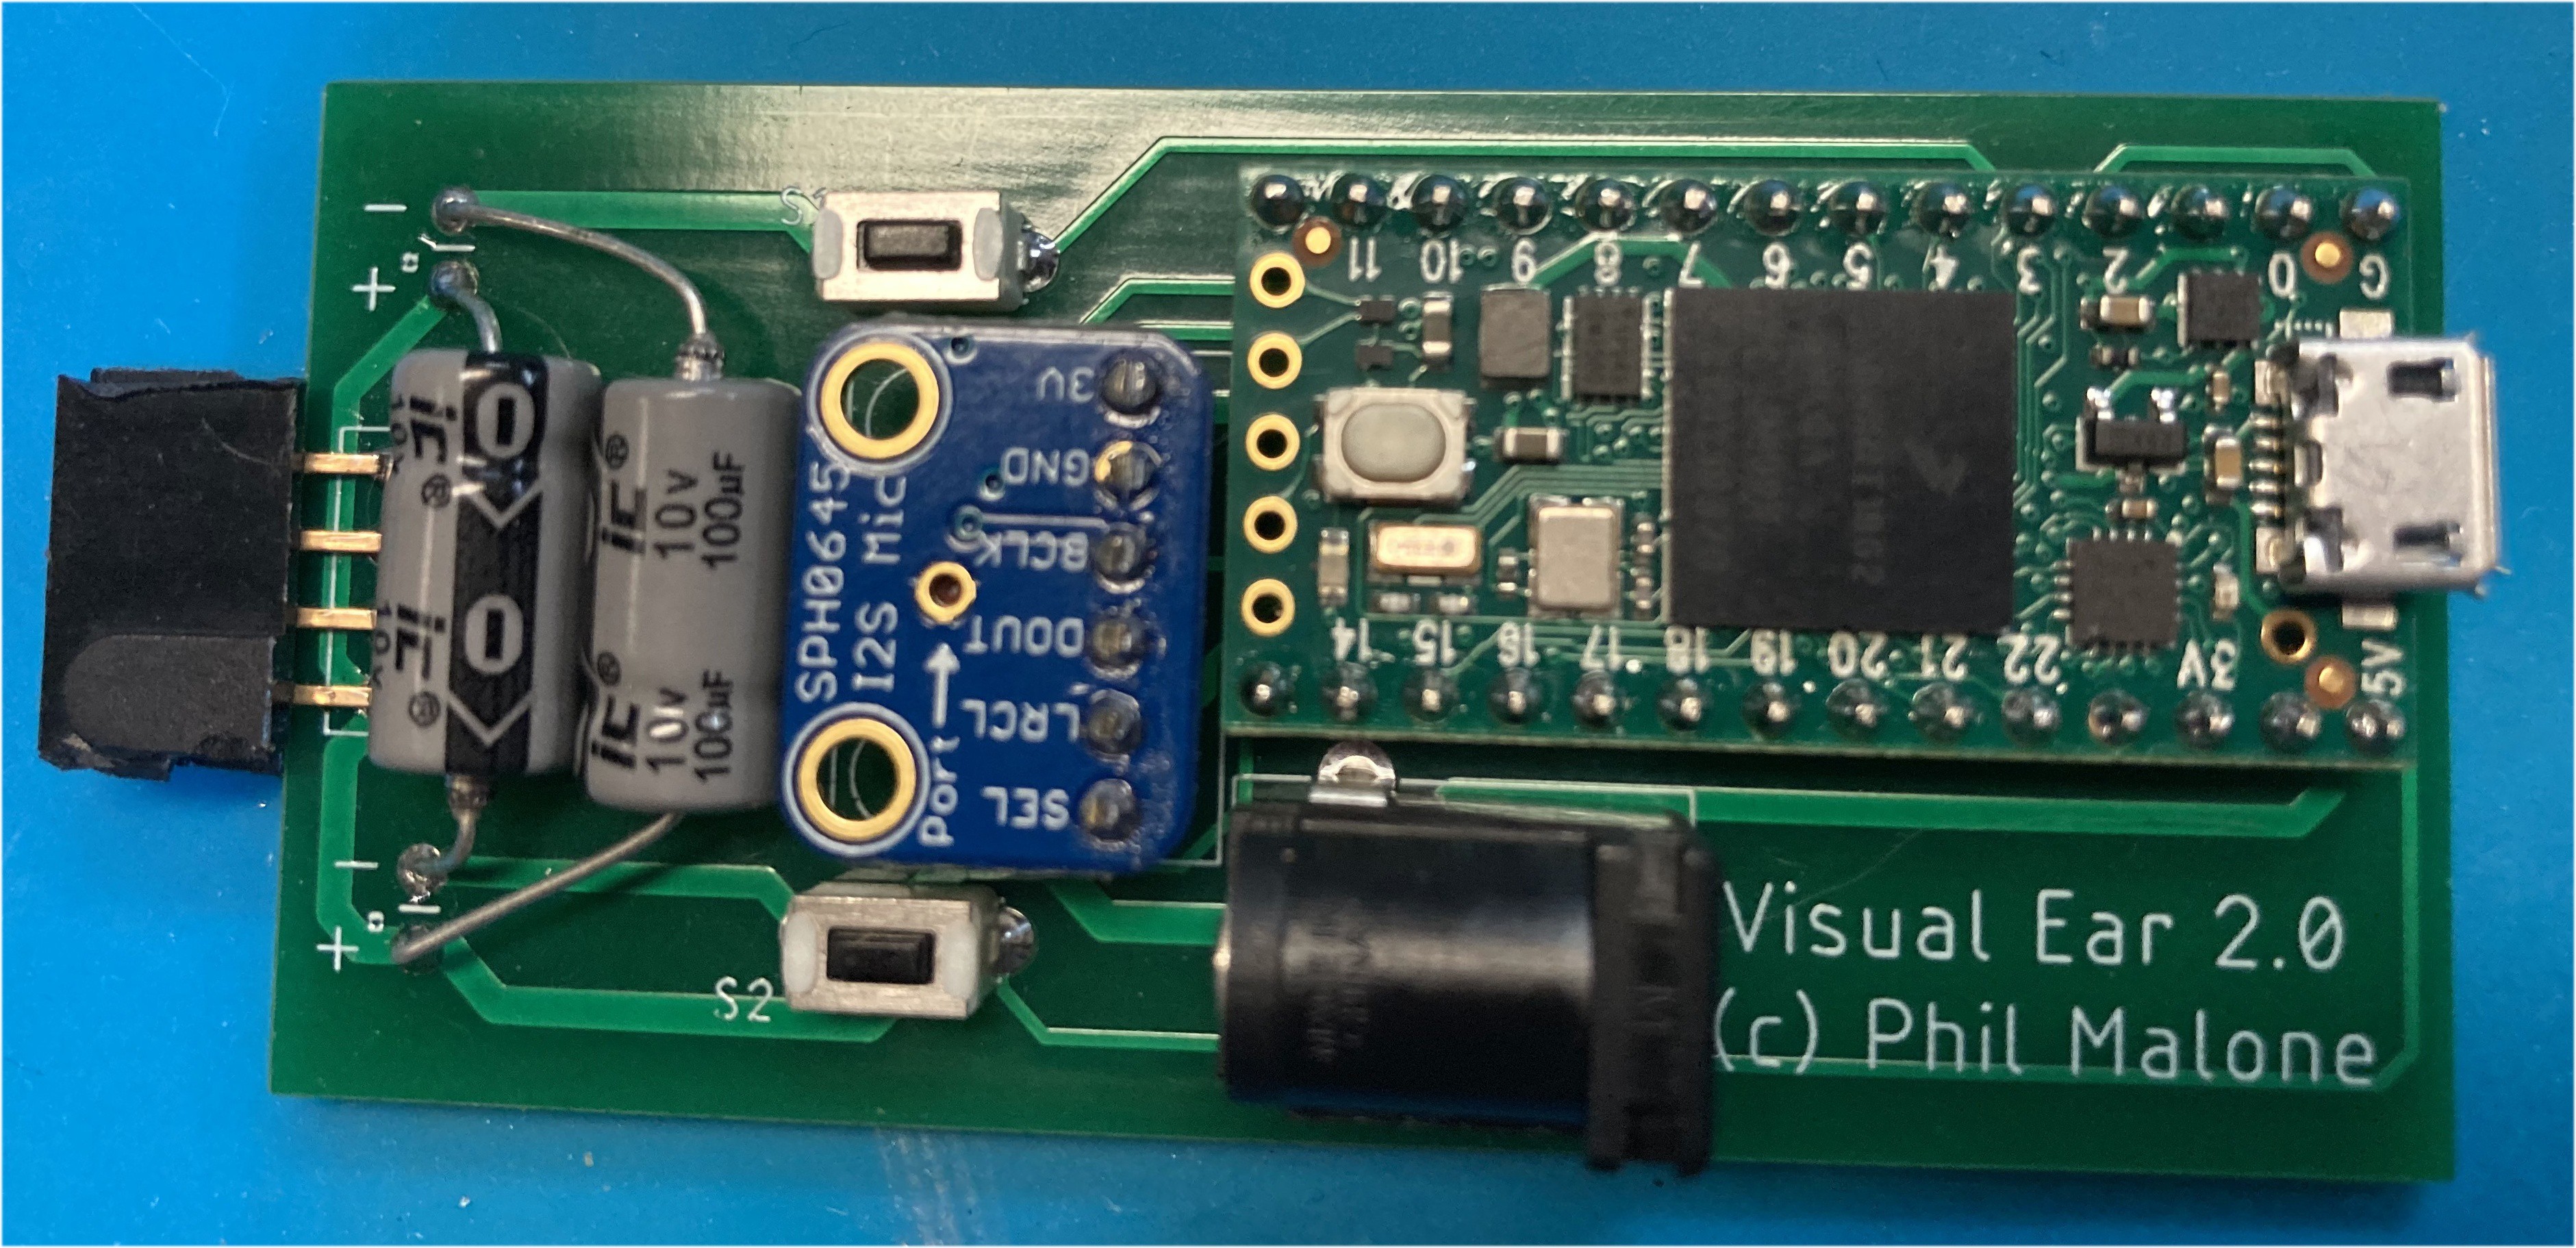
Here's the end result, with the components added.
![]()
Next was the physical mounting hardware.
I did some research to locate wide aluminum LED mounting strips. I needed it to be wide because I wanted to make a 3D printed end-cap to house the circuit board and none of the narrow mounting strips I had found were wide enough.
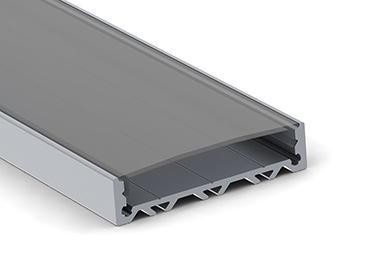
I found a great strip form Wired4Signs.com that was more than wide enough to insert a printed end-cap that could hold the PCB I intended to make.
![]()
I used OnShape.com to design an end-cap to fit inside the end of the strip. The first version was just to hold the PCB and see if the microphone would work through a hole in the cover.
I used my new FLASHFORGE Adventurer 3 Printer to print a series of pieces, each verifying one design element or another. I just love the quality of the FLASHFORGE prints.
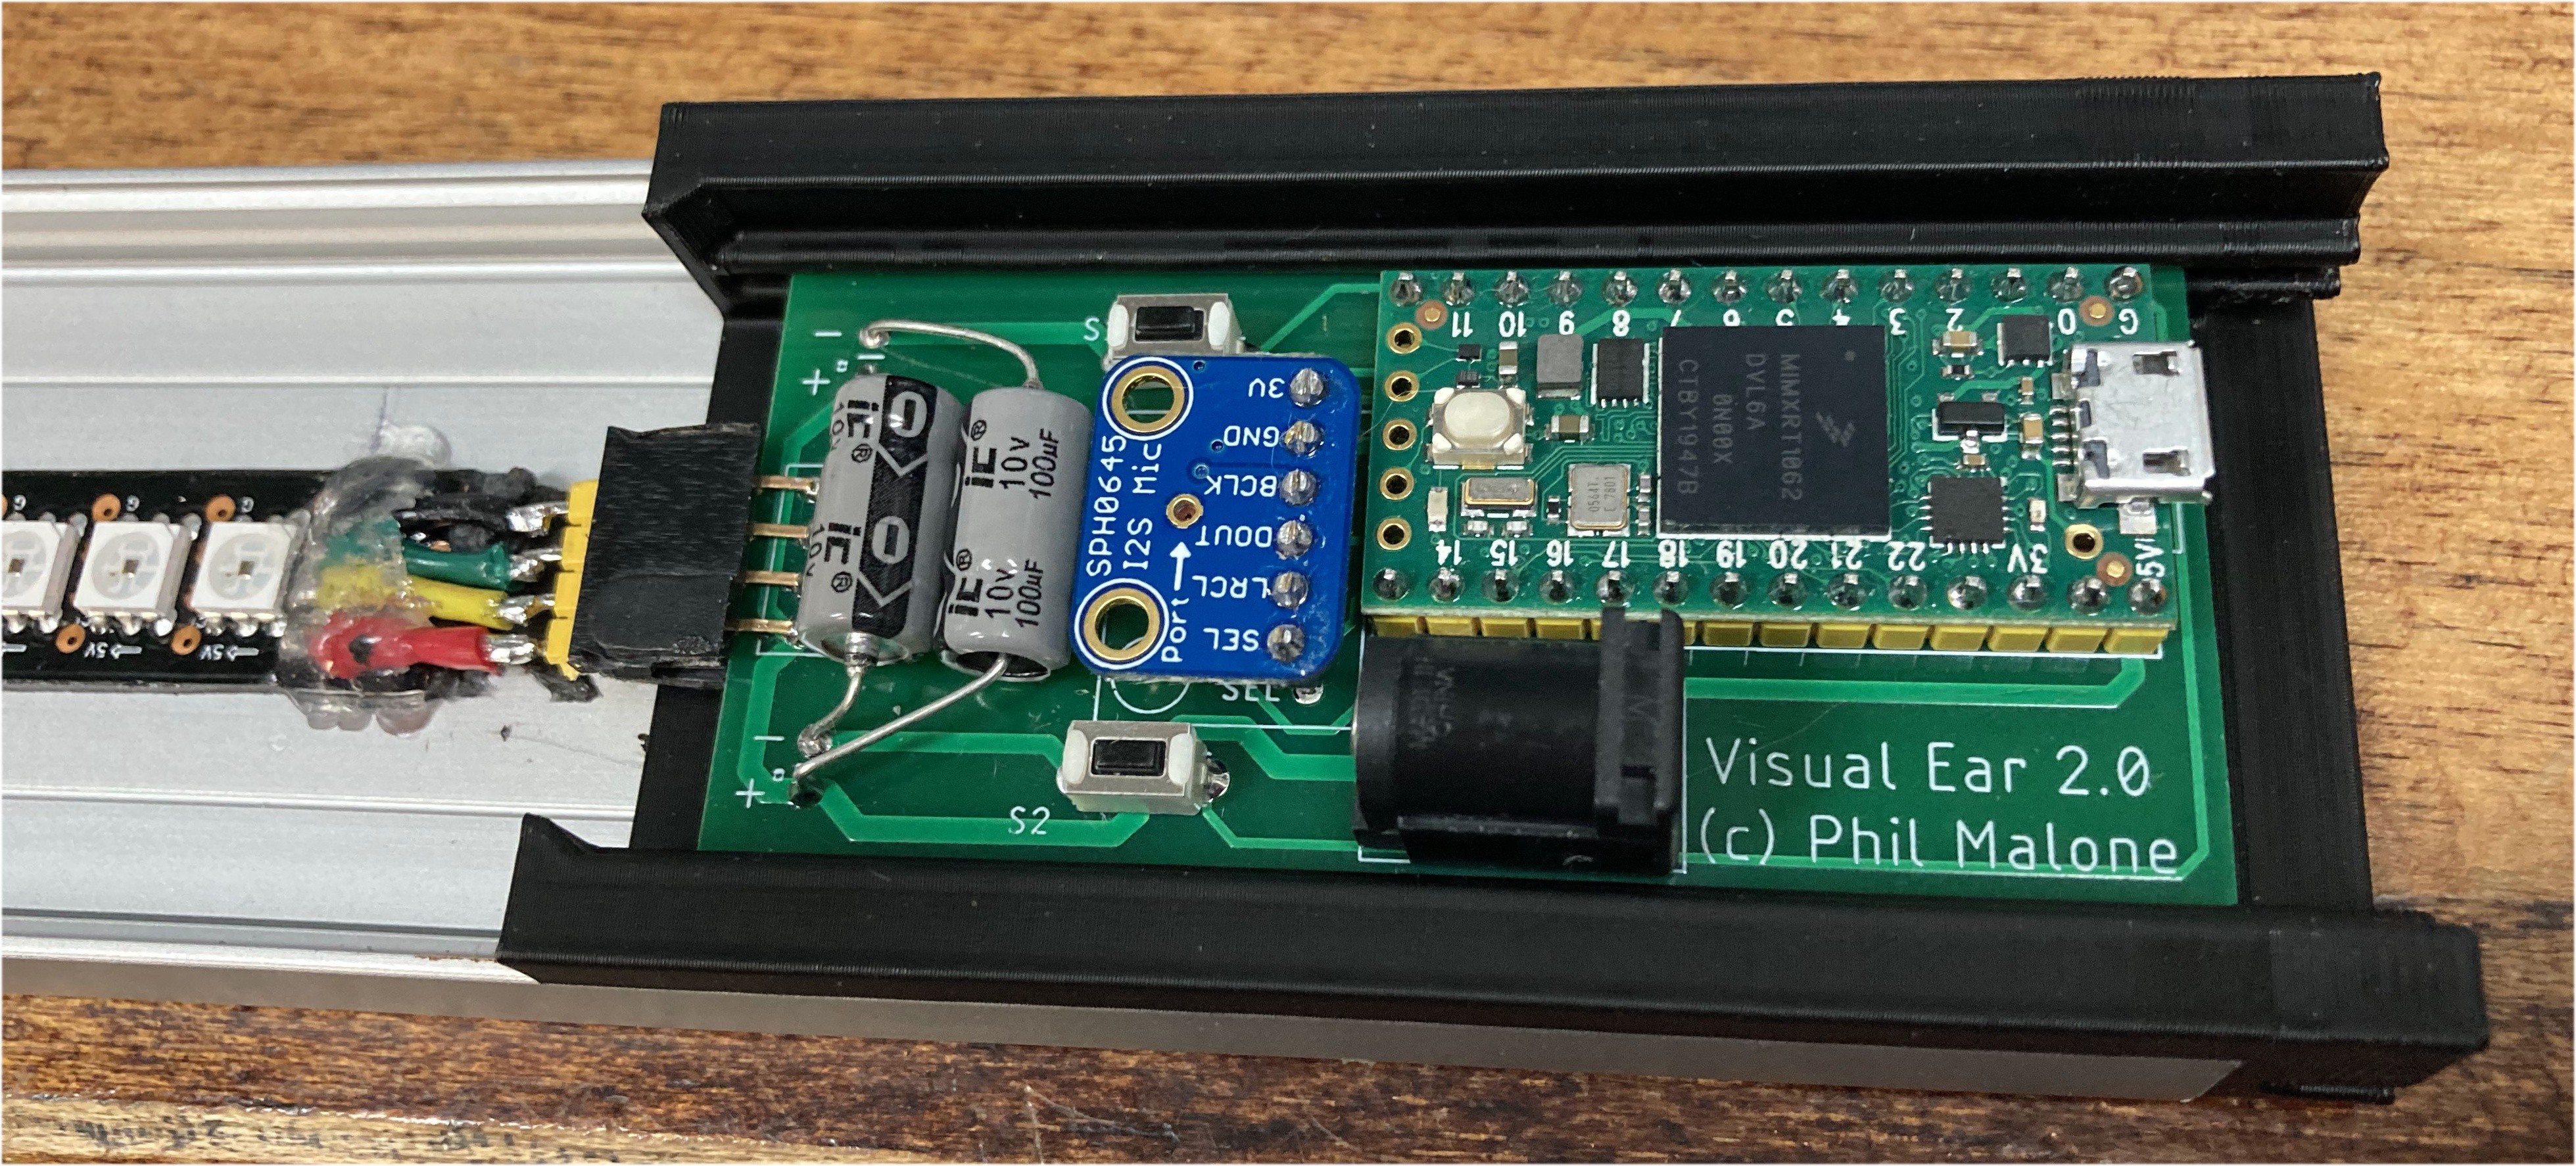
Here's the PCB slid inside the end-cap and fitted inside the end of the metal strip. Also note the high density LED strip attached to the housing, and connected to the PCB via a 4-pin plug. (Excuse the hot glue used to anchor the wires.
![]()
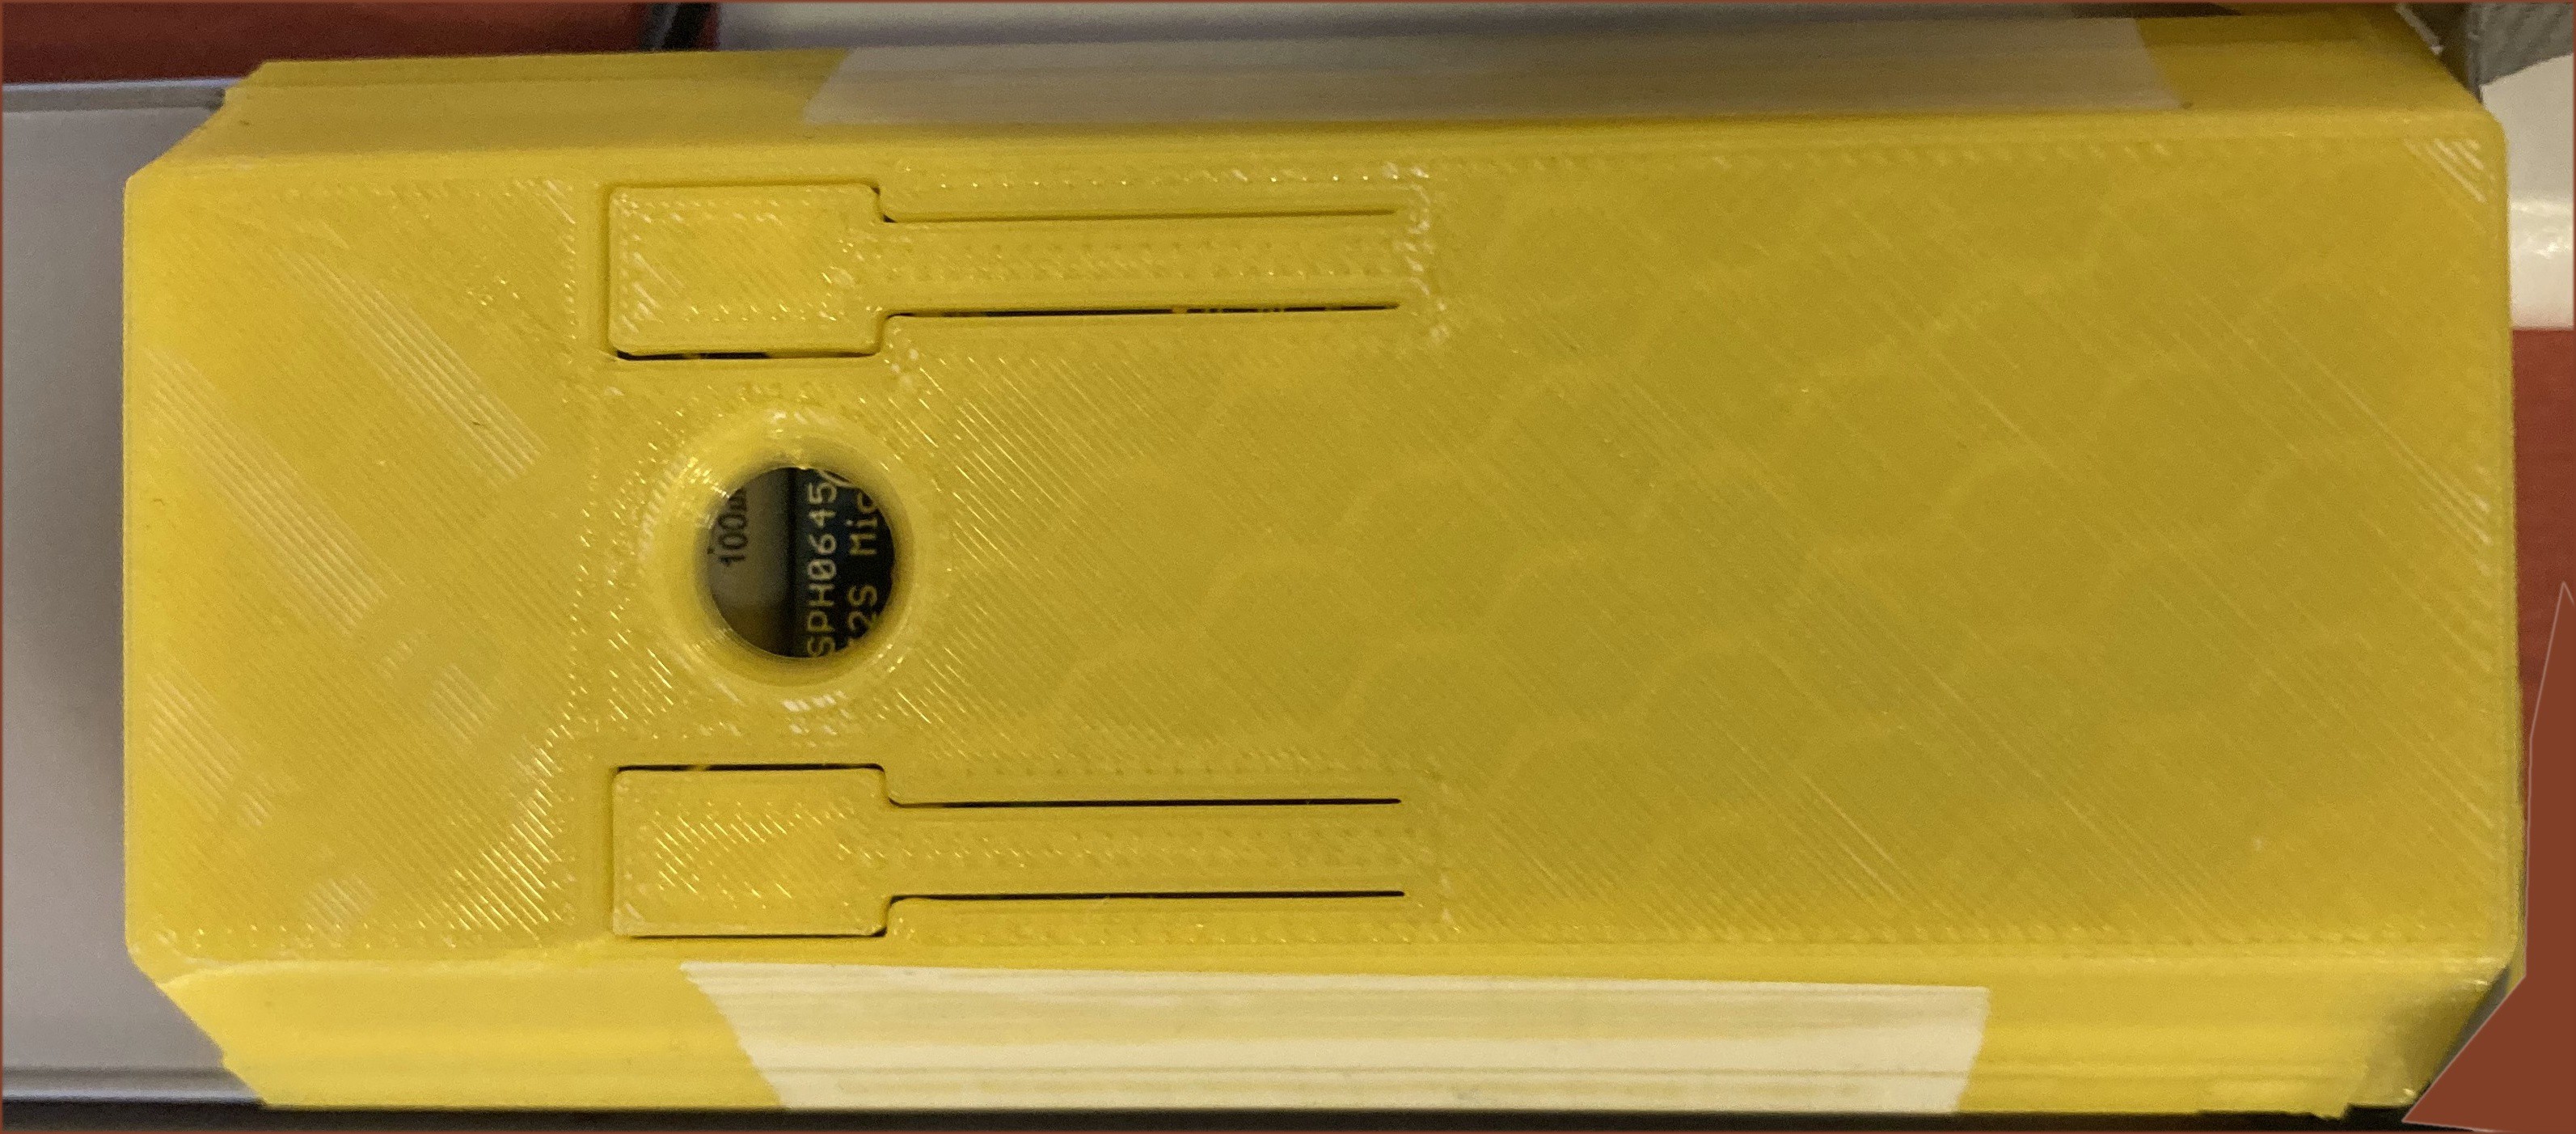
A 3D printed cover snaps over the end-cap and has two flexible button covers that flex and let you increase or decrease the microphone sensitivity.
![]()
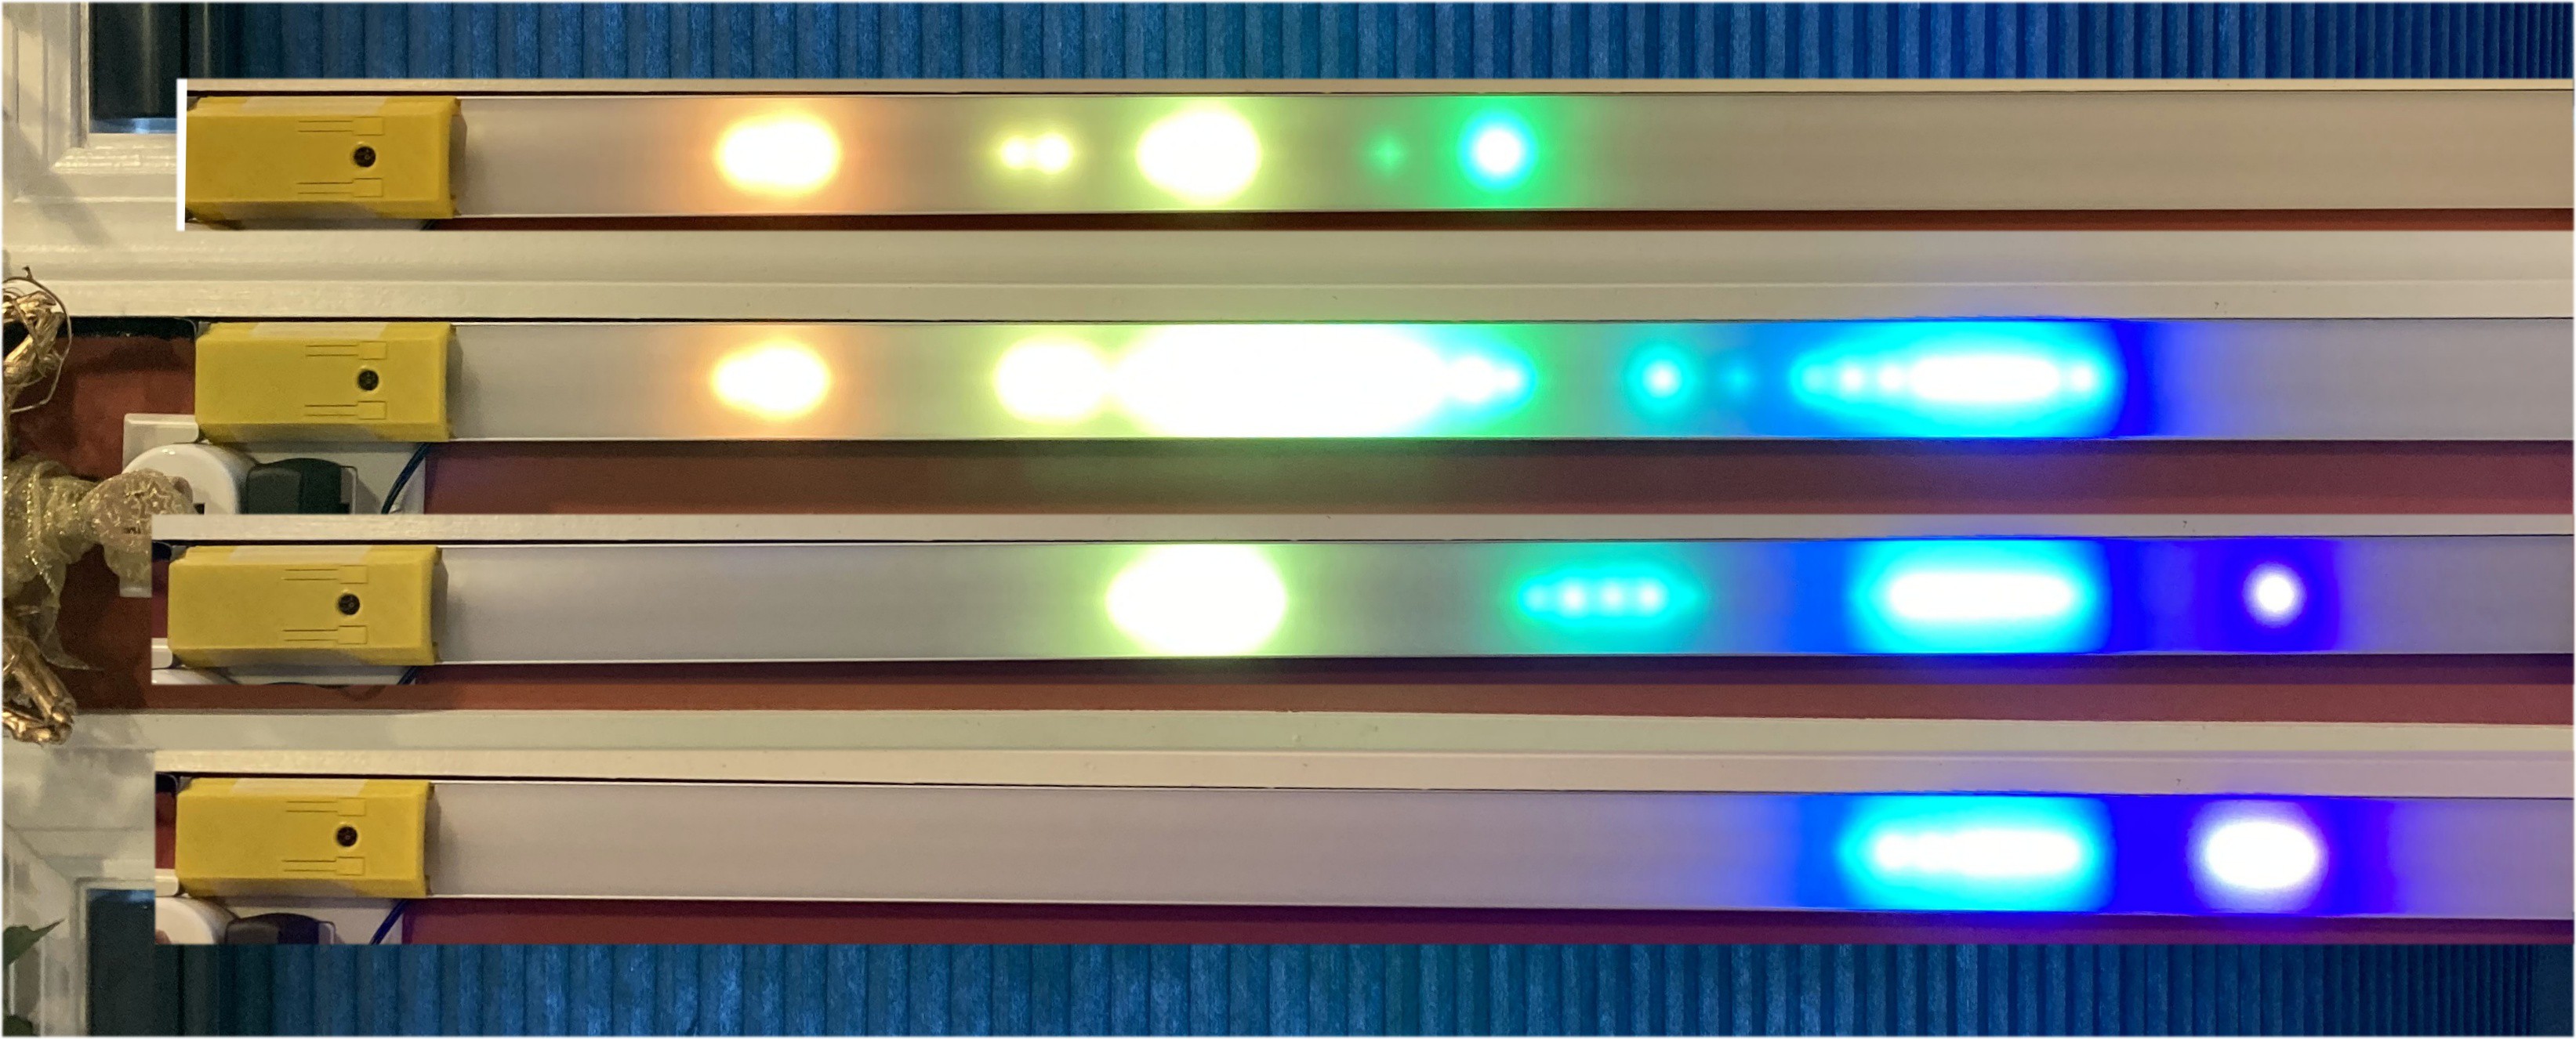
I mounted the strip to the wall and took some photos of normal talking speech. You can get a feel for the wide range of color/tone combinations from the pics below.
![]()
The colors extend all the way down to a deep red for very low tones, and up into violet for sounds that I can't even hear.
-
Log 4. A processor Upgrade.
01/01/2021 at 01:57 • 0 commentsBy now I had decided that I had reached the limits of the ESP32's FFT processing power.
- Bands: 59 Bands, spanning 55 Hz - 17163 Hz (8.25 Octaves)
- Audio Samples per FFT: 4096 samples @ 36 kHz
- FFT Frequency Bins: 2048 bins (8.79 Hz each)
- Display Update interval: 27 mSec (37 Hz)
- Audio to Visual Latency: Max 40 mSec (14 mSec acquisition + 26 mSec FFT & display)
I had some ideas of how to speed up the audio updates, but if I wanted to stick with floating point math, there was no way to speed up the FFT algorithm. So I sought out a hardware solution.
About this time I came across the Teensy processor. In it's current 4.x incarnation it was claiming processor speeds 6+ times faster than the ESP32, and it also had a hardware floating point unit. So I decided I needed to run some math speed tests.
![]()
I bought a Teensy 4.0 for about $20, and set up an Ardunio Development environment. I will admit this was a bit tricky since I had to manually install the custom Arduino extension (it's not supported by the library manager), and some of the library functions seemed to clash with some other ones I had already installed, but after some path tweaks I got it up an running.
I first decided to run some floating point math speed tests, since this is what I needed for the FFT calculations. My initial results were really confusing, since it seemed like the calculations were not consuming any time. Eventually I started increasing the loop iterations by factors of 10 and 100 and measuring the execution time in micro-seconds, rather than milli-seconds. Then I started getting some meaningful results.
Suffice it to say that FFT execution times were NOT going to be a problem any more. I was able to double my number of input samples, and still process them all in a 1/10th of the time it was previously taking the ESP32.
At this point I think it's fair to say that the ESP32's great strength is it's wireless capabilities, but the Teensy has it in spades when it comes to processing power.
Next I had to re-solve the challenge of reading the I2S microphone that I'd used on the ESP. Here is another difference with the Teensy. The Teensy Arduino install comes with an Audio library that lets you sample an audio input source in the background and pass audio packets to a processing pipeline. This essentially eliminated the need for the ESP's two cores.
The Audio library is hard coded to sample at 44100 Hz, and it assembles the audio into 128 sample packets. Each packet corresponds to 2.9 mSec of audio. Since I was already packetizing my audio in the ESP to reduce visual latency, this turned out to be a bonus. I just needed to decide how many packets I wanted to append before passing the entire sample off to the FFT.
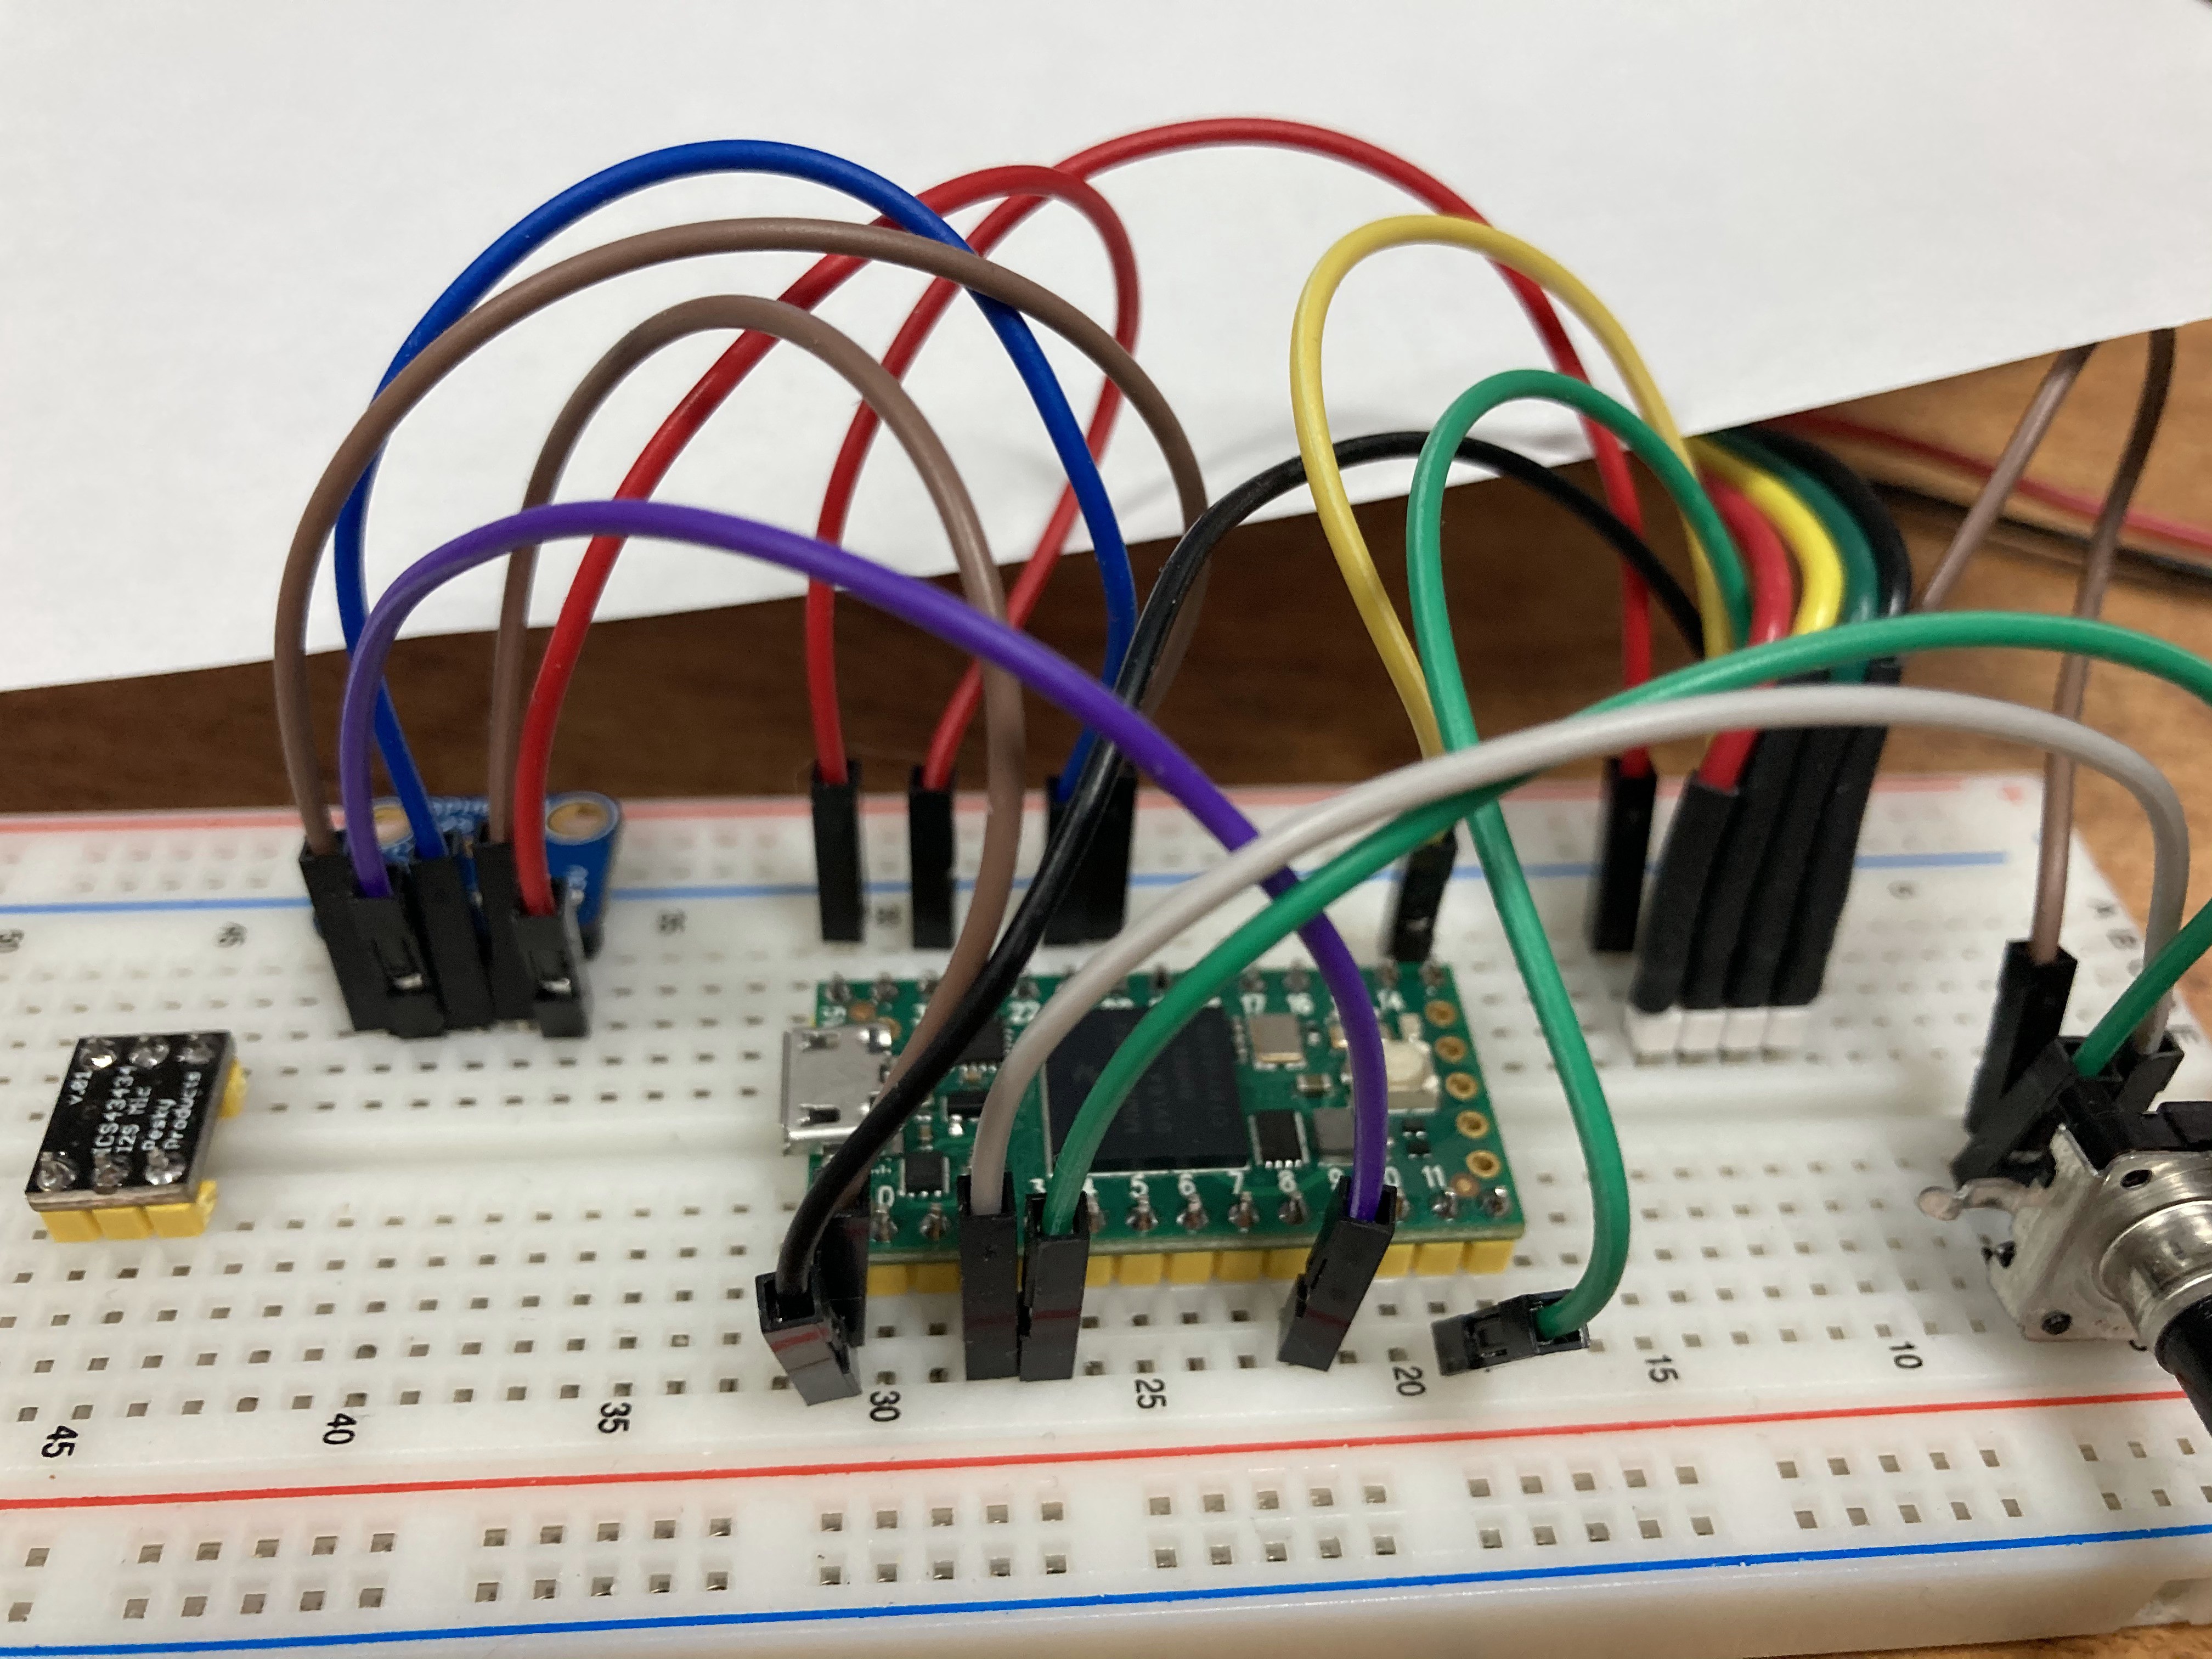
After figuring out the new pinouts, I mocked up a prototype circuit to read the microphone and drive the LED display.
![]()
The required code was sufficiently different that I thought it would be better to create a new Github repository for the Teensy, rather than creating a branch off the ESP one. So, that's why there are two code links for this project.
In the end, my first pass at optimizing the Teensy code ended up with the following specifications:
- Bands: 59 Bands, spanning 55 Hz - 17163 Hz (8.25 Octaves)
- Audio Samples per FFT: 8192 samples @ 44.1 kHz
- FFT Frequency Bins: 4096 bins (5.38 Hz each)
- Display Update interval: 11.6 mSec (86 Hz)
- Audio to Visual Latency: Max 23 mSec (11.6 mSec acquisition + 11 mSec FFT & display)
Once I had a well performing circuit, I wanted to start putting the circuit and LEDs in a decent housing. I searched online for some wide aluminum LED mounting strips, and started designing a 3D printed end-cap that could hold the circuit.
Read my next log to see more about the physical construction.
-
Log 3. Optimizing performance to meet requirements
11/24/2020 at 16:13 • 0 comments![]()
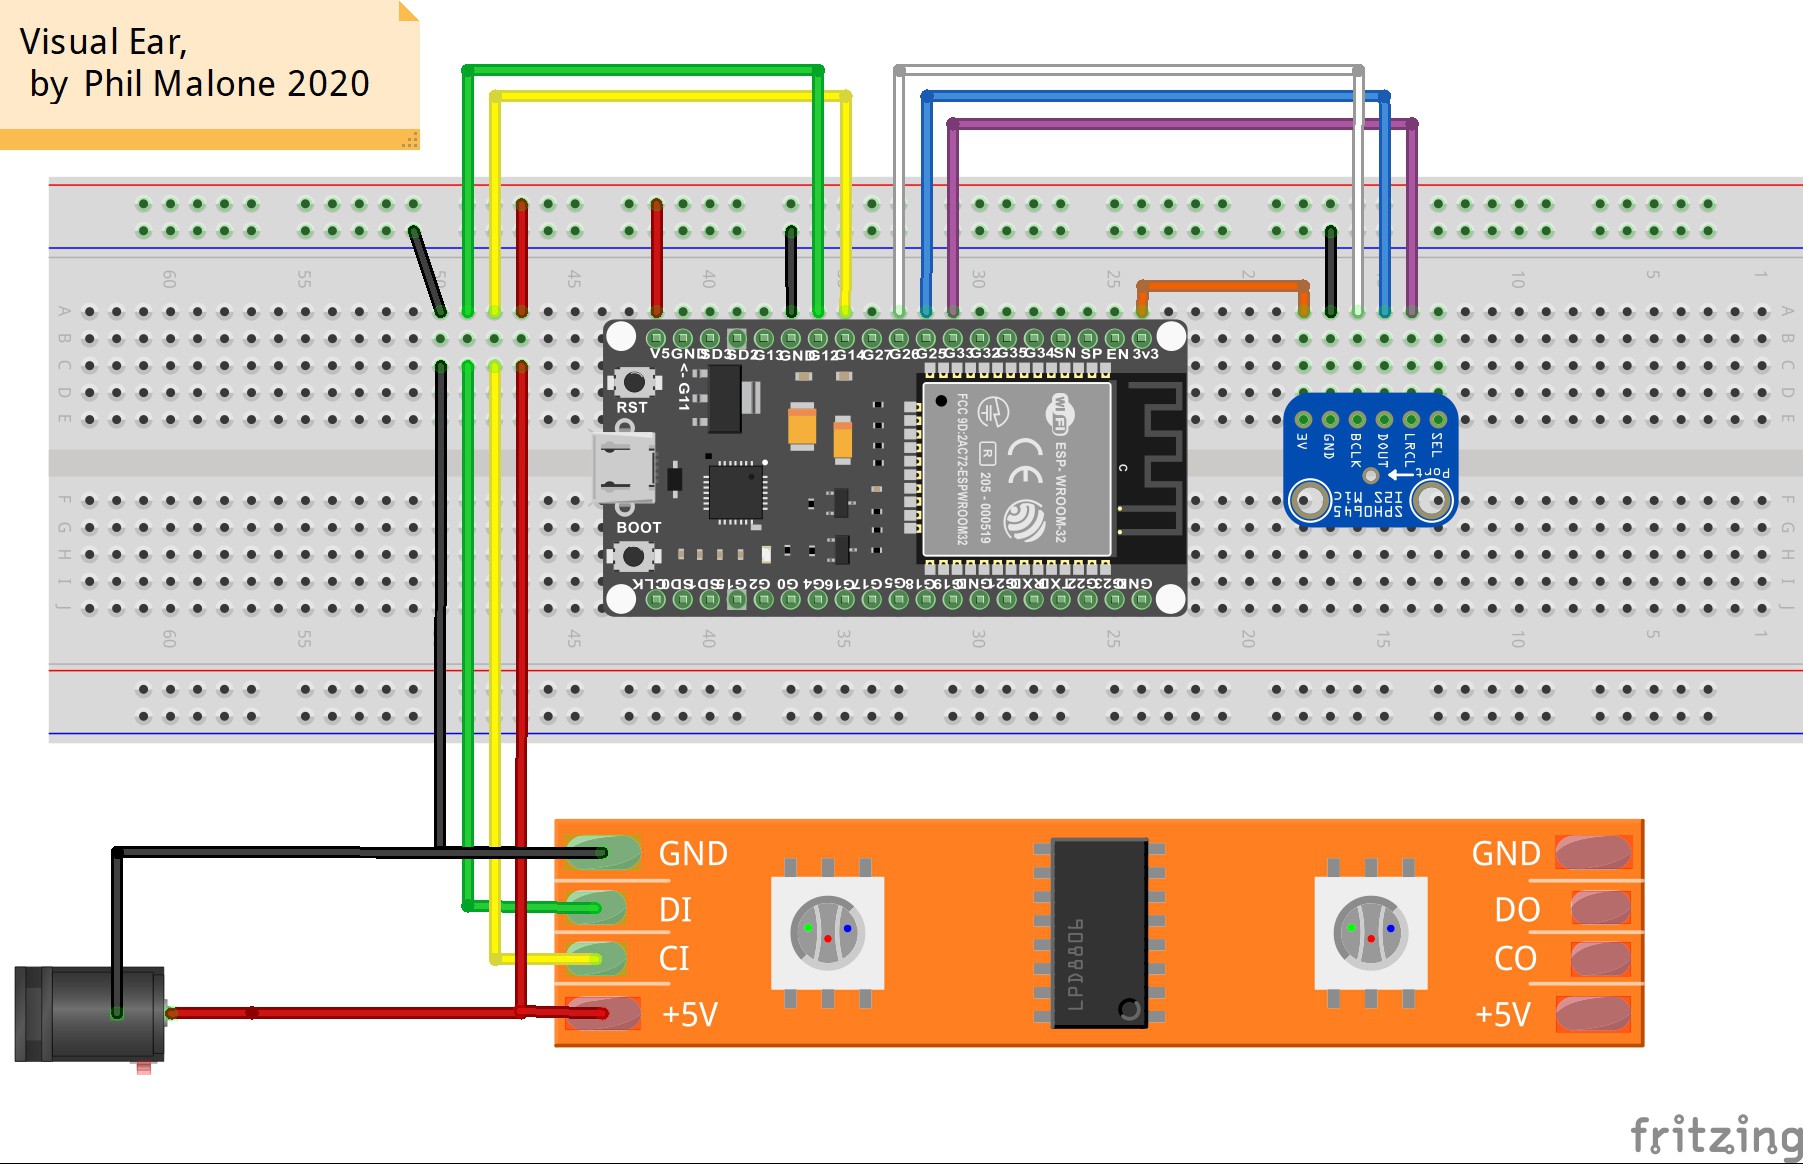
I’ve shown my basic setup in the Fritzing diagram above (this is a cool way to show my prototype setup). Note that I'm using the ESP32 Dev Kit with an I2S digital microphone and DotStar LED strip (which allows faster data clocking)
The problem:
Taken at face value, there is no way I can collect 4096 audio samples and then process them into 59 Bands and still get a reasonable display/response rate, based on my initial test data.
To get 59 discrete Bands in my desired 50-17,000 Hz range, I need at least 2048 Frequency Bins, which means I need to give the FFT twice as many audio samples at about 36K Hz. To just collect 4096 samples at 36 kHz will take 114 mSec (4096/36000). Then to run the FFT on these values would appear to require another 148 mSec. This would imply a display cycle of 262 mSec, or JUST four updates a second.
Given that my goal was to be lower than 50 mSec, this is completely unacceptable. So I had to develop some strategies for reducing these times. This is what I came up with:
Split the audio sampling and the FFT between the two cores.
Remember that the ESP has two processing cores. I’ve never used this before, but I knew that both IDEs enable you to pin tasks to specific cores. So I decided on a strategy whereby one core would be collecting audio samples while the other core was processing the previous sample. I implemented a simple semaphore between the two cores that would let them bounce between two alternating audio buffers. This approach would let me update the display after each FFT cycle without having to wait for another full audio buffer to be collected.
Speed up the FFT using lookup tables and single precision floating point.
The first thing that I noticed was that the Arduino FFT library was calculating the required FFT windowing function for every cycle. This involved trigonometric functions which were sure to be slowing down the calculation. I modified the code to run this algorithm once, during setup, and stored the weights in an array for later recall.
Next I saw that the Arduino FFT library was using double precision floating point (double) for its calculations, so I ran some tests to see if switching to single precision (float) would speed things up without affecting the output. I was pleasantly surprised to see a very large speed increase with little impact on the display.
Incremental audio Updates.
At this point I had reduced the FFT processing time down to about 16 mSec (a 9 x improvement) but my audio sampling was still slowing down the overall process. Since I could not sample faster (as it created unusable frequency Bins) and I could not collect less samples (as it produced less frequency Bins) I had to get creative. My problem was that until I have new audio data there was no point running the quicker FFT again.
My final solution to this dilemma was to sample the audio data in smaller Bursts, and then assemble them into a “sliding buffer” from the last “N” bursts. This way I could feed new data to the FFT more frequently while still having the same large number of samples. Using 4 bursts of 1024 audio samples worked well, but 8 bursts of 512 samples was even better.
I suspect sweat spot for this process is where a single burst takes about the same to collect as the FFT takes to run, that way the FFT algorithm never waiting for new data, and the latest data is extremely fresh. I’ll save this for future tweaking.
You can find the current code implementation here:
-
Log 2. Things I learned along the way.
11/22/2020 at 23:00 • 0 commentsRequired processing power:
My first concern was how long the FFT calculation was going to take. I knew that this algorithm requires floating point calculations, and also some Sine, Cosine and Square root calls. So whatever processor I chose to use would definitely need a hardware Floating Point Unit (FPU).
My initial choice was the ESP32, since I was familiar with this MCU from other projects, and it has an FPU. The ESP32 also supports both I2S and PDM inputs (for the microphone) and the FASTLED library. I was pleasantly surprised to also find an FFT library that I could use with the ESP32.
I’ve used both the Arduino IDE and ESP-IDF programming interfaces on other projets, but since this was likely going to be an open source project, I chose to use the Arduino IDE to make it a bit more “mainstream”. I found some projects using an FFT to process audio input data so I started there.
My first test was to determine how long an FFT took to run. I stared with a 1024 sample input buffer, and discovered that it took about 37 mS to run one conversion cycle. I doubled the size of the input buffer to 2048 samples, and now it clocked in at 74 mS. So I was pleased to see that the relationship between input buffer size and processing time was linear, and not exponential. Since the FFT input buffer has to be a power of 2 in size, to get more samples you need to at least double the buffer size. I was a bit concerned that there may not be “enough” processing power as I was already eating into my 50 mS latency goal.
Bins and Bands.
Next I started looking at how the results of the FFT (frequency Bins) get turned into an LED display (frequency Bands). The first thing I discovered here was that there is NOT a 1:1 ratio between Bins and Bands. It turns out that humans sense audio frequencies logarithmically. For example, in the Do, Ra, Me, Fa, Sol, La, Te, Do scale, the second Do, has twice the frequency of the first Do, and this is frequency doubling is repeated for each Octave. So after 8 octaves, the frequency is 256 times what you started out with. But with an FFT, the frequency Bins that are generated have equal frequency spacing (they increase linearly, not exponentially). To map Bins into Bands you need to figure out which bins fit into each Band. I found a great spreadsheet for doing this. I utilized a tweaked version of this spreadsheet extensively in my progression to more and more Bands.
Rules of thumb.
As I slowly increased the number of Bands in my Visual Ear, I developed some basic rules of thumb which provided the best allocation of Bins to Bands. Remember: Bins are what get generated by the FFT and Bands are what get displayed using LEDs.
- More Bins give you better Band clarity. When allocating Bins into Bands, if you don’t have enough Bins, then at the lower Band frequencies you find that there is LESS than one Bin per Band. This really doesn’t work well, because it means that several Bands will look exactly the same. At a base minimum you need at least one Bin per Band.
- Don’t sample your audio too fast or too slow. For a given audio sample rate, the resulting Bins will span from DC to ½ the sampling frequency. So you want to choose a sample rate that is just higher than 2 times your highest Band frequency. For example, if your top band is for 16 kHz, then you should sample just a bit faster than 32 kHz. If you choose a rate that is too high, there will be a bunch of unused Bins at the top of the frequency spectrum. If you choose a rate that is too low, then there won’t be any Bins that go high enough to be included in you upper bands.
- Don’t start your bottom Band too low. The frequency of your first band will define how close your first few Bands are to each other. This effects how close together your first few Bins will need to be to get good band clarity. If your Bins need to be very narrow (frequency wise) it means you will need so many more of them to reach the higher frequencies. Currently my bottom Band is set at 55 Hz. I chose this value since it is the second “A” key on the piano, which a reasonable lower limit for human hearing. If I want 7 LEDs per octave (like Piano Keys) then the second Band will be just 5.7 Hz away from the first. Choosing 55 Hz also means that the frequency of each successive octave is easily calculated (in my head), for the purpose of testing (eg: 110, 220, 440, 880 etc.). I may go lower in the future if I advance the capabilities of the microphone input and processing power.
- More Bins give you better Band clarity. When allocating Bins into Bands, if you don’t have enough Bins, then at the lower Band frequencies you find that there is LESS than one Bin per Band. This really doesn’t work well, because it means that several Bands will look exactly the same. At a base minimum you need at least one Bin per Band.
-
Log 1. System Requirements
11/22/2020 at 22:49 • 0 commentsRequirements
To begin my journey, I decided on my primary requirements:
- The VE should employ a Display Strategy that uses all possible visual cues. This includes LED a) Position, b) Color and c) Intensity.
- I want the VE to respond to ambient sounds, so I need to use a microphone.
- The VE should respond to the full human audio spectrum, so I need a high quality microphone with a flat response over as wide a range as possible.
- In order to discriminate specific sounds, I want a LOT of visible frequency Bands. If you consider the keys of a piano as discrete notes, then to be able to perceive a piano tune, you would need 88 spectral bands (covering 9 octaves).
- To be able to perceive rhythms as well as melodies, the sound-to-vision response time must be very short. I want the VE to be able to show a fast percussive beat, like a drum roll. However, at some point our eye’s “Persistence of Vision” will mask rapid visual changes, so I’d like to get as responsive as possible without going overboard.
- Since sounds levels vary wildly (many orders or magnitude) the user should be able to adjust the visual “gain” (intensity) of the display. Some means of automatic gain control may be possible and desirable.
Requirement 1: Display Strategy
To keep things simple to begin, I decided that I would utilize a single RGB LED Strip with high LED density for the display.
The LED strip would represent the human-audible spectrum range, and each LED would display one frequency band. Each LED frequency band will have a “Center Frequency” (CF) and each CF will be a constant multiplier of the previous band’s CF. This approach provides a very popular logarithmic frequency display.
Since not all LEDs would be on at any one time, the color of each LED will reinforce its position in the spectrum. The lowest frequency would be Red, and the highest frequency would be Violet. The classic rainbow ROYGBIV color spectrum would be spread across the audio spectrum.
The actual strength of each frequency band will be indicated by the brightness of the LED.
Requirement 2: The Microphone.
I’m not a big fan of analog circuitry, and I know that to get a good audio input for Analog to Digital conversion you need to make sure your pre-amplification circuitry is well designed. So to avoid that problem I researched some available digital microphones (the type you might find in a good phone). I discovered that there were two basic interface types: Inter-IC-Sound (I2S) and Pulse Density Modulation (PDM).
I2S is a serial data stream that sends a series of bits that make up a binary words that represent instantaneous sound levels. PDM is also a digital stream, but it’s more like a Pulse Width Modulation (PWM) strategy where the changing duty cycle of the stream indicates the sound level. Both methods are best performed by a processor that has a native device interface that it can use.
I found an example of each microphone type at Adafruit.com. Both were mounted on a basic breakout board for easier prototyping.
I2S: Adafruit I2S MEMS Microphone Breakout - SPH0645LM4H (PRODUCT ID: 3421)
PDM: Adafruit PDM MEMS Microphone Breakout – SPK0415HM4H (PRODUCT ID: 3492)
Requirement 3: Flat Spectral Response
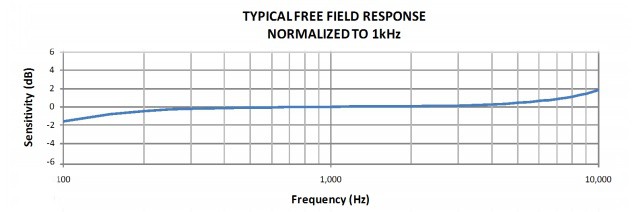
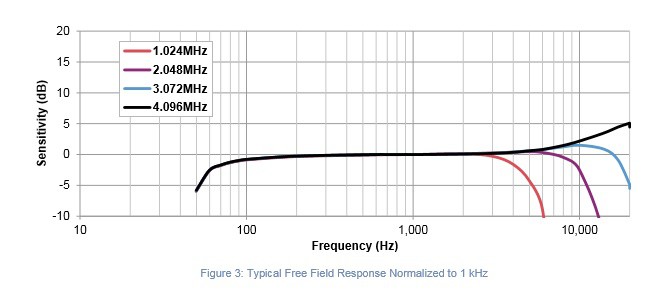
Both of the previously identified microphones show a relatively flat response (+/- 2dB) from 100Hz to 10Khz, with degraded response continuing to the 50-16kHz range. Until it’s demonstrated otherwise, these microphones will be suitable for prototype testing.
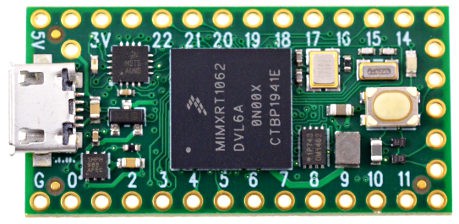
![]() I2S: - SPH0645LM4H
I2S: - SPH0645LM4H![]()
PDM: – SPK0415HM4H
Requirement 4: Many Frequency Bands
To have lots of display bands, we need a way to split the incoming audio spectrum into frequency ranges that correspond to each of the Bands. The most common numerical method for splitting an analog signal into frequency Bands is called a Fourier Transform. Since this is computationally intensive, there is a simplified method called the Fast Fourier Transform, or FFT.
The first step for performing an FFT is to sample the input waveform to produce an array of amplitude values. The number of samples in this array MUST be a whole power of 2, as in “2 raised to the power of N” where N is an integer. (for example 2 ^ 10 = 1024 samples.) These samples must be taken at a constant rate at a known “Sample Frequency”.
Once the FFT has been performed on the input set, the output will be an array of frequency “Bins” with half as many values as the original sample set. Each bin will correspond to a small range of frequencies, and the full set of Bins will span from 0 Hertz, to half the Sample Frequency.
Example: Assume a value of N = 11, and a Sample Frequency of 44 kHz. This requires 2048 samples to be collected and passed to the FFT. (This will take 46.5 mSec.) The FFT will then generate an output of 1024 frequency Bins that range from 0 Hz to 22 kHz. Since there are 1024 Bins, each bin corresponds to a fixed frequency span of 21.48 Hz (ie: 20,000 / 1024)
Unfortunately, these frequency Bins are not the same as the Bands we want the Visual Ear to display. Since display Bands increase logarithmically in frequency, they get wider and consume more of the FFT frequency Bins along the way. In fact, each octave of Bands consumes twice as many Bins as the previous octave. So if the VE display spans 9 octaves like a piano, and has 8 Bands per octave we are going to need at least 2048 frequency Bins to distribute across. And even this is an absolute theoretical minimum.
Requirement 5: Fast response times.
In order to visually perceive rapid frequency and amplitude changes, the VE needs to be able to perform three actions in quick succession. These are a) Collect the required audio samples from the microphone b) Perform the FFT processing to form frequency Bins. c) Convert Bins into Bands and display them on the LED string.
If these tree steps are performed in a classic linear fashion, then the delay (or latency) from the moment a sound occurs, to when it is finally displayed, is the sum of the processing times for a), b) and c).
As an initial starting requirement, the system should be able to display a moderate “drumroll”, which constitutes approximately 10 strikes per second. This means that the system must be able to provide at least 20 updates per second to be able to show a high and low LED brightness for each drum hit.
So, the end to end latency of the system should be 50 milliseconds (mSec) or less.
Note: Given that in the initial FFT example we calculated it would take 46 mSec to JUST sample the audio, this will present a challenge.
The Visual Ear
My goal for this project is to create a Visual version of the function performed by the Cochlear structure of the inner ear.
 Phil Malone
 I2S: - SPH0645LM4H