 Tauno Erik
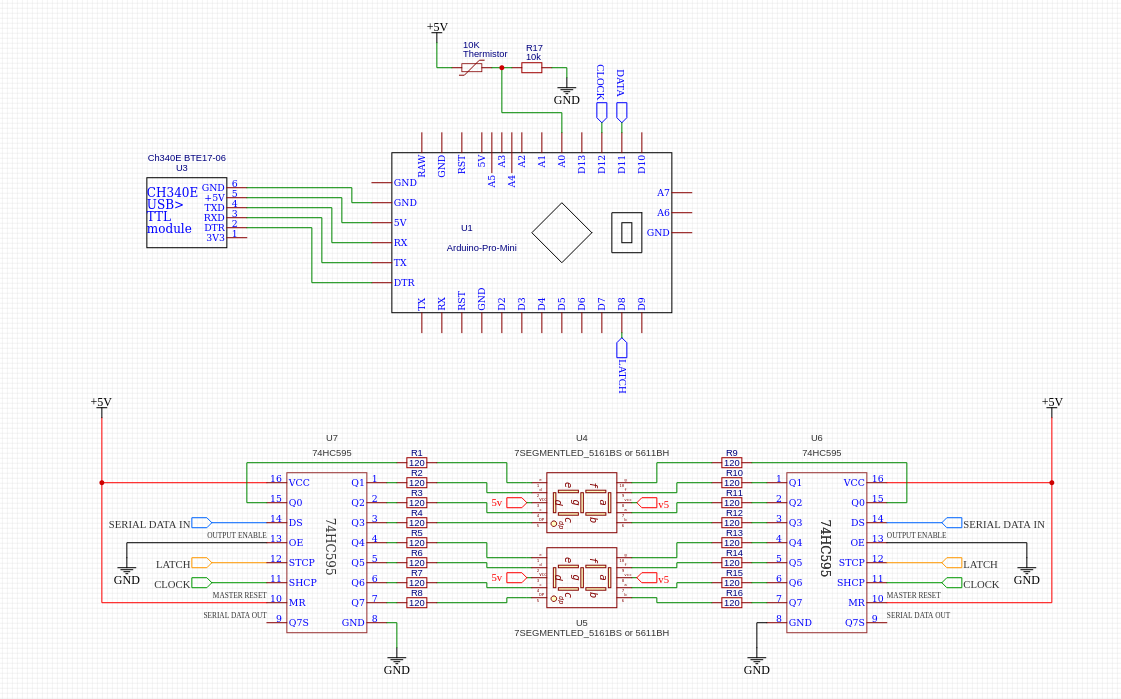
The simplest way to read serial data is to use Miniterm:
I have made one Serial Plotter to plot data:
Code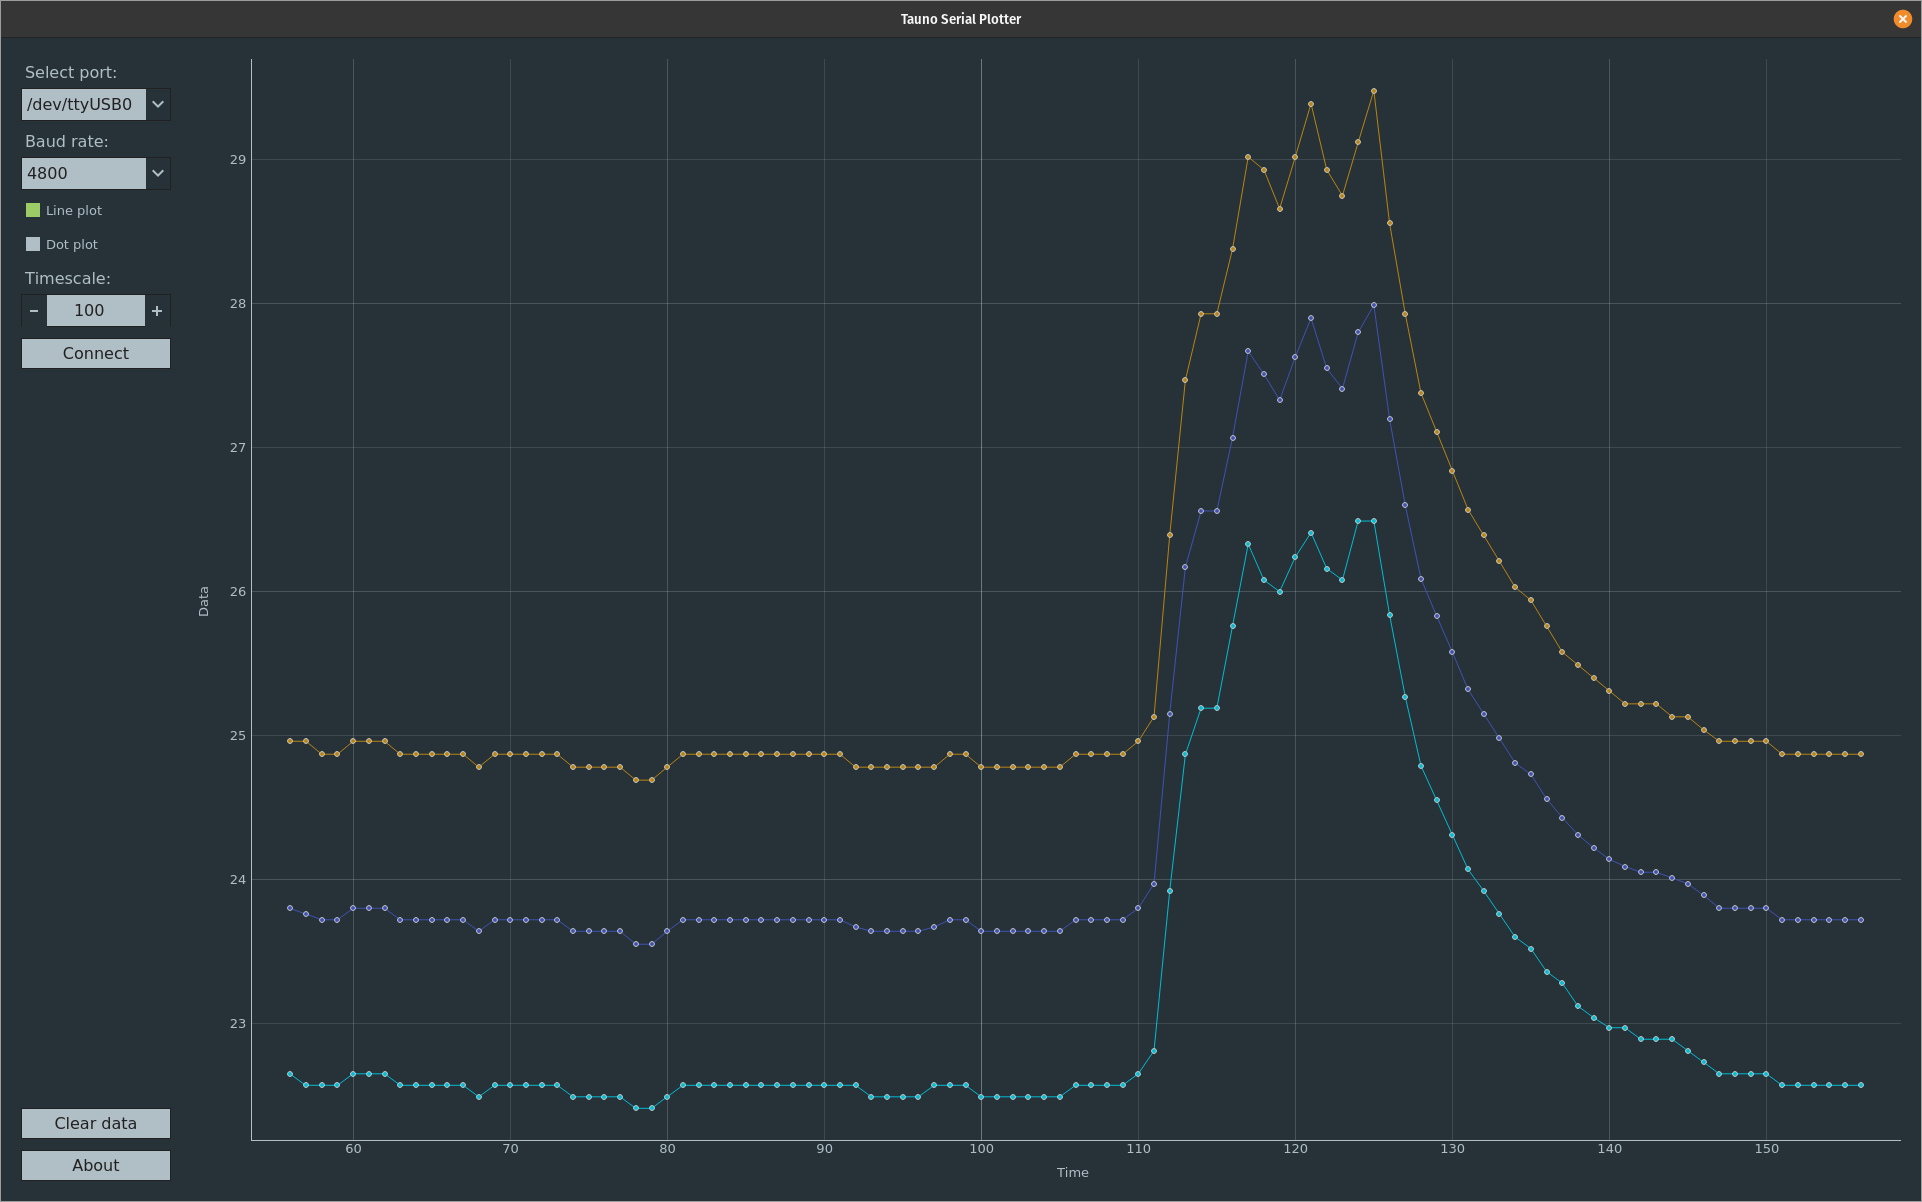 And simple Python GUI:
 Code on Github.
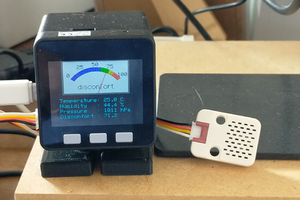
A device that measures the ambient temperature in the environment in which it is located. And displays it on the screen.
Already have an account? Log in.
To make the experience fit your profile, pick a username and tell us what interests you.
The simplest way to read serial data is to use Miniterm:
I have made one Serial Plotter to plot data:
CodeAnd simple Python GUI:

My actual sensor 10K thermistor (unknown manufacturer). is Yes, I could measure three reference points to derive the three Steinhart-Hart coefficients. Or what calibration method do you mean?
Just use an accurate thermometer as a reference. Measure three or four temperatures, see what resistance your thermistor gives for them, and interpolate the rest. I'd bet the result would be better accuracy than using Steinhart-Hart on a generic thermistor. Or maybe compare to an LM35, checked at freezing and boiling -- those are really linear.

That's neat -- from the front it appears very organic and curvy, but from the sides you get a more angular look. I like it!
 ThousanDIY
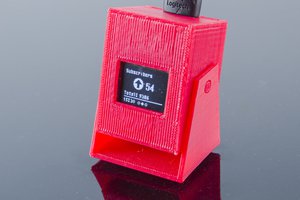
 ACROBOTIC Industries
 Leizar06001
Since the two methods give you readings a couple degrees C apart, it's not clear that simply averaging them will give a better number than either one alone (which one??).
For a limited range (around room temperature), if you want accurate readings, why not forget about Steinhart-Hart or Beta and just calibrate the thing for the actual sensors you are using?