-
Getting to grips with some real ADC readings
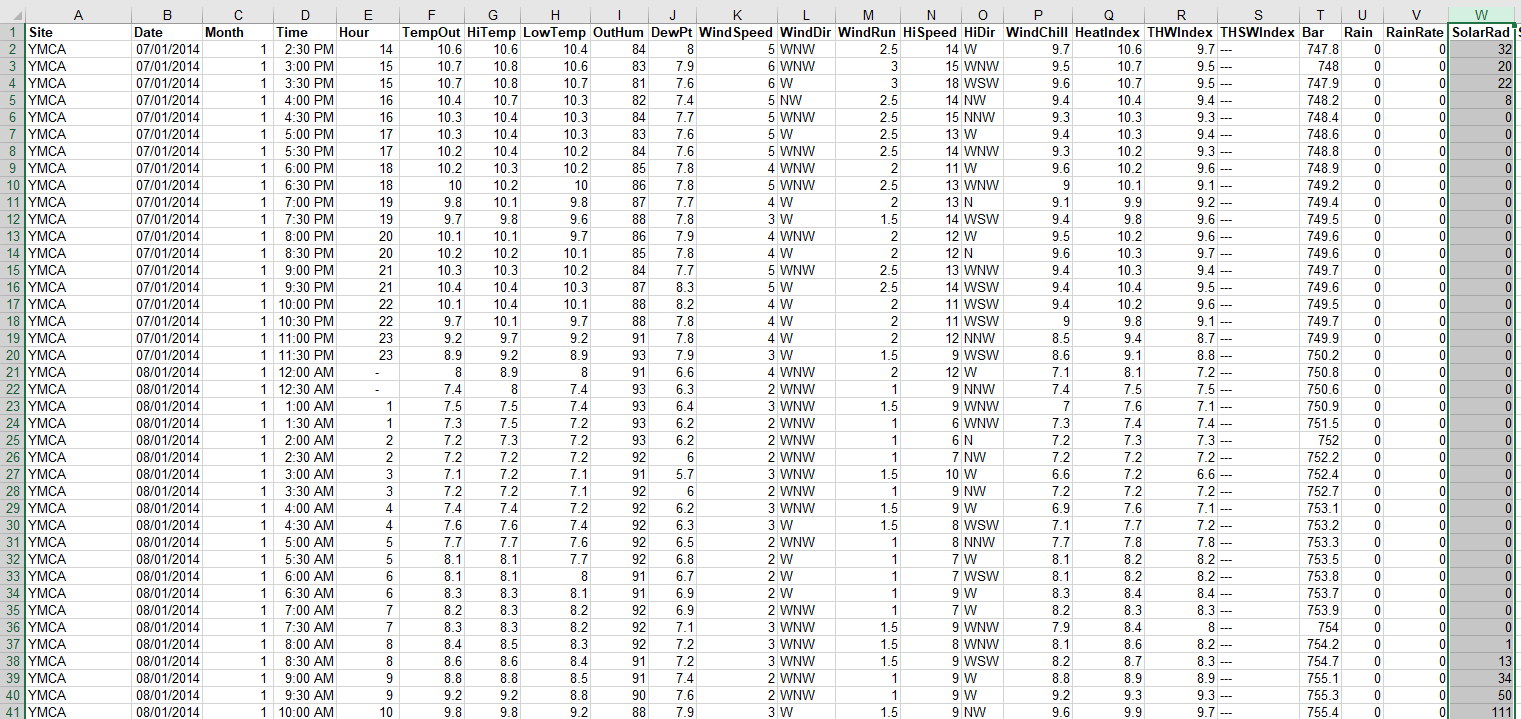
04/25/2021 at 21:31 • 0 commentsThis is a placeholder log which I promise to expand on later. For anyone keen to get their hands on the data now, please find it at: https://docs.google.com/spreadsheets/d/1h3Hqskle6RSyK4i3jdwdvxAR0Pji38RVqOuHzXzzaEc/edit?usp=sharing
Where you can find RAW 8 bit ADC readings from my Itsybitsy M4 datalogger. I have a year of readings but they are not all nicely spliced together - yet. That will come.
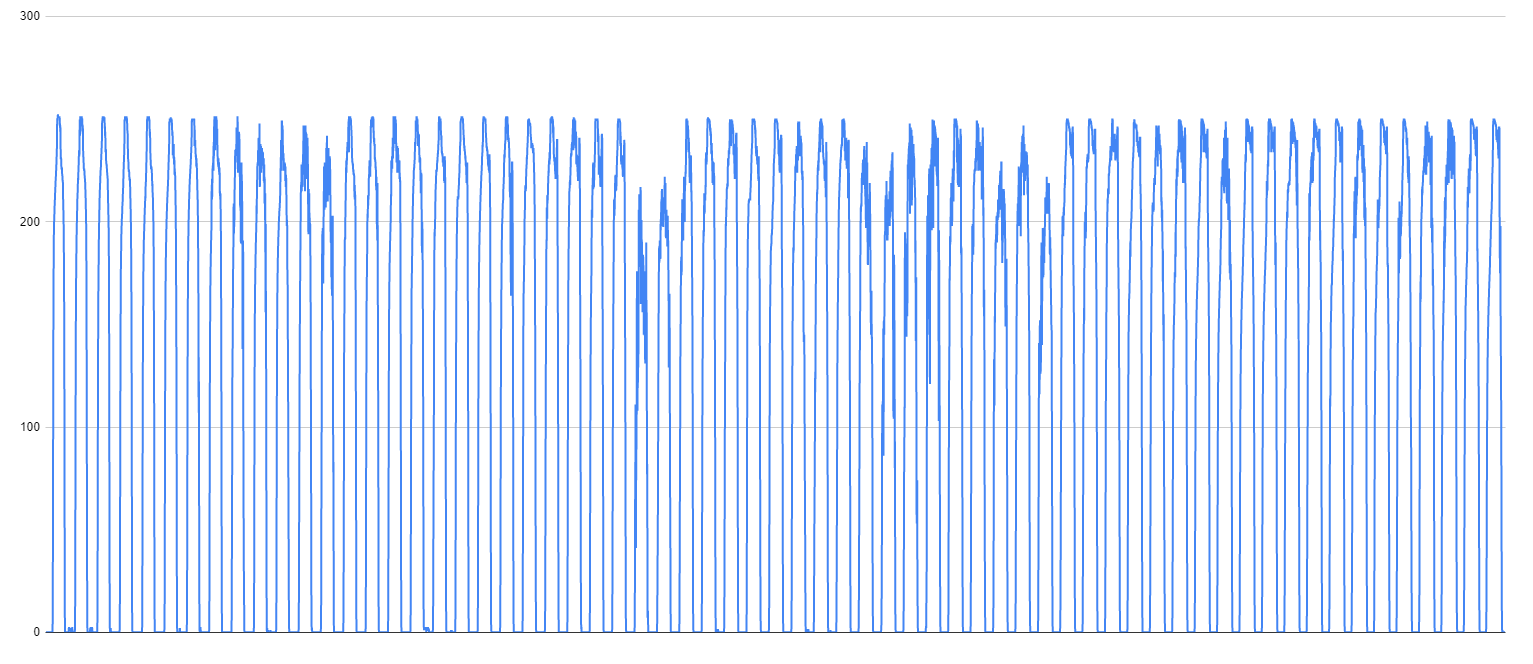
For now, you can see from this graph that we have some lovely data with the days and nights clearly differentiable:
The real world response of the LDR voltage divider turned out to be much better than the simulated ADC (well, converted from solar radiation data)!
A couple of other notable observations until I come back and expand this log:
- You can clearly see the changing length of days in the data - so the algorithm will still have to handle that.
- You can see rare measurements where we had the light on in that room after dark - and it doesn't seem to be an insurmountable outlier, which is reassuring!
Back soon to expand on this data and the implications for syncing our microcontrollers to the rotation of our planet!
-
Reading a real sensor
04/25/2021 at 17:45 • 0 commentsWhile converting to simulated LDR/ADC readings and playing round with different algorithms to find the daily period and current phase from the simulated readings is OK, it would be good to check that a real sensor and ADC would yield the same data. We need to validate the conversion from W/m2 -> ADC counts we conducted in the log Algo's First Dataset.
It has taken me several logs to set the scene, but we are finally about to log some of our own data! Almost any microcontroller has an ADC and could be used to measure a voltage divider between a fixed resistor and an LDR. However, I wanted one that would be able to store the data for me reliably and allow almost continual logging for a year. I could have used an SD card connected over SPI to record data, and perhaps I should have done that - you certainly could if you want to record your own data.
However, I had an Adafruit Itsybitsy M4 on hand and it has a nice QSPI flash memory chip onboard that plays very nicely with the Adafruit spiflash library. It is very much overkill for this application but it would be powered from a mains supply and the convenience made it worth it. I used it to make a small sketch that saves LDR readings to flash every 10 minutes, after waiting an initial period to see if you want to download data from it. If you plug it in to a PC and start a serial terminal within 20 seconds, it pauses readings and you can use a few single letter key commands to get it to print out all the readings in your serial monitor. You can also key a command to delete readings after you have copied and pasted them out of your serial terminal. If you choose to leave the readings on the flash chip, the next time the board powers up and does not detect a serial connection (ie it is expected to start logging again) it will record a "new session" line in the file record to hopefully help you keep track and not double count readings at the next download event. That said, my readings are not quite aligned/trimmed for any recording overlap so please forgive that - I do intend to clean them up.
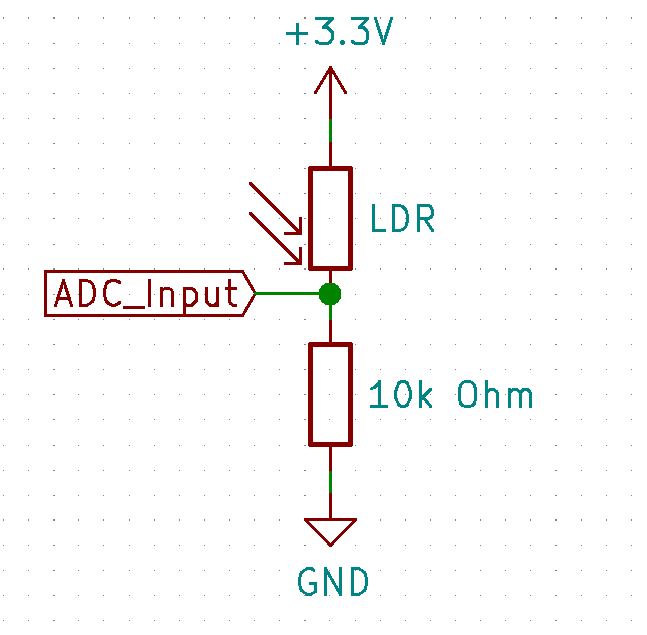
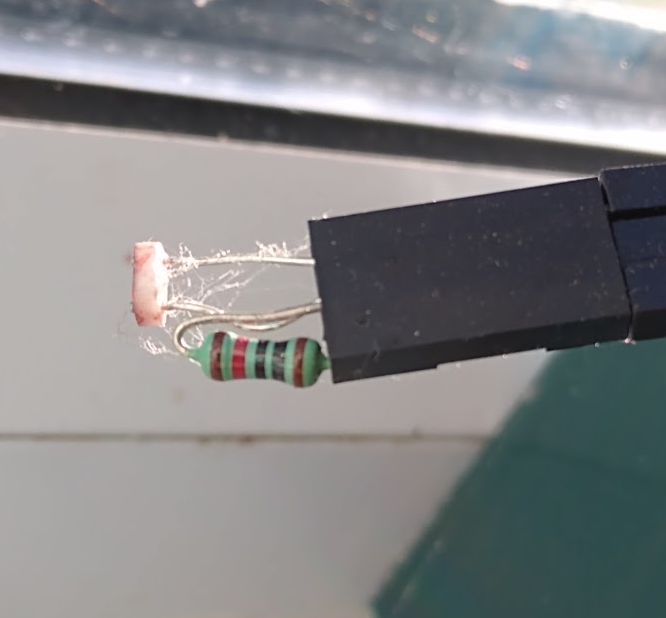
Here is the simple LDR-10k resistor divider:
And how it looks on it's sunny windowsill:
As you can see - it has all the dusty hallmarks of having been sat there for a year!
The overall setup is coarse but I will show you anyway. You do not need much to get going with dataloggin'!
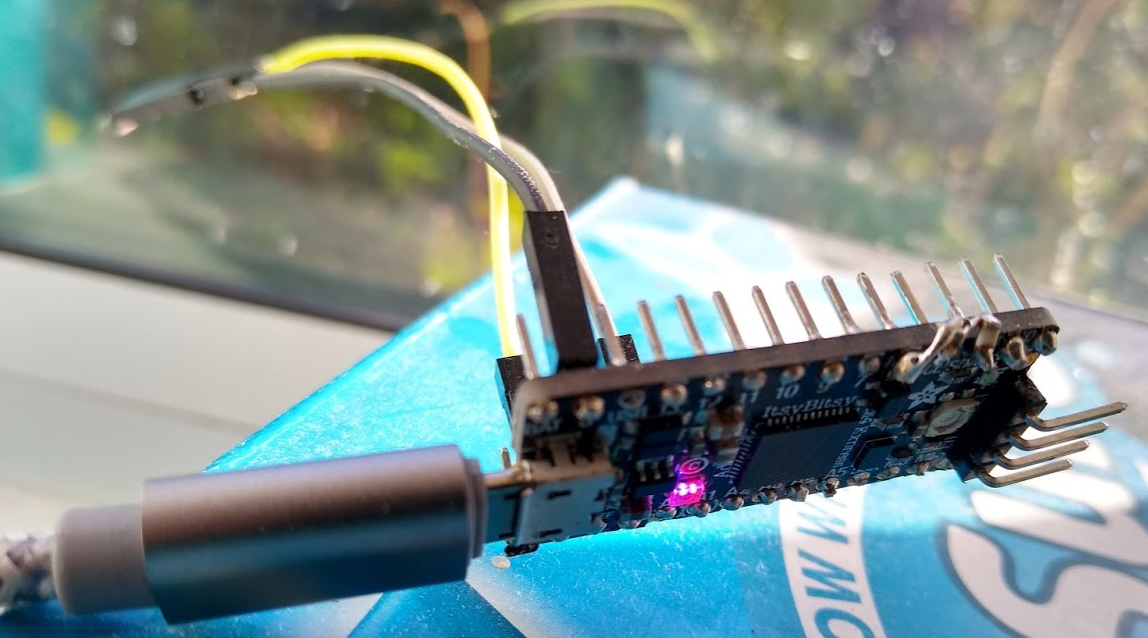
The Itsybitsy has seen better days!
I have uploaded the sketch for this datalogger in the files area for this project. Please use as-is or as a basis for your own simple light logger.
We will look at the readings this logger took over a 12 month period in a future log.
-
Looking for the dawn in simulated ADC readings
04/25/2021 at 16:08 • 0 commentsIn the previous log we looked at how I attempted to simulate the ADC readings from an LDR by taking a year of solar radiation data from a photovoltaic study, converting coarsely from W/m2 to Lux, characterising an LDR against the TSL2591 and then using that to convert to the expected ADC readings under the sun on those days recorded in the photovoltaic study.
In this log, I will show you how I started to apply filters to try and pick out data phenomenon that would be easy for a microcontroller to discern as a particular phase point in the day.
For our first graph, we're looking at W/m2 values on the left side - we are still in Excel here, not on the microcontroller. This is a plot of a week in Jan 2014 in London, with the raw readings in blue and then increasing windows over which the readings were averaged, for 3 hours, 6 hours and 12 hours.
As might be expected, averaging smooths out the double peak seen during the first day on the left side of the graph, although it introduces a phase shift and reduces the magnitude of the peaks.
You can even apply a basic threshold, such as checking the previous reading was below the last 24 hours median and this reading is over it:
But as you can see, there will be times when a dull day does not get a trigger if the day before was bright and some days apparently double trigger (probably due to bright then dark then bright again spells).
So averaging on its own is of limited use.
Next I looked at measuring the steepness and direction of the slope - is it getting brighter or dimmer? After all we are looking for things like dusk/dawn as markers of the time of day. This is effectively a measure of the curve's derivative but for a time unit of 1, we don't need to divide anything:
This is the same first week's data from the first graph - including 3, 6, 12hr averaged values - in derivative form. Nice - looks like some zero crossing we could exploit. But there is some double zero crossing for 3hr filtered values and we still have lag. Not saying something else will fix lag but we should not forget it is there.
I need to pause this log here and will return to add details and graphs of some more promising looking filters, as well show how some filters look good at one point in the year but seem not to work the whole year round.
-
Algo's first dataset
04/25/2021 at 10:47 • 0 commentsSo far in this project I have touched on the requirements, initial challenges and potential algorithms for synchronising a basic microcontroller's time to the 24 hour clock, based on daylight cycles. What I have not yet done is shown any data. And that's because, at the point in this story we have arrived at, I didn't have any....
I tried to get some data, I really did. But daylight data that you can use to test a synching algorithm with isn't quite as easy to come across as it sounds like it would be. I set myself the target of a year's worth of data, so that I could check this algorithm would work on short, dull winter days as well as it would on long bright summer ones. I trawled for open datasets of daylight readings but could not find anything which would give lux at a reasonable resolution - I considered 10 - 30 minute intervals to be a reasonable resolution so that intermittent cloud/precipitation had sufficient chance to introduce noise. And a 10+ minute wake-up interval would be reasonable for microcontrollers to perform to take light readings.
Sure, you can find out the average number of sunshine hours on a given day of the year at a given meteorological location, but I came up short for actual readings with all the noise and variability that a real system would have to dredge through to find the signal. By the way, I was focused on UK so if you have that data for other places, please link it in the comments here - hopefully it will help someone, if not me.
What to do?
Getting slightly desperate, I wondered if solar photovoltaic power production could be used as a proxy for light readings. I found that people were much keener to write and publish reports with supporting data on photovoltaic domestic electricity generation than they were about general light levels. And so it was I ended up downloading a dataset of insolation (solar radiation power) at half hourly intervals from a study of domestic photovoltaic installations in the UK (London) in 2014. Here is a link to the source: https://data.london.gov.uk/dataset/timeline/photovoltaic--pv--solar-panel-energy-generation-data
What I like about this is that it gives solar radiation in W/m2 - great stuff. However, I needed to approximate ADC readings from this - ie what an LDR voltage divider would produce as a response to these power (power density?) levels. I could not think of a good way to approximate from W/m2 -> 10 bit ADC counts from a non-linear sensor like a CdS LDR voltage divider, so I took an intermediate step (read - rabbit hole) and attempted to convert W/m2 to Lux before approximating Lux to ADC counts.
Converting to Lux
There is a not a straightforward conversion factor - ie linear proportional relationship - between W/m2 and Lux. However, I settled upon using one for my first run at this. I apologise that I cannot provide the source after a year has passed but I used 0.0079 W/m2 per Lux.
Once I had W/m2 in terms of Lux, I needed to know what my LDR voltage divider "would have been" reading if it had been out in the sun at the YMCA in London in 2014!
Converting to Volts
The best light sensor I had access to at the time was the TSL2591. To put it mildly, this is not the simplest sensor to derive a reliable Lux reading from. You will see much discussion on the Adafruit library repo issue about how to get a reliable Lux reading from it.
I decided to take matters into my own hands and characterised the TSL2591 sensor against formal photometric standards : https://github.com/SimonMerrett/TSL2591_characteristics
Essentially we are trying to take the datasheet's sensor characteristics and map the sensor's response to known brightness values. I used the awesome https://automeris.io/WebPlotDigitizer/index.html to perform this conversion of datasheet curves. Big thanks to @Jenny List for her https://hackaday.com/2016/05/12/digitize-your-graphs-with-webplotdigitizer/ article bringing this wonderful tool to my attention.
This is a plot of the TSL2591's two channel readings against a known optical standard.
Please bear with me while I do a bit of hand-waving here. I promise I will return and add more detail if there is enough interest but it has been a year since I moved on from this particular rabbit hole and I will have to jolt some grey matter into recalling the full details for reproducibility.
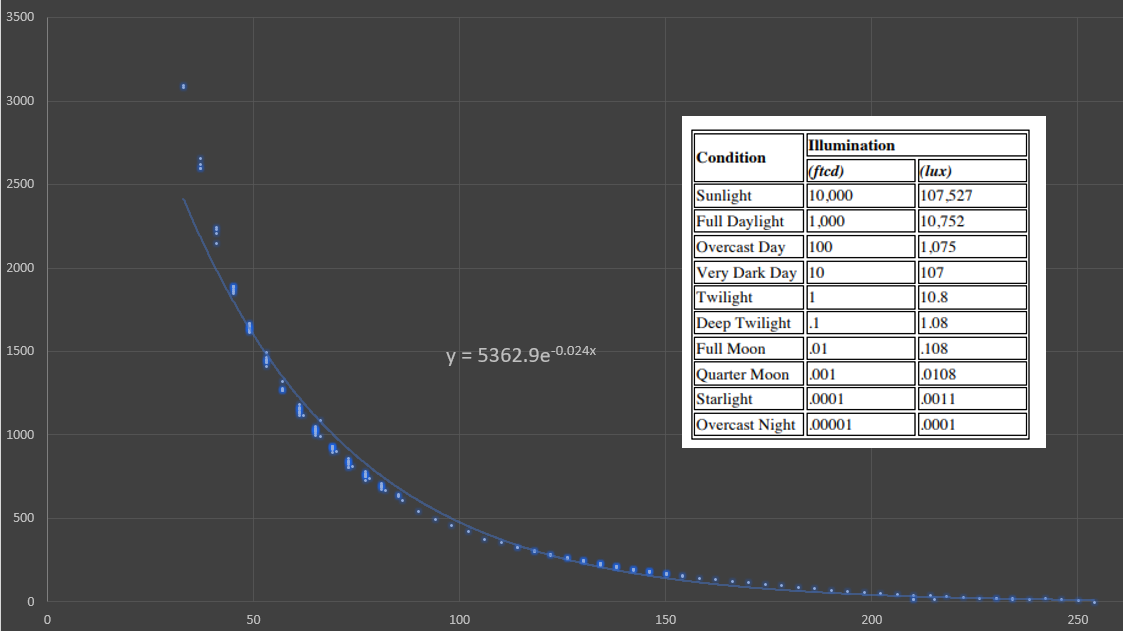
So knowing the TSL2591's response to daylight, I connected the LDR voltage divider and the TSL2591 to an Arduino and made concurrent readings for a range of light levels. This allowed me to produce a relationship graph between TSL2591-based-Lux and LDR ADC readings (divided to 8 bit range):
The logarithmic best fit curve kindly provided by MS Excel then allowed me to convert Lux readings from the solar power density readings in the dataset to notional 8 bit ADC readings - Hooray!
The reason why 8 bits was to make storing many readings in a byte array doable within flash memory of a small microcontroller.
That concludes the introduction and initial processing of the first dataset - next time we will start looking for patterns that may tell us the time!
-
Kalman filters are overkill?
04/24/2021 at 18:50 • 0 commentsI saved this for a separate log because I would like to return to this topic once I have brought the rest of the project up to date.
Kalman filters are well known and regarded for their ability to quickly adapt state estimations (ie the filter output) to legitimate signal, amongst noise. I had been wondering about this for some time when I posted a .stack entry to solicit input from the community over a year ago:
For now, I will leave you with that exchange of thoughts and promise that I will return to the topic - when I do, any further wisdom from you in the comments here would be most welcome!
-
What options are there for synchronising a clock with sensor data?
04/24/2021 at 11:21 • 5 commentsOnce I had decided I wanted to synchronise my microcontroller with daylight levels as a proxy for the 24 hour clock, I needed to find a technique to get from sensor readings to a time of day.
Initially, this may seem like a problem of frequency measurement - we just need to measure how many microcontroller "periods", such as wake ups / timeouts / timer interrupts occur in a single cycle of daylight. But it is not quite that easy and I'll come back to this.
Pattern matching for basic microcontrollers
Before I get back to the main story, I want to cover some of the interesting "dead ends" I found while doing my initial searches for techniques to synchronise my data, which I anticipated would have clear periodic trends, using a microcontroller. If you are doing something similar or slightly different, this may be of interest.
Firstly, I looked for frequency detection/measurement on basic microcontrollers (by which I mean something like the ATMEGA328P would be a typical example). Loads of audio applications want to do something like this for instrument tuning or spectrum analyser and cool visual effects to accompany the music. Here are the sort of progressions you may find useful:
- Some kind of "basic" (not to take anything away from the achievement but just in terms of algorithmic complexity) peak detection, zero-crossing or non-zero-crossing technique, as masterfully demonstrated by Amanda Ghassaei in her instructible on the topic. https://www.instructables.com/Arduino-Frequency-Detection/
- Fast Fourier Transforms, to identify the "strongest" frequency component in a compound waveform (yes, I know, the are pretty much all compound!), and I like the blog post by Arik Yavilevich on his exploration and success in this area. https://blog.yavilevich.com/2016/08/arduino-sound-level-meter-and-spectrum-analyzer/
- Finally, and most promisingly, we have autocorrelation. This technique doesn't care about how many zeros you do or don't cross, what kinds of spectral composition you bring to the data but it only cares about repetition - that sounds good, right? Akellyirl has a great instructible with links and theory and library content on this. I highly recommend https://www.instructables.com/Reliable-Frequency-Detection-Using-DSP-Techniques/
But none of those seemed quite right when I dug deeper into dayTime.
The first issue is that we are not just measuring frequency of the daily light cycle. We want to synchronise, or lock-in to the phase of the cycle too. So this is one task or feature we need. The frequency detection didn't do this out of the box and the FFT did not do this at all. Autocorrelation and frequency detection might have been able to to phase lock with some more work.
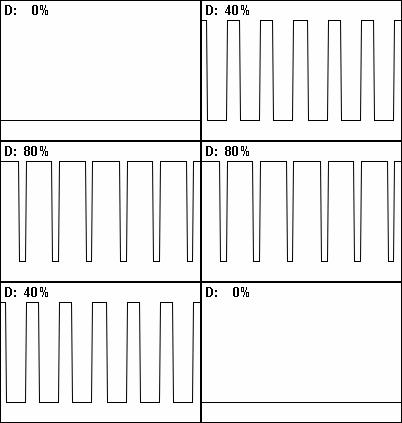
The second challenge is that our readings are not going to produce nice regular patterns. This is obvious from the fact that we get dull and bright periods within each day (noise) and that the overall proportion of daylight in a 24 hour period varies from winter to summer in most parts of the world (seasonal). It is akin to a varying pulse width modulation duty, where the duty represents the hours of daylight and the fixed frequency represents our 24 hours:
![]()
Source: By Eighthave, modified by Teslaton - Modification of Image:Pwm duty cycle.gif, Public Domain, https://commons.wikimedia.org/w/index.php?curid=3674466
With wildly varying levels of light (large dynamic range) between winter/summer and within clear and stormy days, none of the options above looked like they would reliably identify daily periods and phase points.
Looking for something which would provide a phase locked loop, I found the wonderful #Software Phase Locked Loop project by @agp.cooper . Although I did not go through with a build based on this, I learned a great deal and would recommend you check out this project. Top tip: another helpful search term for you - "product detector" might be something you want for fast locking/correlation.
As I was researching all this, I learned that was I was really doing was "Time Series Analysis", which you may find a useful search term if you are doing something similar. I mean, if you just want an audio VU meter, you might not think to delve into Time Series Analysis. But it might be helpful.
Time series analysis has varied applications in data science so some of the web content can feel a little mathematical (because it is!) but some sites boil the main concepts down really well. I like https://www.aptech.com/blog/introduction-to-the-fundamentals-of-time-series-data-and-analysis/ because they give you a simple graph to explain each concept or term in a clear way.
For #dayTime , we are expecting noise / randomness in the brightness on the sensor at any particular time of reading and a degree of measurement noise within the sensor electronics. We are also expecting daily cycling of sensor values (seasonal) and annual changes in daylight hours (also seasonal but on a different timescale). We are not expecting a trend - ie we are hoping that days remain 24 hours long! But I suppose we should be open to the possibility of the microcontroller oscillator aging to the extent that it counts fewer or more "microcontroller periods" per 24 hour period.
But I'm getting ahead of myself - what data was I using to evaluate the techniques I considered above?
-
What's the problem with microcontroller time-keeping?
04/24/2021 at 01:29 • 0 commentsLow cost microcontrollers rarely have good enough built-in timekeeping clocks/oscillators/peripherals to keep a system within a few hours after many months in the field. You often find comparisons of the clock drift for a given microcontroller. Discussion will be about how many parts per million accuracy the clock/oscillator has.
The bottom line is that whether you use an internal clock, an external ceramic resonator or an external crystal, the accuracy is not going to work for this. For example, in Jeremy Cook's simple and clear explainer, a standard Arduino UNO would drift by up to 7 minutes per day. After a month we could be well out of the "few hours" I would have liked to keep within*. There is more to clock accuracy, and you can make some educated guesses to minimise the effect of drift if you keep track of temperature and maybe supply voltage but it won't improve the accuracy by the orders of magnitude I am looking for.
Even if those sources were accurate enough, there would not be an easy way to sync them to the time of day (waterproof enclosures, no buttons etc). That said, you could "prime" a technique like dayTime by ensuring that power was only applied within a certain window of time within a day. That would seed the system with a "certainty head-start" but nothing that wouldn't be negligible after a day or few.
Just to quickly justify why GPS wasn't considered: unit cost and power budget. My devices often have to sleep for long periods, and I expect many of your dataloggers or sensor nodes have to do the same. This brings me to the conclusion of "What's the problem with microcontroller time-keeping?"; if you thought main clocks were poor time keepers after reading the above, wait until you see the specs for the low speed oscillators the sleep modes rely on...
* Please don't ask - I can't really say what the application was. Suffice to say that the project went ahead without dayTime built in and the idea has outlived the project which conceived it!
 Simon Merrett



 This is a plot of the TSL2591's two channel readings against a known optical standard.