Kevin Arne
-
Spoke Too Soon: Dirty Data Dump
08/26/2021 at 19:07 • 0 commentsThe Platform Wasn't the Problem
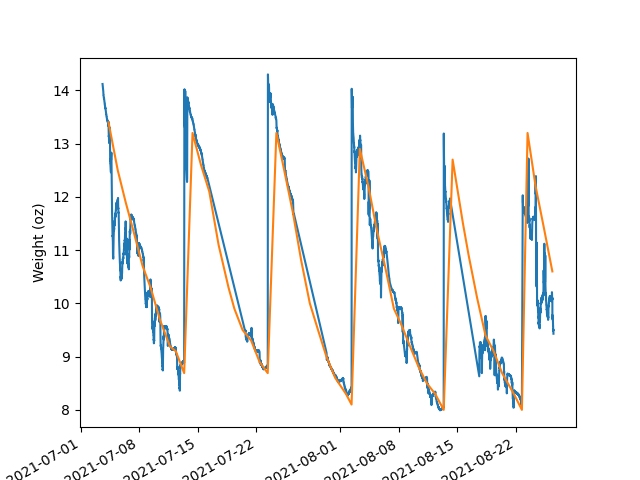
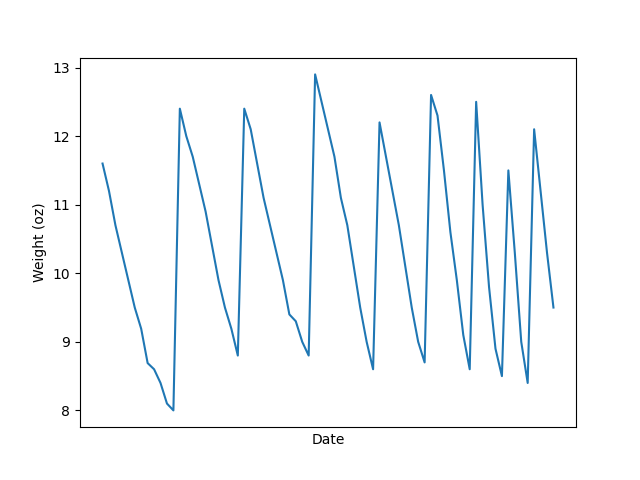
Turns out the platform wasn't the cause of the wobbliness of the data. It has continued and arguably gotten worse.
![]()
Just look how awful that last week is! It looks like there's almost a periodic quality to the wobbliness.
Here's what I'm going to do:
- Poll the sensor a few times in rapid succession and average the results.
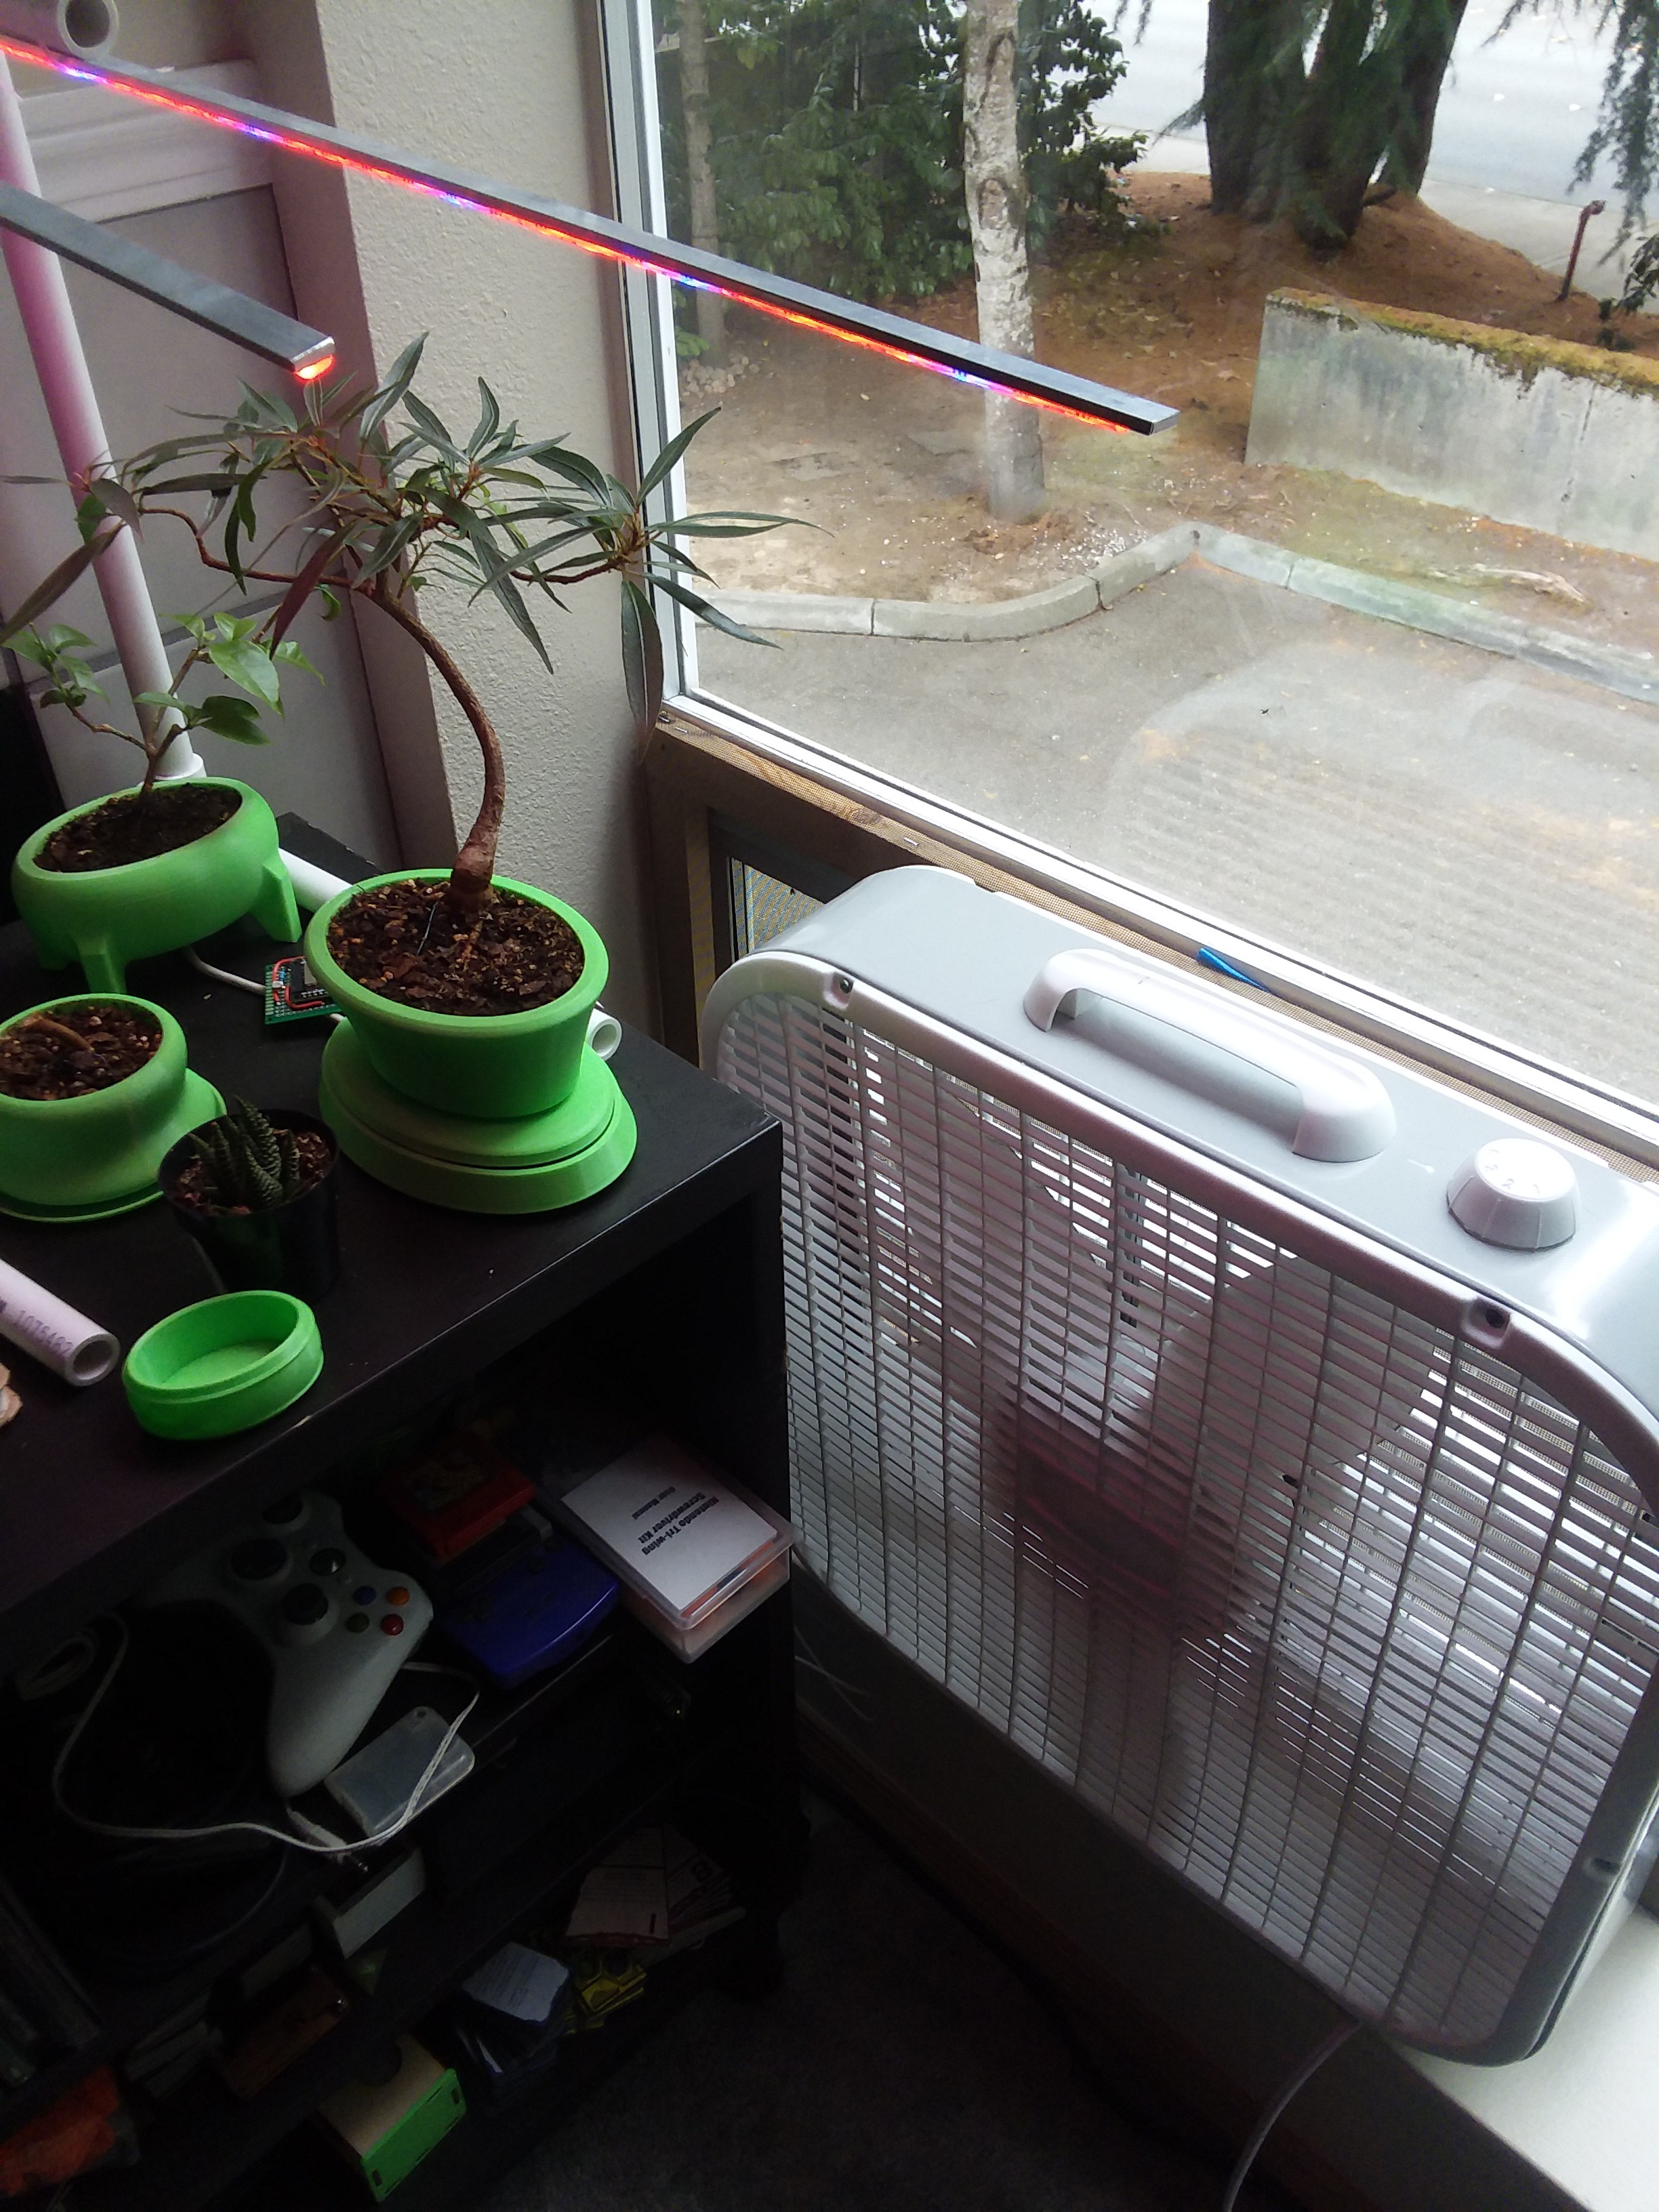
- Remove the big box fan right next to the setup.
- Hope really hard that one of those works.
![]()
Could this fan be the issue? Sharing Data
I'm sharing the data that went into this graph in the cleverly-named "data.zip" file found on the main project page. It contains two files: auto.csv and manual.csv. Each contains datetime iso strings (created using datetime.isoformat() in Python) and corresponding values in ounces.
Current problems with the data:
- The early manual weight data didn't capture the time, but I can tell you that it was usually the morning, around 9 am.
- There are large swaths of time in the automatically-recorded data where there's no data. I didn't realize the sensor was down (seems to go down regularly, need to figure out why). Now I have a script that checks whether the sensors are reporting properly and emails me if they aren't.
- Every time the automated sensor goes down, taring is the first step on boot. The next code revision will store one tare weight so this won't get regularly reset.
- Over the course of this time period, I pruned both the roots and the shoots. I'm not sure when that happened, but it should obviously affect the weight.
-
Finally Collecting Data
07/05/2021 at 03:34 • 0 commentsMaking Progress
While investigating ready-made boards for reading load cells, I stumbled across the HX711 load cell amplifier. The HX711 has 24 bits(!!) of resolution instead of the paltry 12 from the ADC I was using.
Sparkfun has a great intro to load cells (link here) complete with some example code. The code fit nicely in a sketch I wrote to send data to a database via HTTP processed by a PHP script server-side.
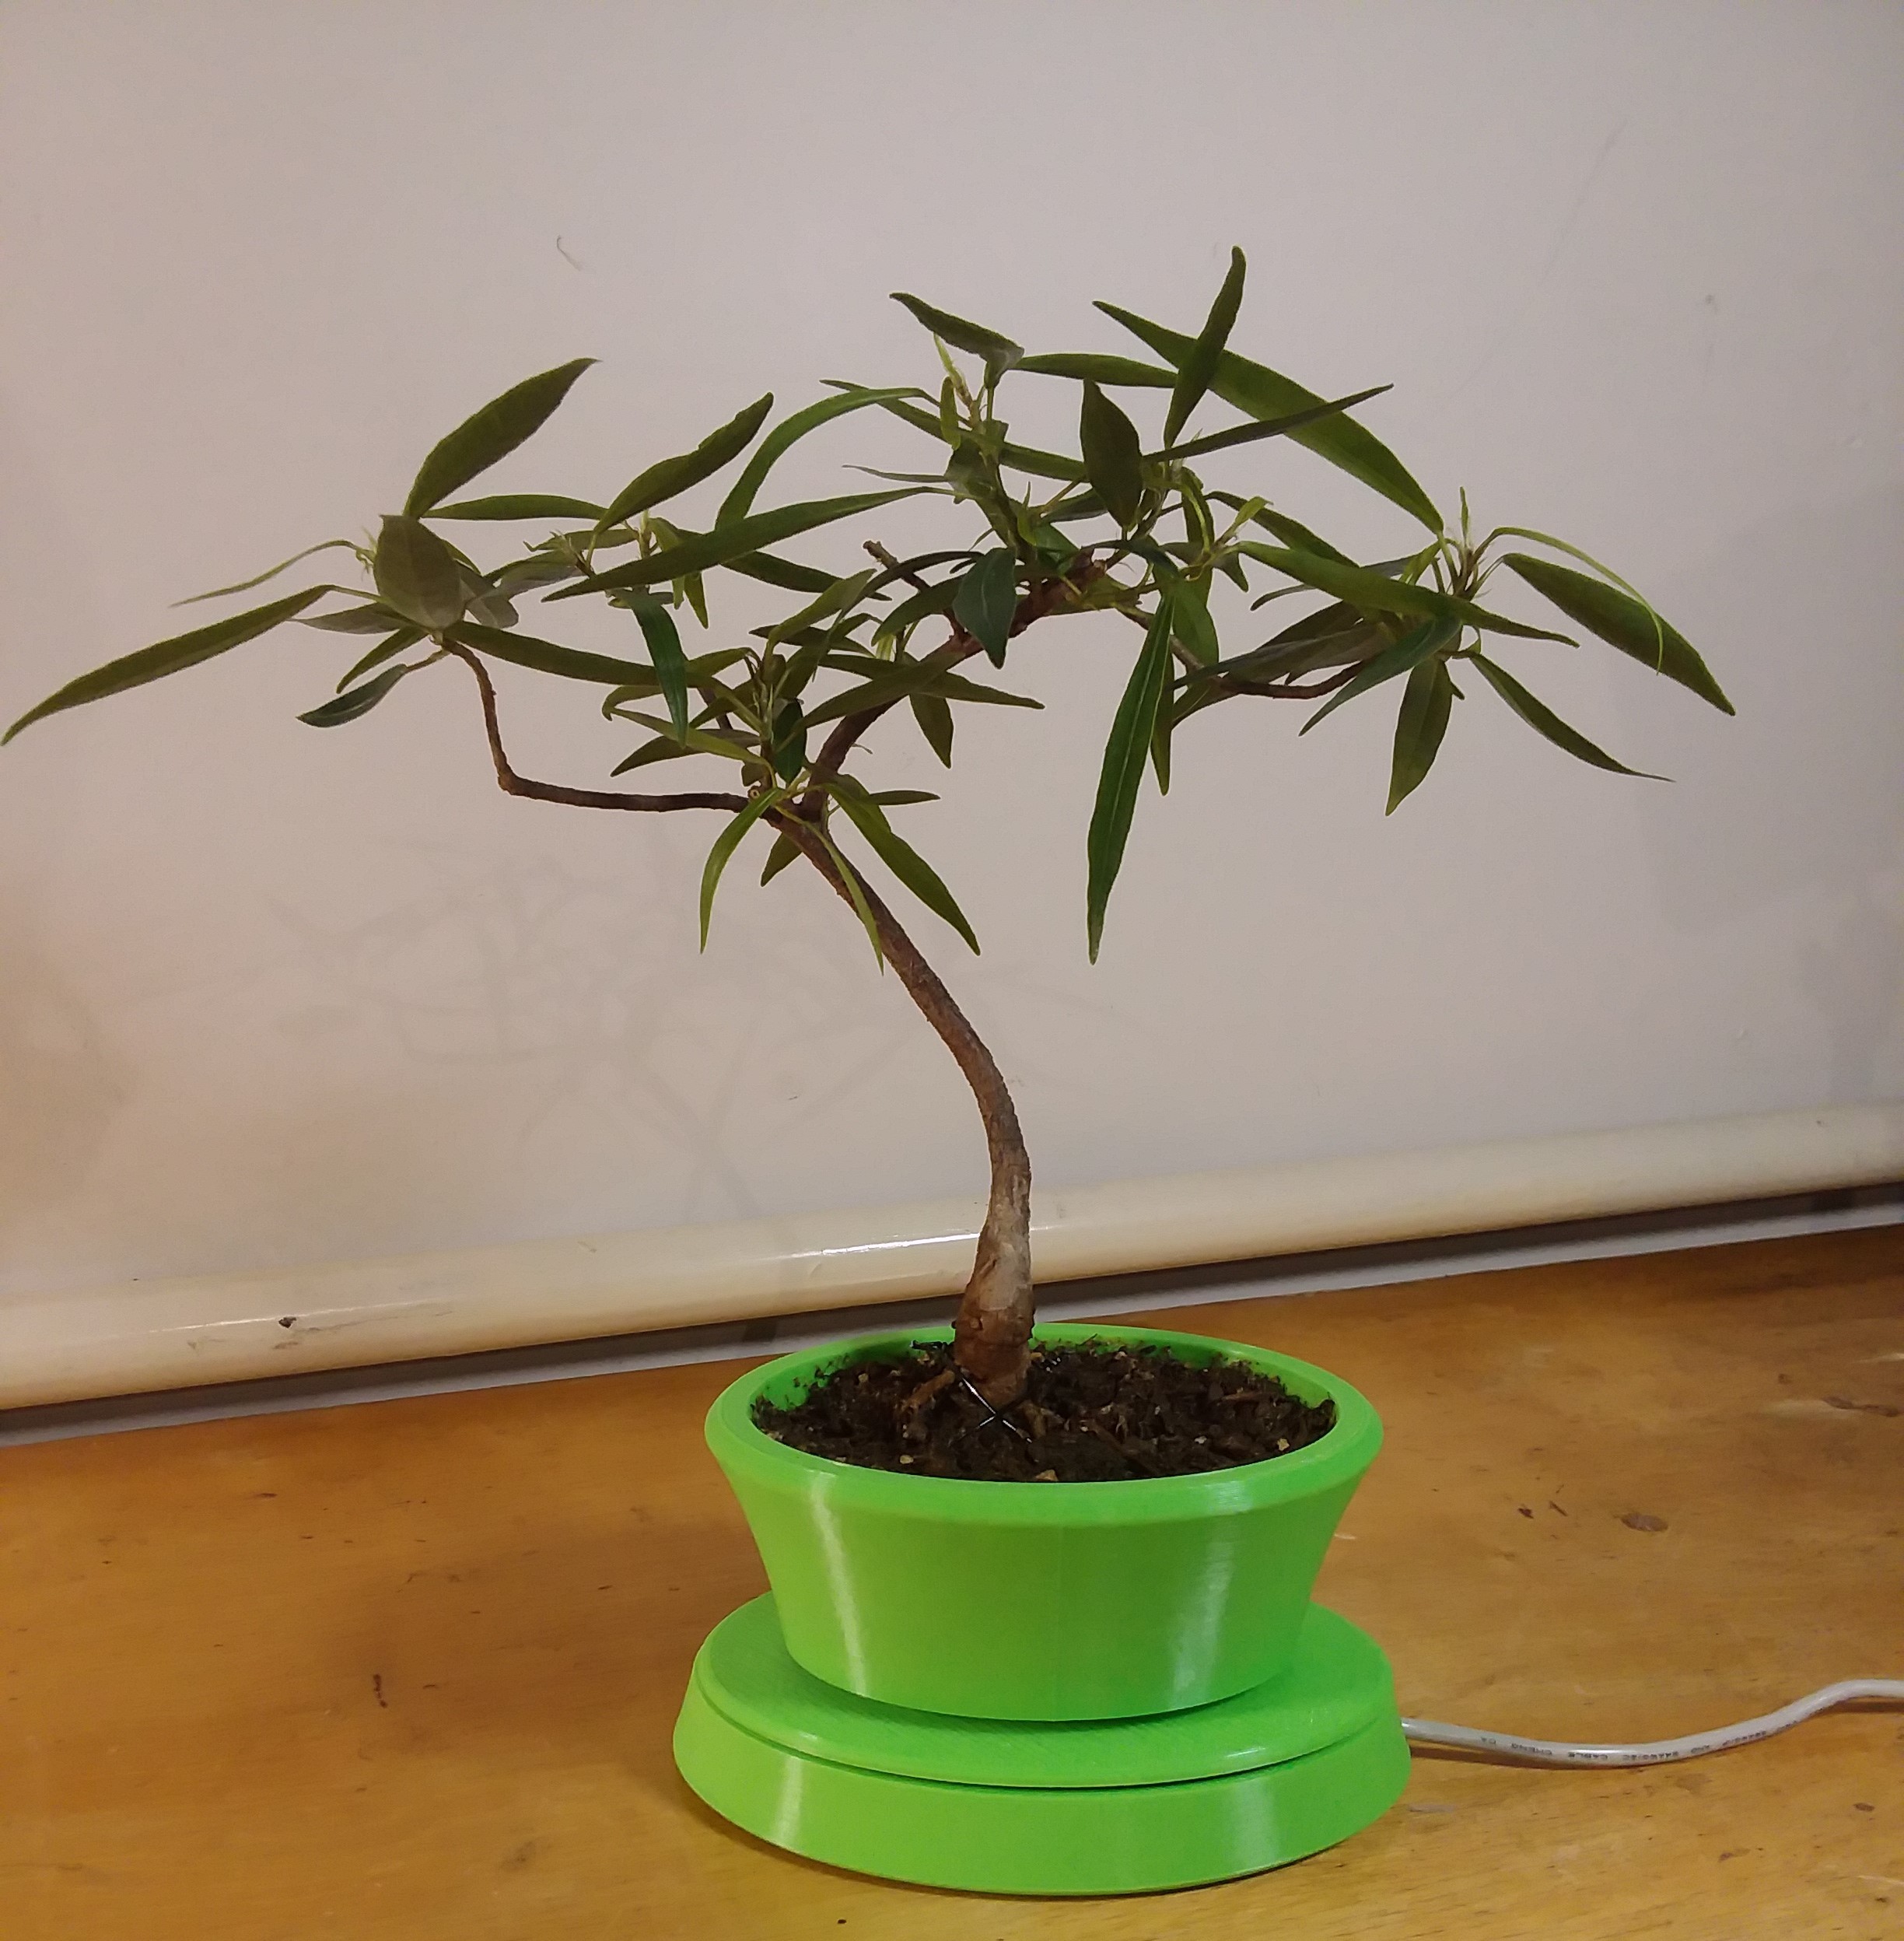
I designed and 3D printed a base with the load cell to match my planter.
![]()
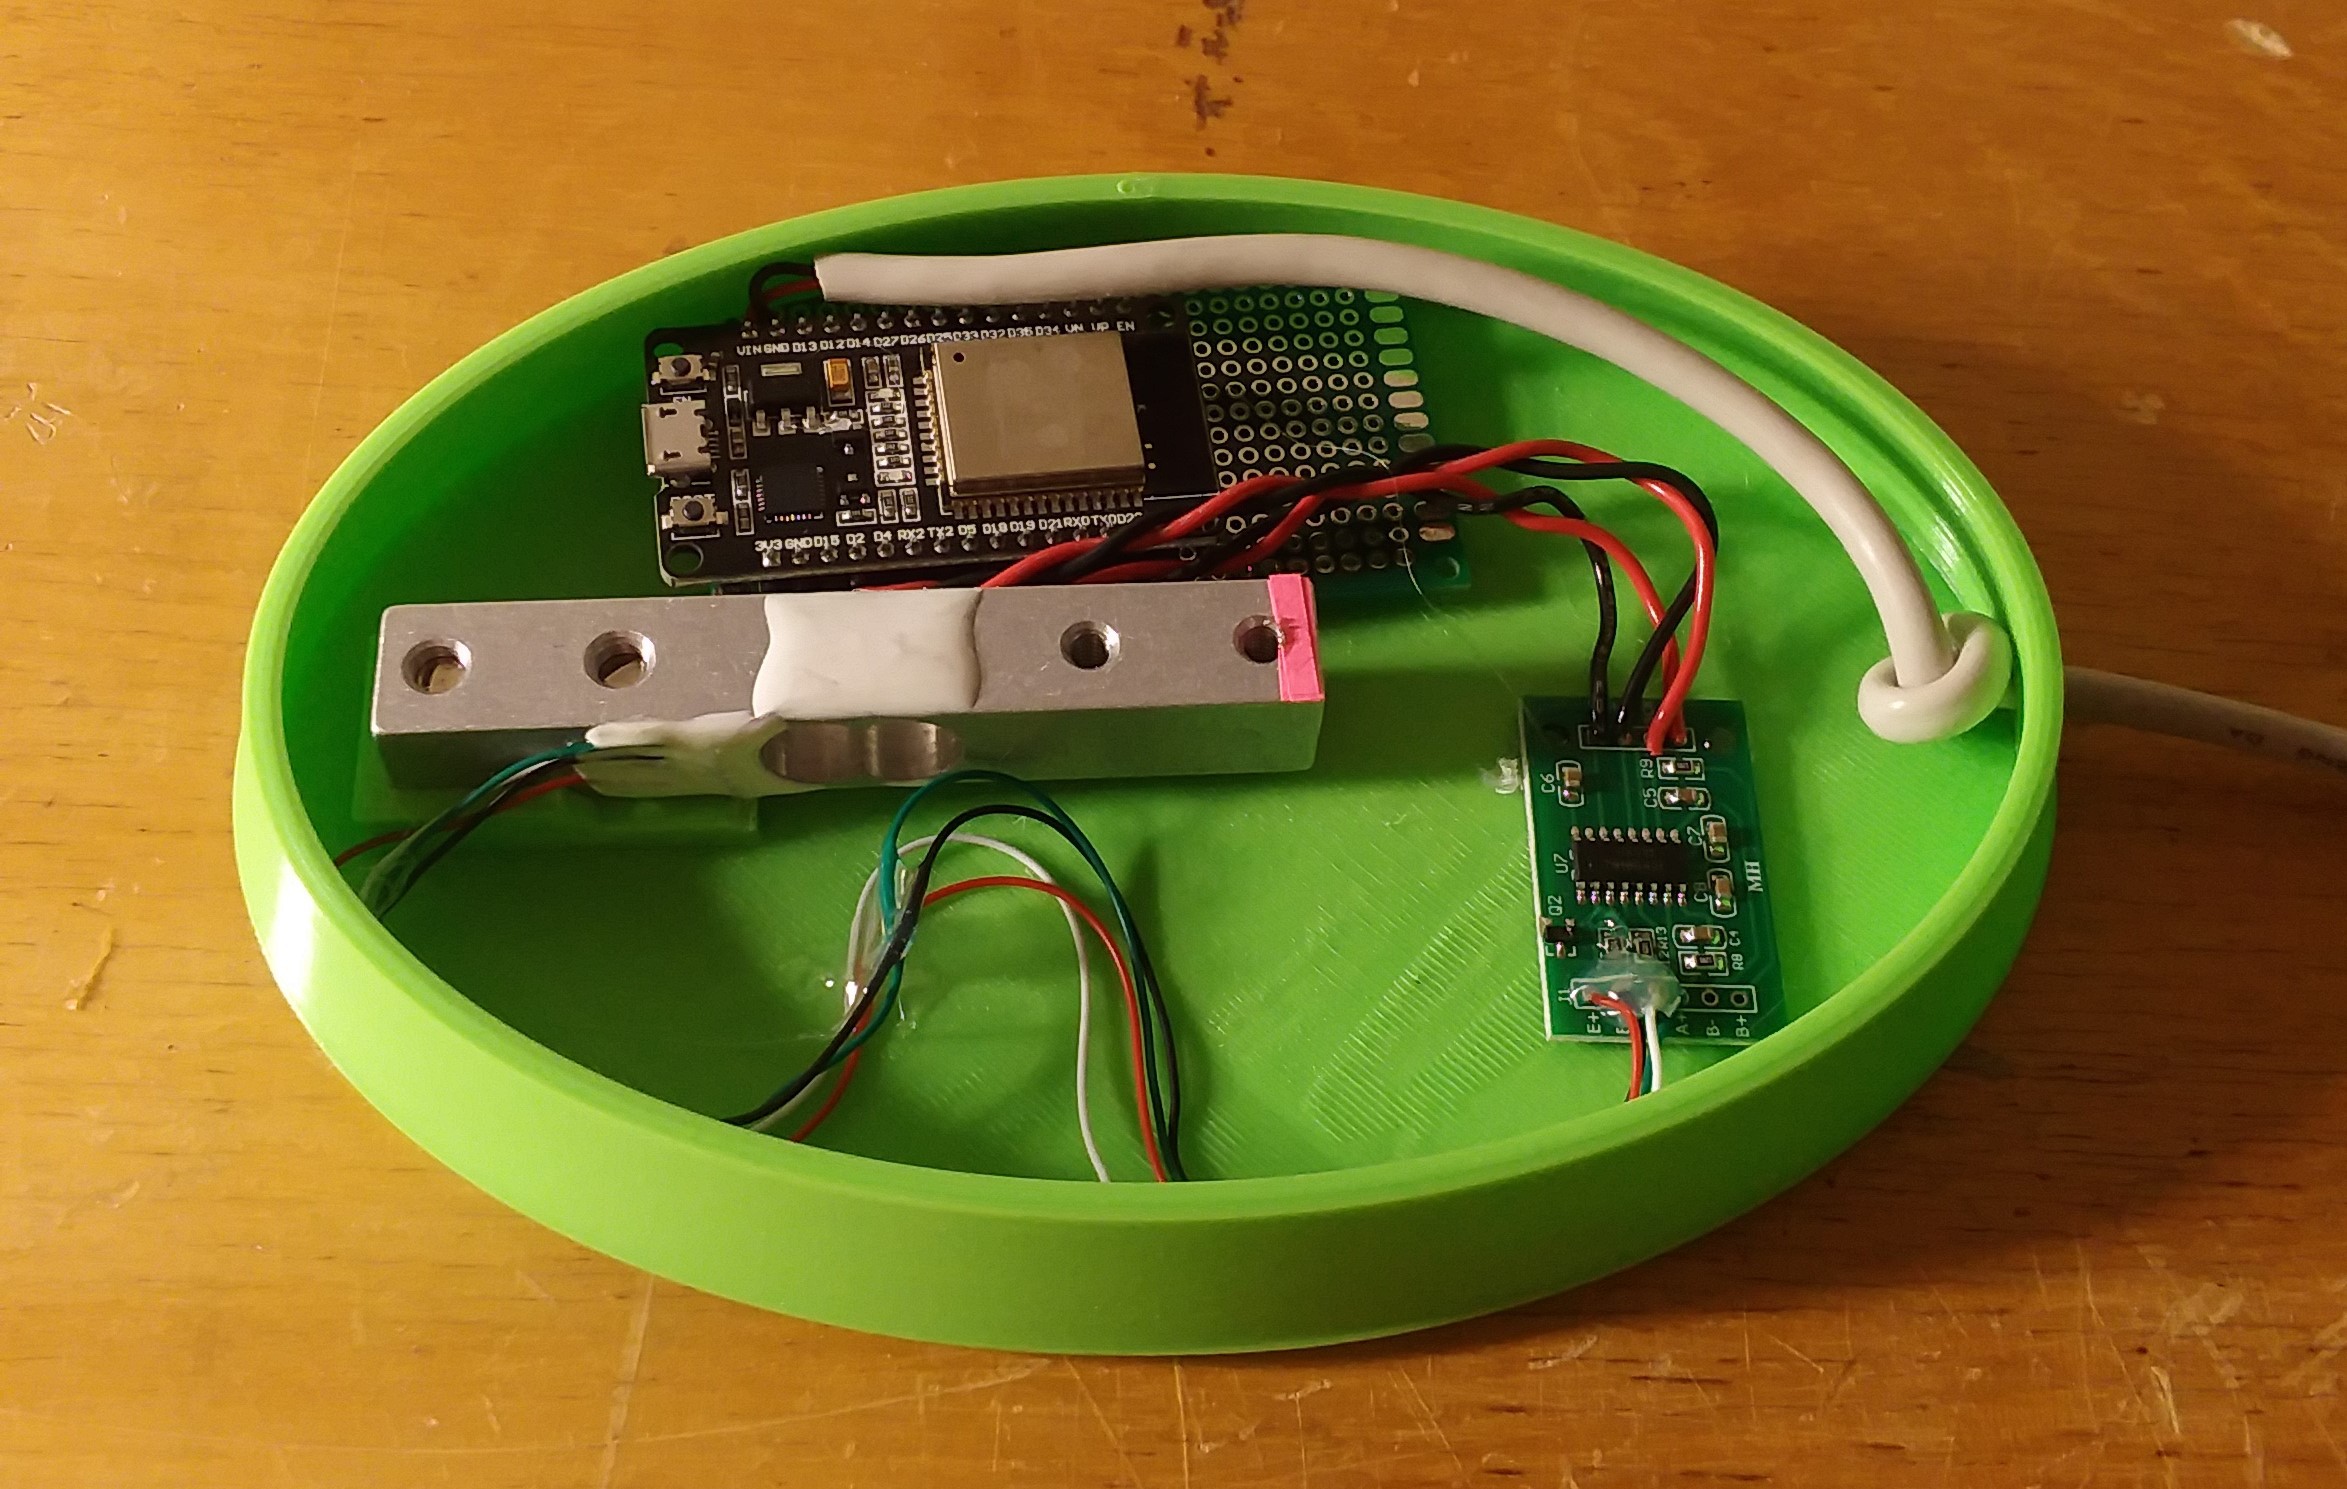
Looks a lot better than the before picture doesn't it? I know you're all really here for the internal shot though:
![]()
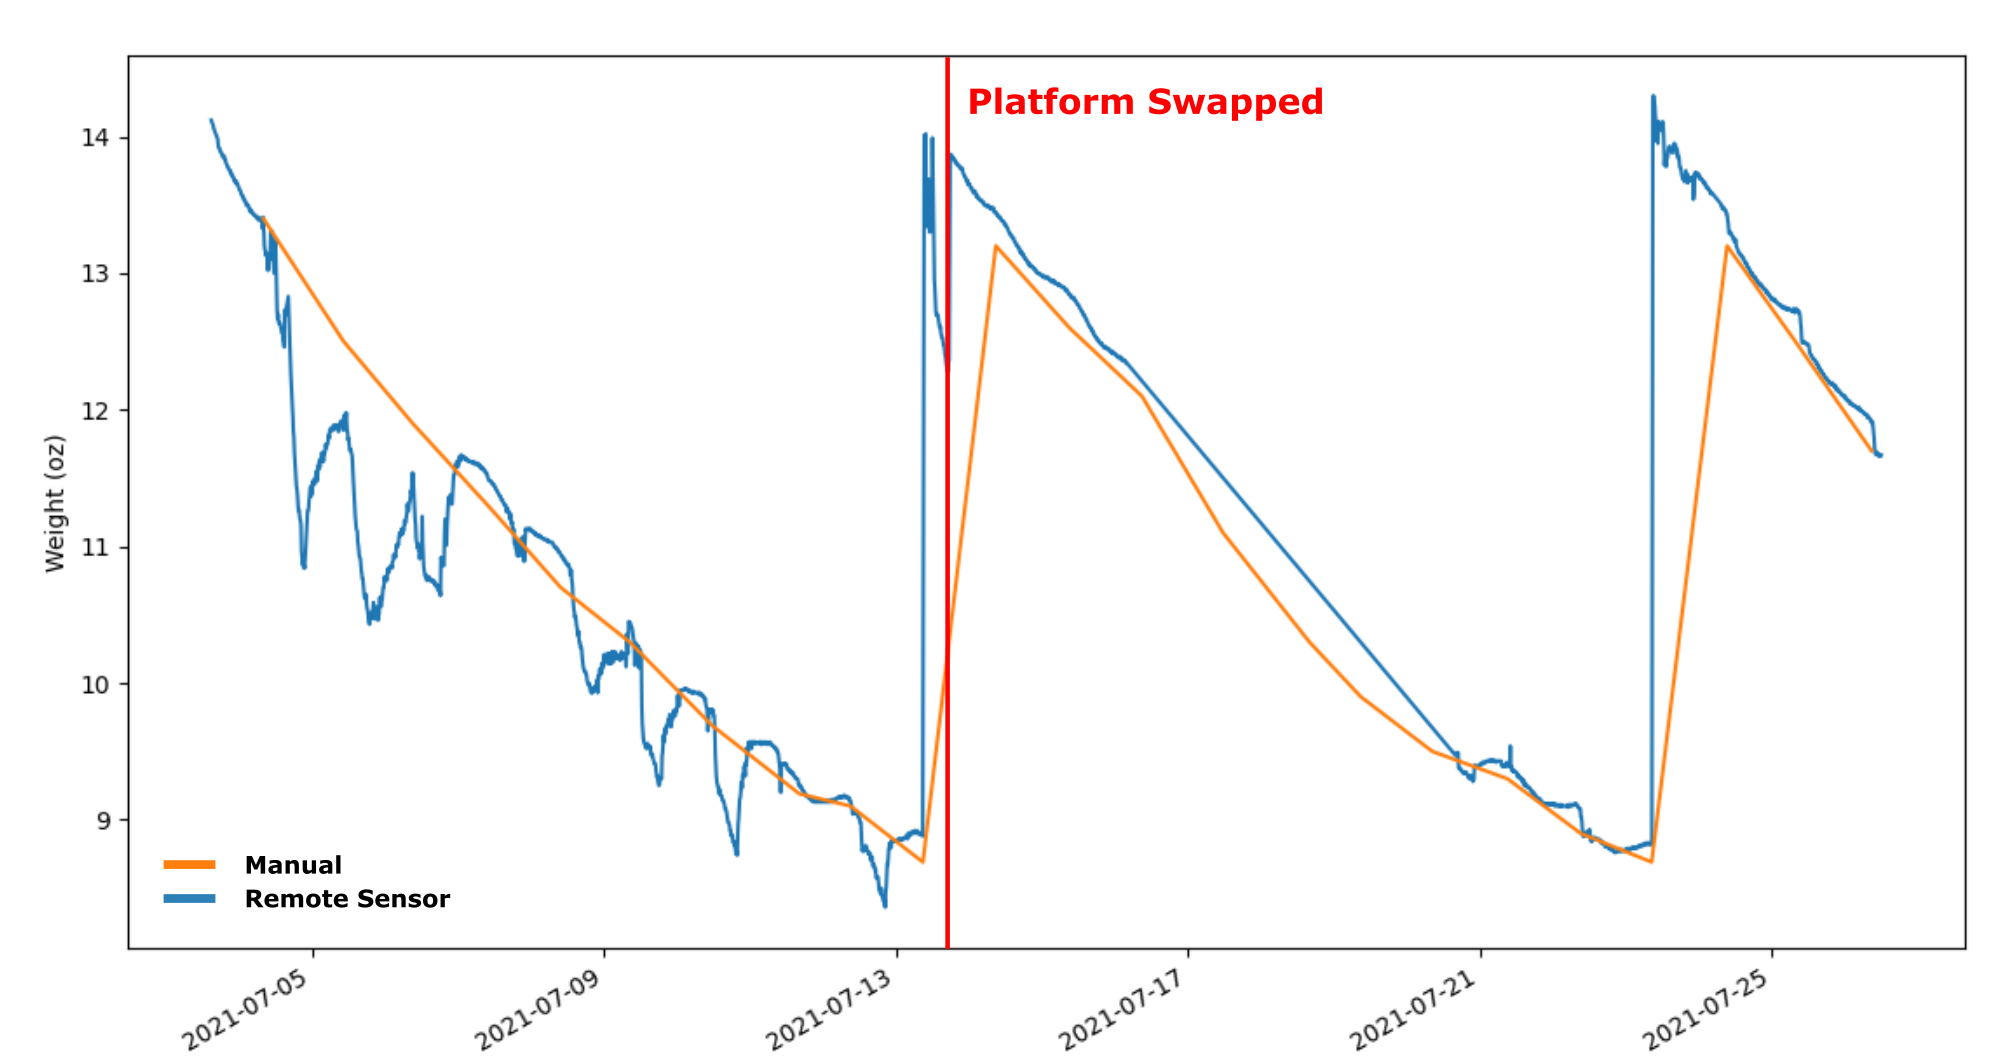
The internals aren't pretty, but it's an early prototype. If you think that platform looks a little thin, you're right. Below is the data I collected by hand, and by sensor with the thin platform and the thicker platform. Note the line where I changed from thin to thick platforms.
![]()
Hopefully my graphs are slowly getting better. There's a good deal of variation before the stand replacement (and a little after). I don't exactly know why, but I thought the deflection of the platform was somehow reducing the deflection at the load cell. Will that remaining wiggle go away with an even thicker platform? I may try it, but I might also say this is good enough based on how well it seems to track the manually-entered weights.
So What's Next?
Hardware
While a strain gauge integrated into the PCB is an interesting idea, it may be easier to move forward with the commercial load cell right now. The latter would allow me to focus more on developing the software side of things more, which is what I'm really trying to learn in all of this. The former could potentially make for a more affordable product with a lower BOM cost, but that's probably something to worry about later.
It's likely that I'll spin up a board (sounds so professional) to make wiring the ESP32, power, load cell, and HXT711 breakout board easier.
Enclosure
This setup is great for my little idiosyncratic planter, but it'd be great if it worked with the more common 6" planters found at every garden center (at least in the US, I'm sure they're 150 mm or so elsewhere). That's a pretty easy change and gives me a lot more room to work with for the electronics.
The model will have to be done before I can get the edge profile for a PCB.
Software
The ESP32 sketch needs work. Ideally it should serve up a status webpage when in operation. It should also allow for remotely taring the scale. When it's not connected to the network, it should instead serve up a page that allows you to connect to the network and log you in as a user. All that I've done on those fronts is start to learn the terms to search for (like captive portal). Well that's not entirely true, I've also tried (and failed) to get captive portal examples to work.
My kludged together web interface is gross so I'd also like to convert it to run on Flask. I've worked through a practice Flask project but have a little more planning to do before I'm ready to implement it.
-
Why I'm Doing This
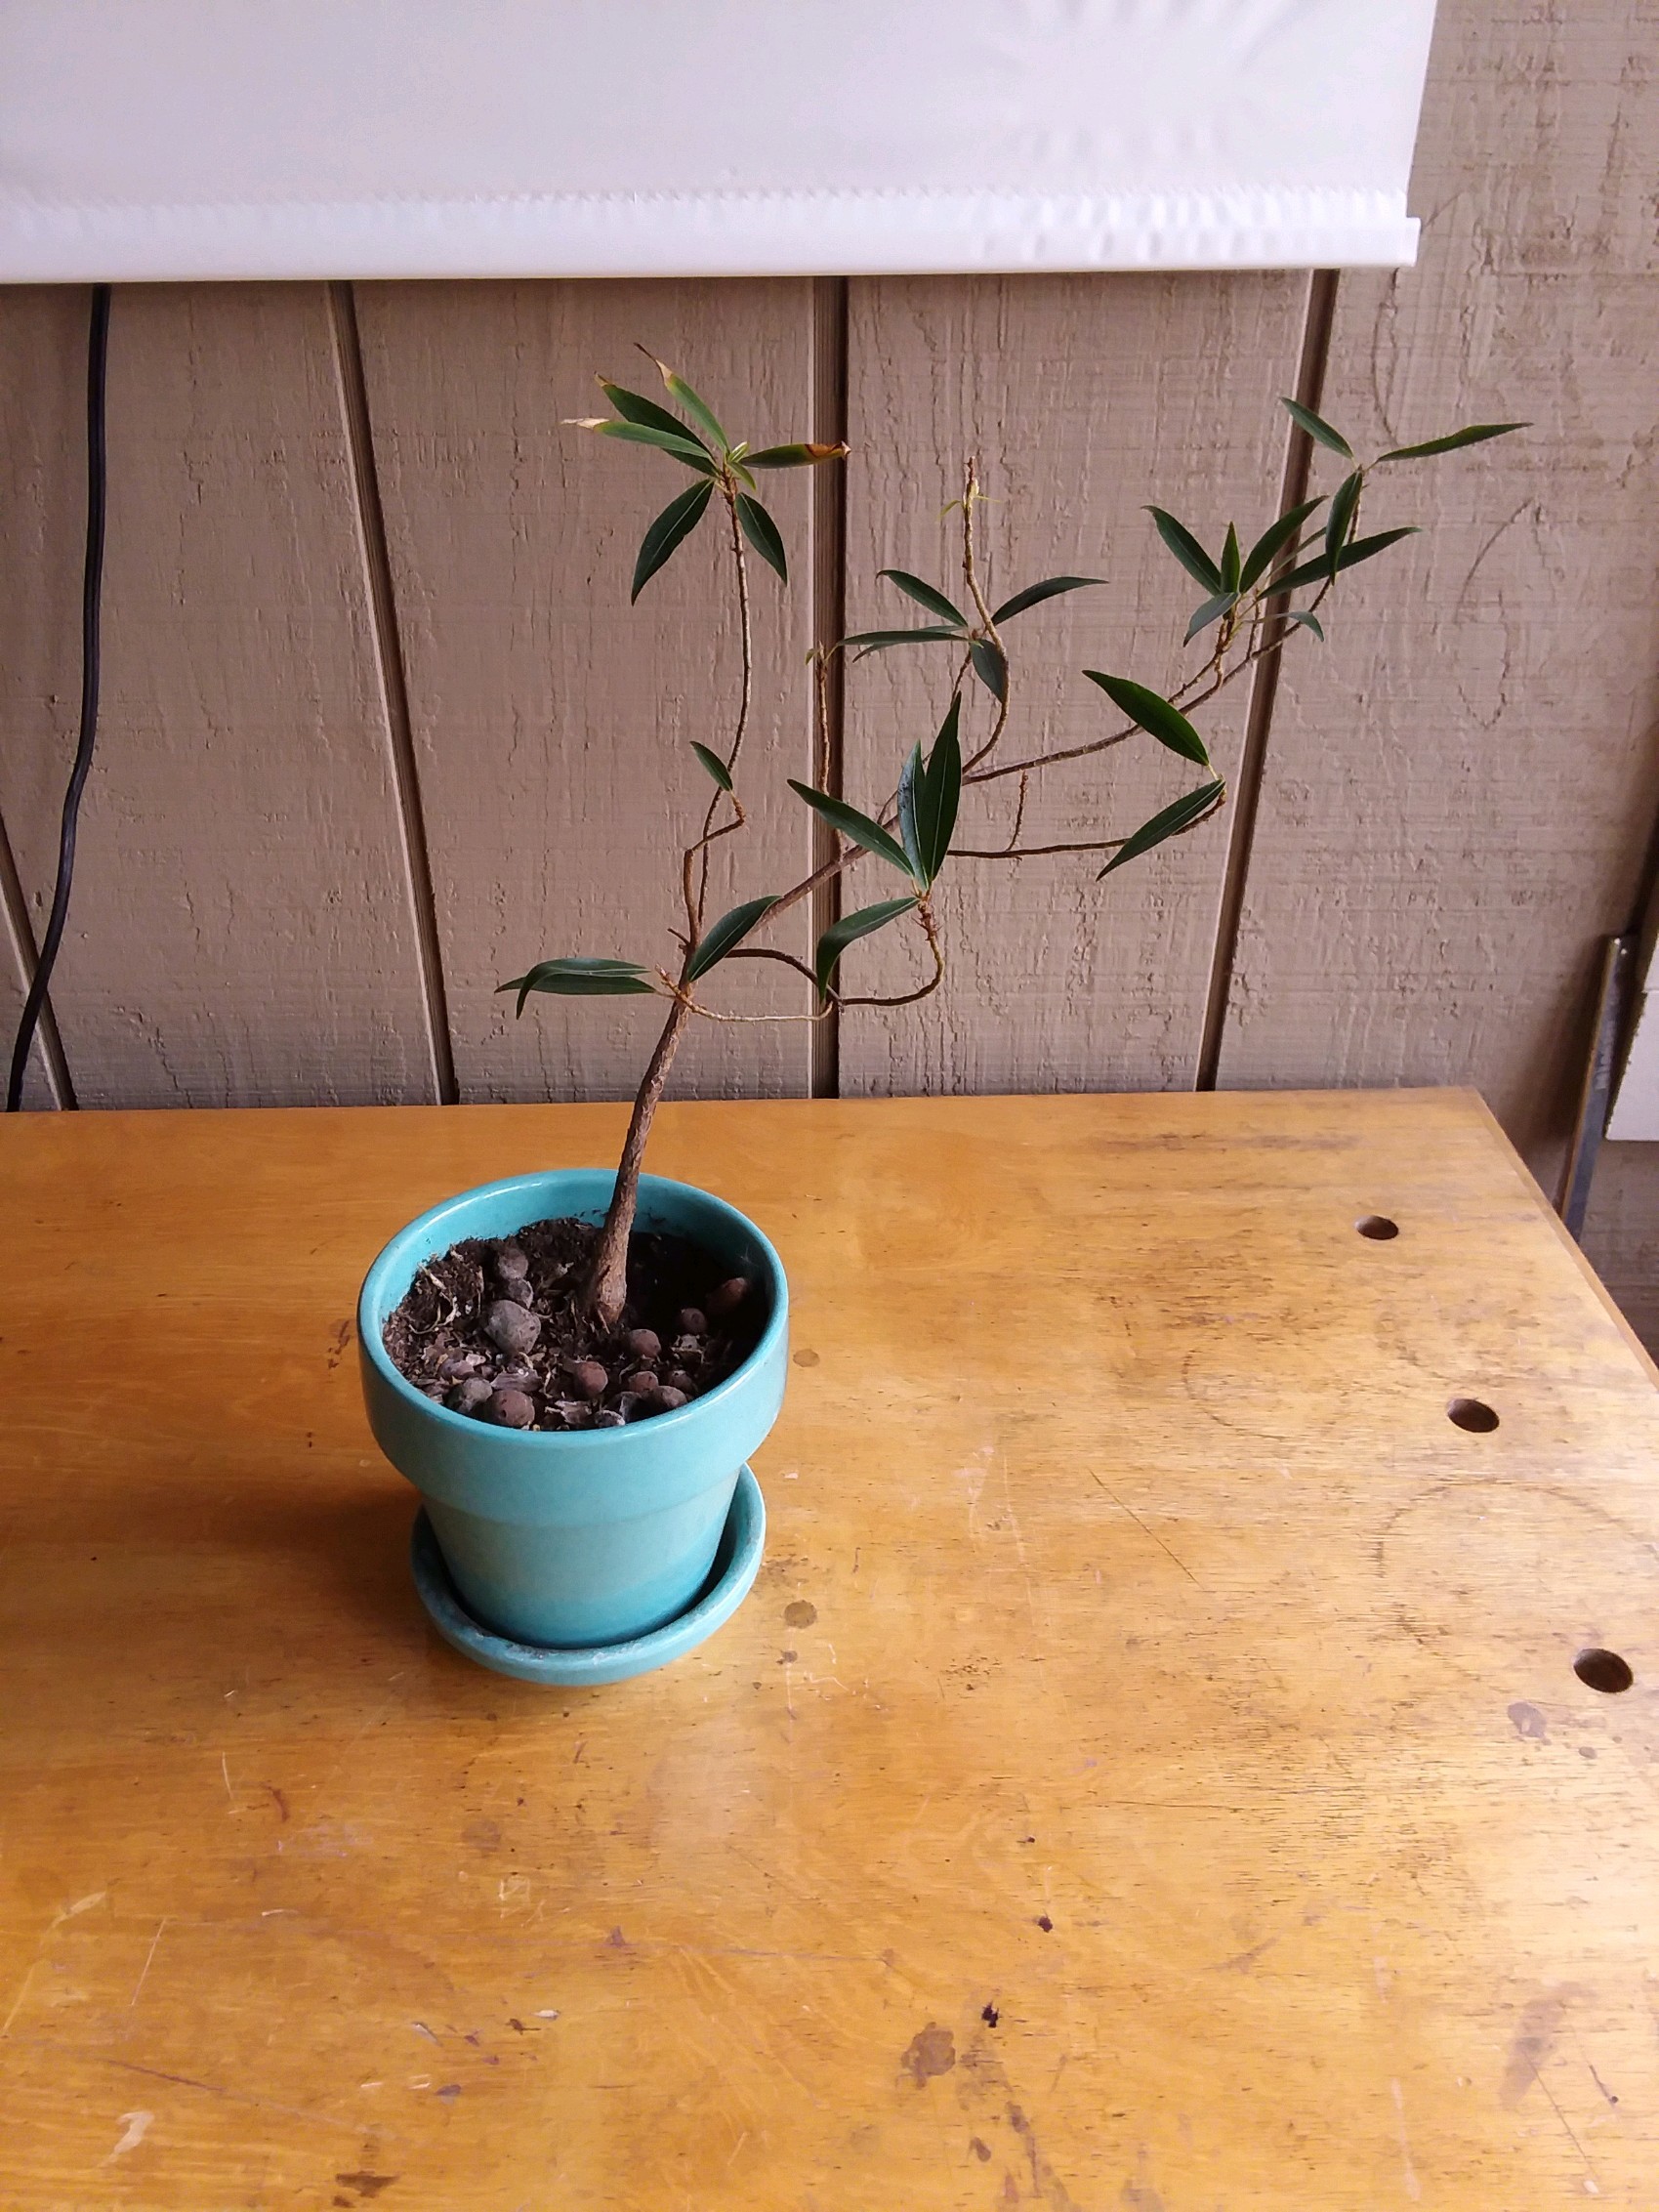
06/30/2021 at 20:49 • 0 commentsWeighing plants for better plant health is a nice idea in the abstract, but I was really motivated by one plant in particular. This willow leaf ficus:
![]()
In case you're wondering, this is not how a healthy plant looks. I've had it for about 8 years and it's always looked about this terrible. I wasn't sure whether I was over/underwatering or possibly just not giving it enough light. It did better in the summers when it got to live outside, but unfortunately that changes both of those variables.
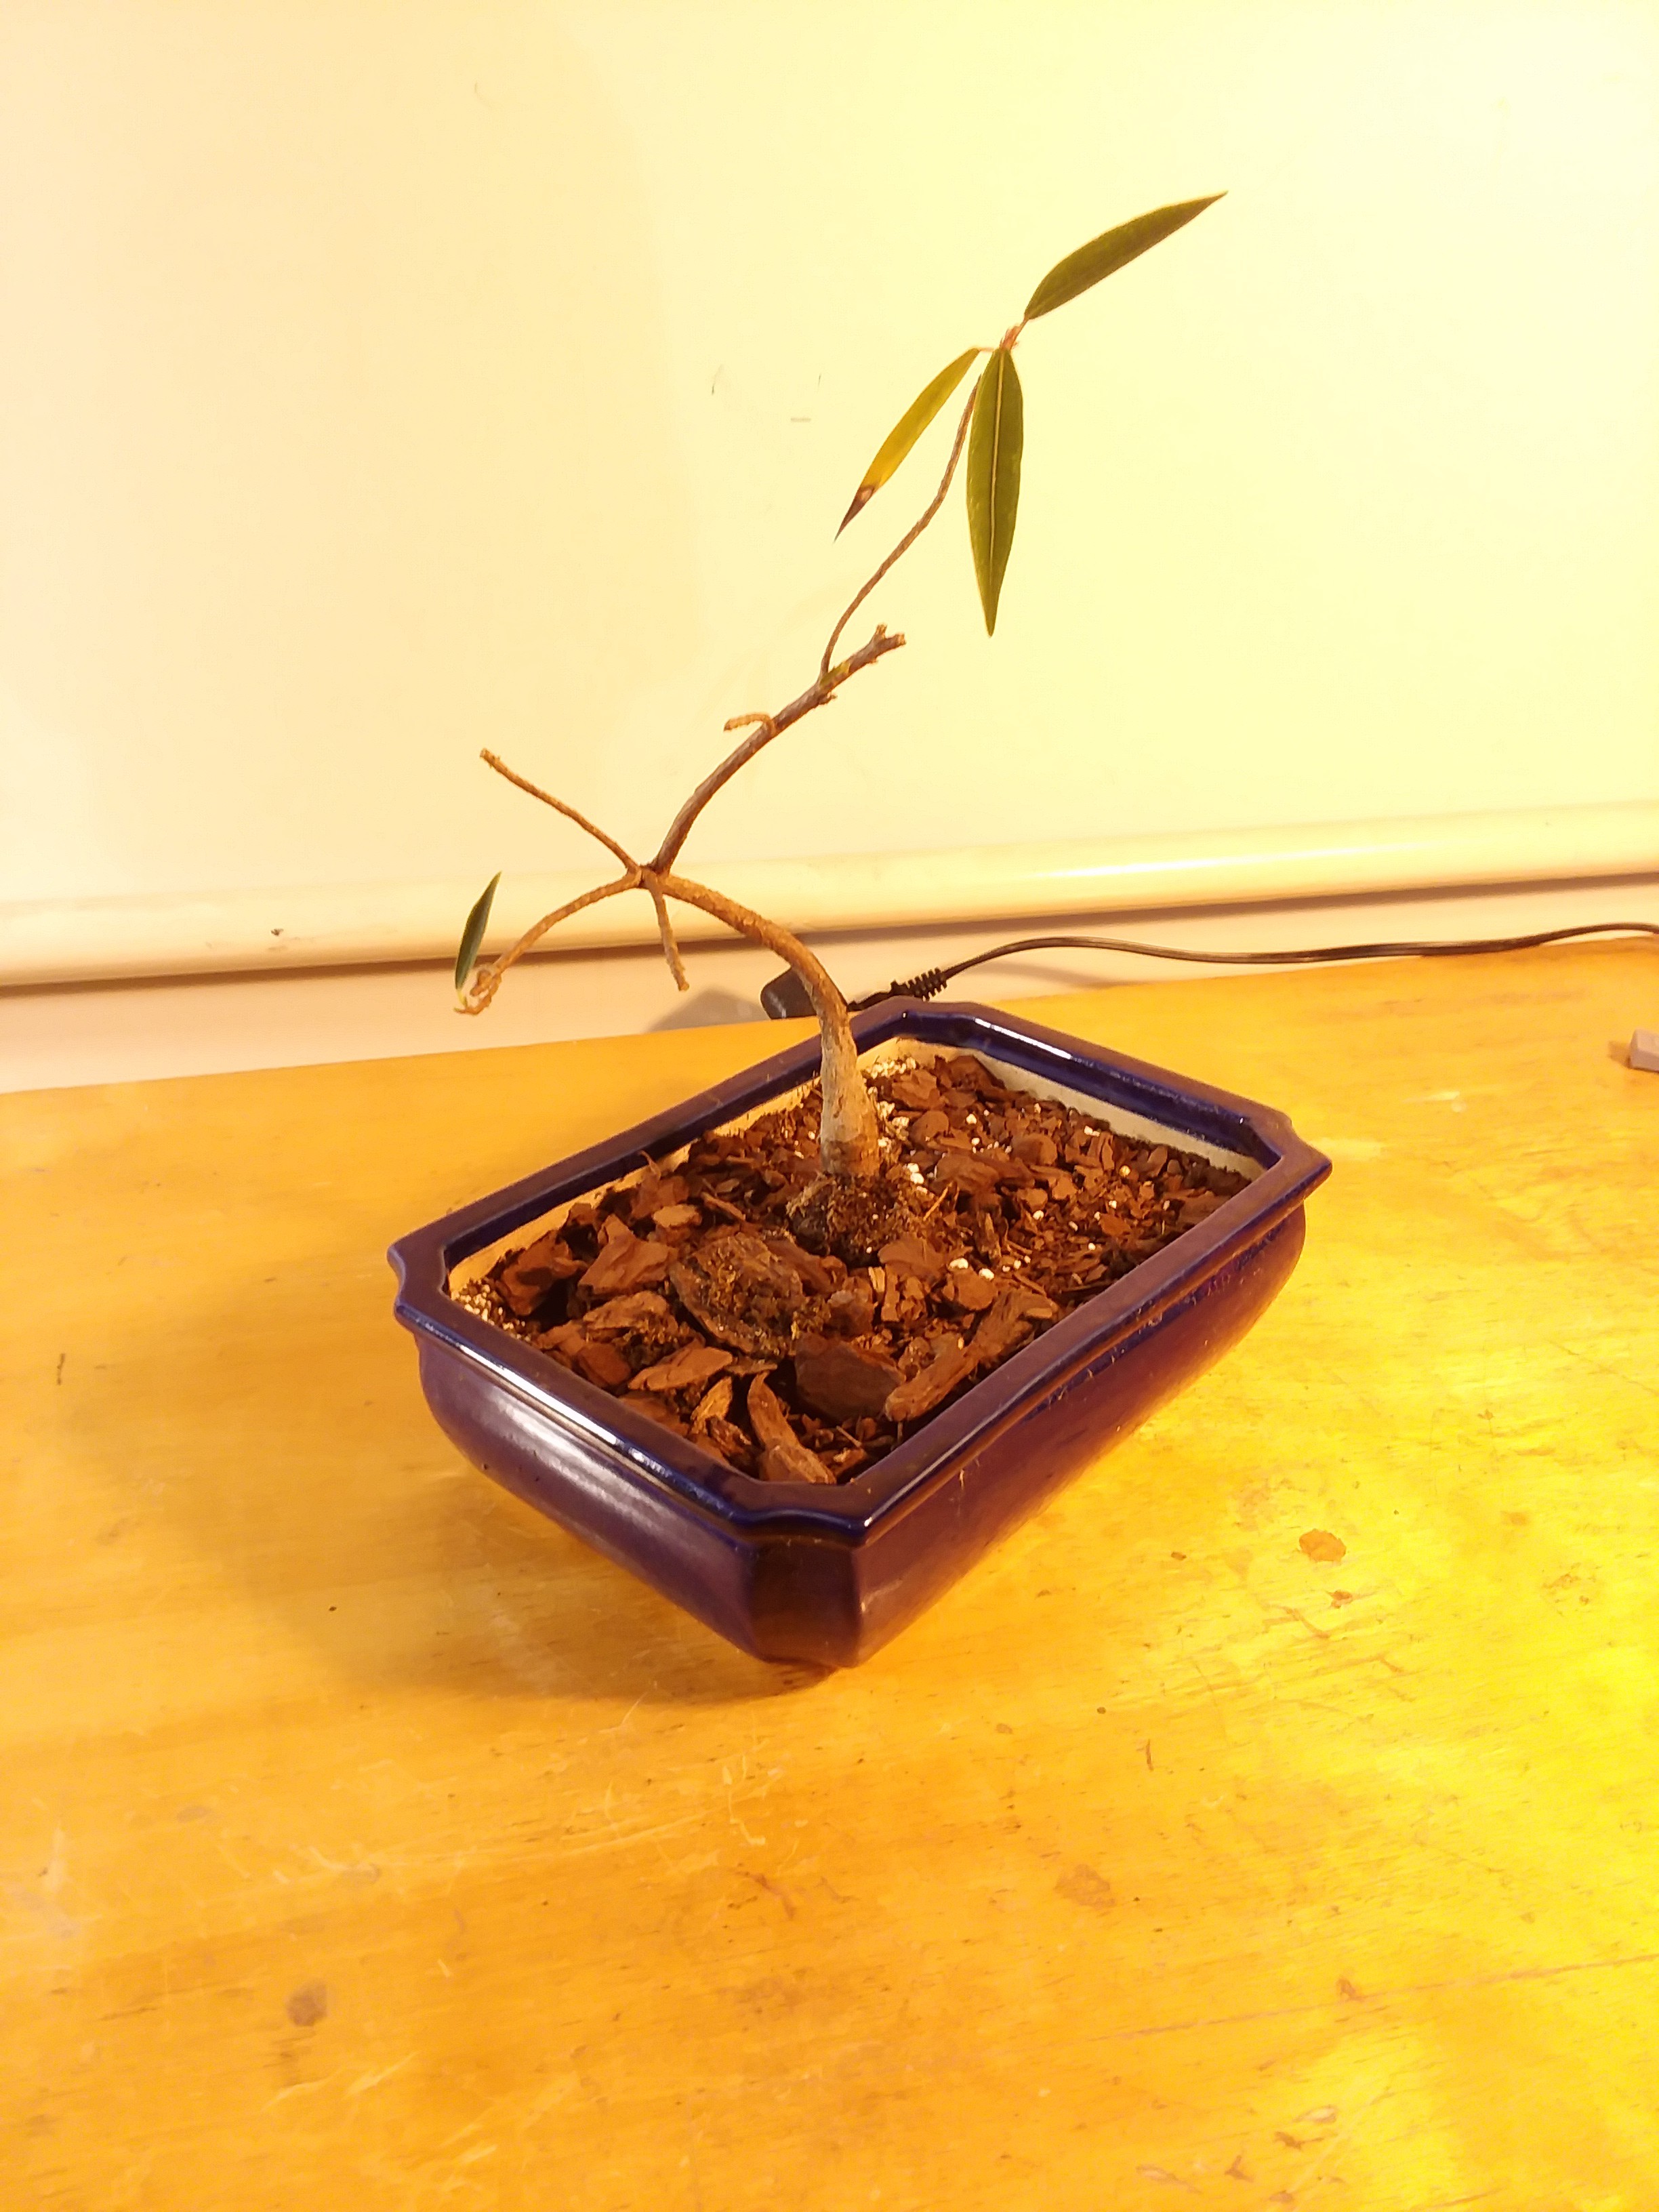
In January, I watched one of those many YouTube videos on creating bonsais from relatively normal-looking plants. I gave it a shot, to largely terrible effect.
Side note: I'm not terribly fond of describing these mini-tree sort of things as bonsais. Bonsai comes with many cultural connotations and the perception of right and wrong ways of doing things. I just want interesting-looking plants, so I try to avoid calling them bonsais. But, bonsai is a pretty effective word for giving someone else the rough idea of what you're going for, so I do slip up and use it periodically.
![]()
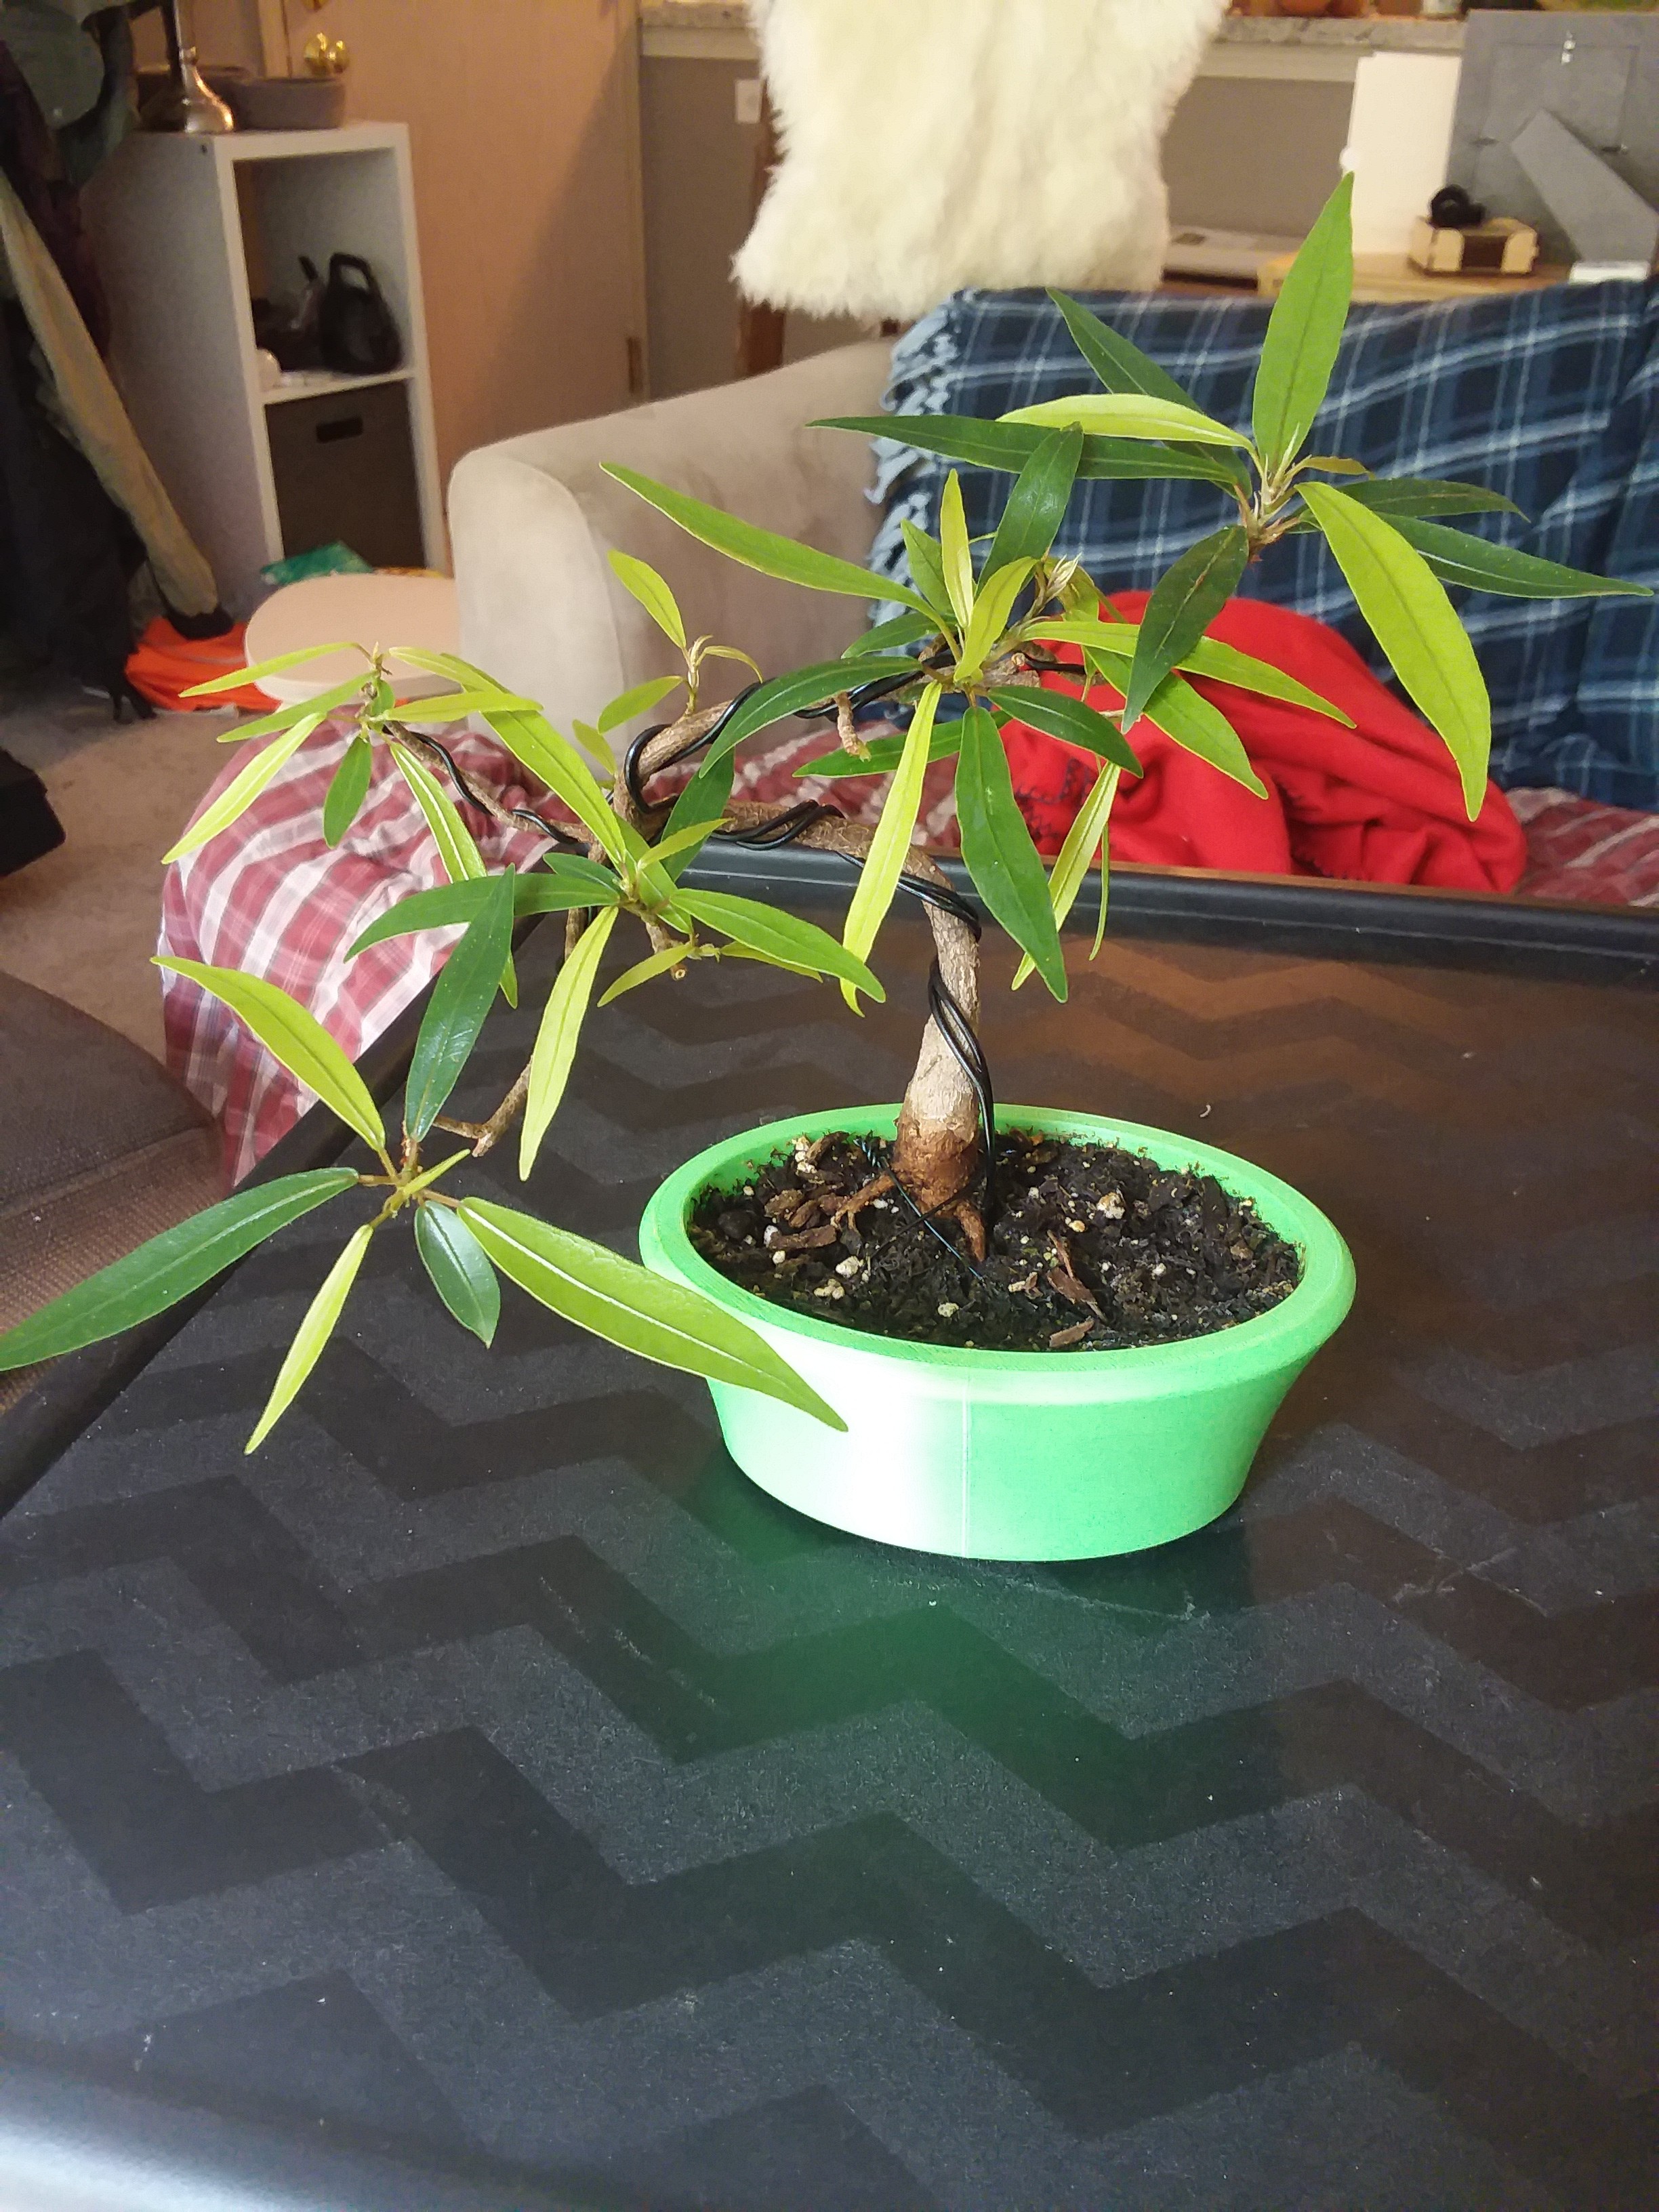
:( In between the previous two pics, I moved from Atlanta to Seattle, which probably didn't help the plant at all. The repotting really exacerbated the watering issue. Since the root system was tiny (not a healthy plant), the bigger pot made it harder to tell whether the soil by the roots was dry. I was worried that the plant was going to completely die if I didn't do something, so I risked the stress of repotting into a much smaller planter (designed by me in Fusion 360 in two snap-together parts to print without support). This next picture is 2 months later.
![]()
:D About at this point, I started tracking the weight of all of my plants each day in a little notebook. That was far too much work, so a Raspberry Pi Zero W database with a local network website followed shortly. Anyways, here's a plot of the weight of this particular plant, starting at the end of April and going until July 2nd.
![]()
Trust me, it looks worse if I include the dates. Couple of things stand out to me about this graph, aside from my clear lack of skill in creating compelling graphics. First is that the time between watering is decreasing (or frequency of watering is increasing if you'd rather be positive about it). This is likely due to a rebound in the number of leaves, which use up the water in the process of photosynthesizing the plant food.
The other is a lack of an upward trend in the maximum weight. As the plant grows more, it should be increasing in mass, yet this graph implies the opposite. I have two guesses for why: my measurement and watering schedules are missing the maximum weight in each watering cycle or the weight of the plant is pretty negligible compared to the soil, water, and pot. The first certainly contributes, especially since I tend to weigh, then water, then weigh again the next day. Measuring more continuously with an in situ scale should reveal the contribution of the timing, but I suspect the growth I've seen has also been negligible.
-
Commercial Scale Teardown
06/23/2021 at 00:05 • 0 commentsDisassembling the Scale
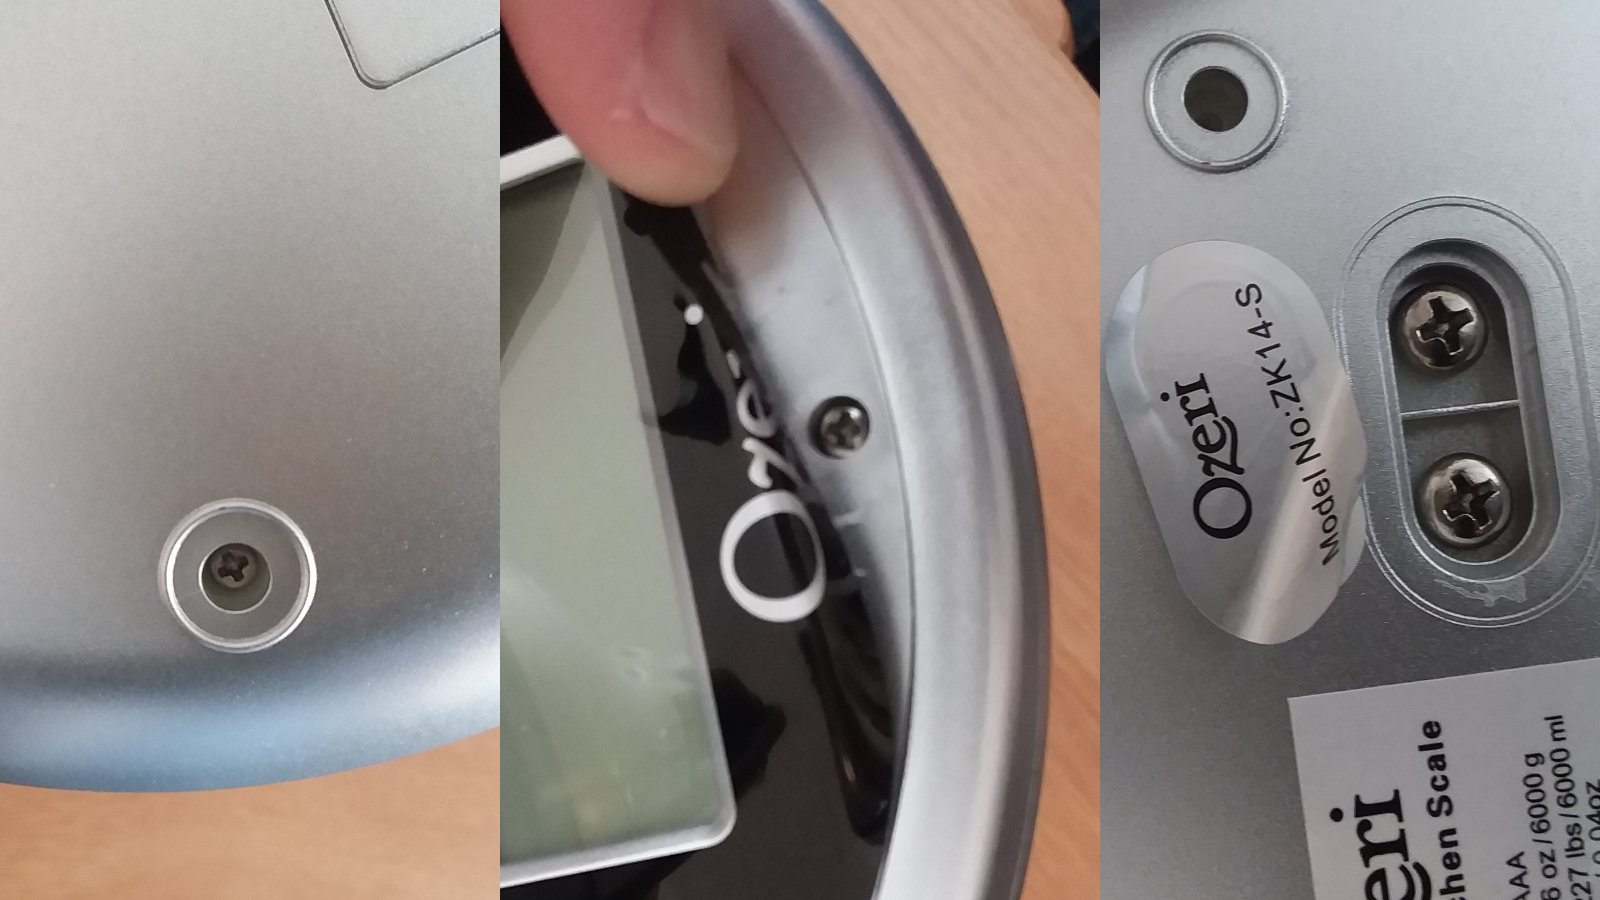
If you're lucky, the commercial electronics you're looking to open up will be assembled with screws. This is especially true if space isn't a particular concern. Those screws often hide though, under things like rubber feet, screen decals, and even product decals. If you're unlucky, there will be adhesives or even ultrasonic welding of plastic parts.
![]()
I was lucky. With the exception of a screw hidden under the faceplate, all of the screws were pretty easy to find and the whole thing came apart without the need to destroy anything.
Evaluating the Guts
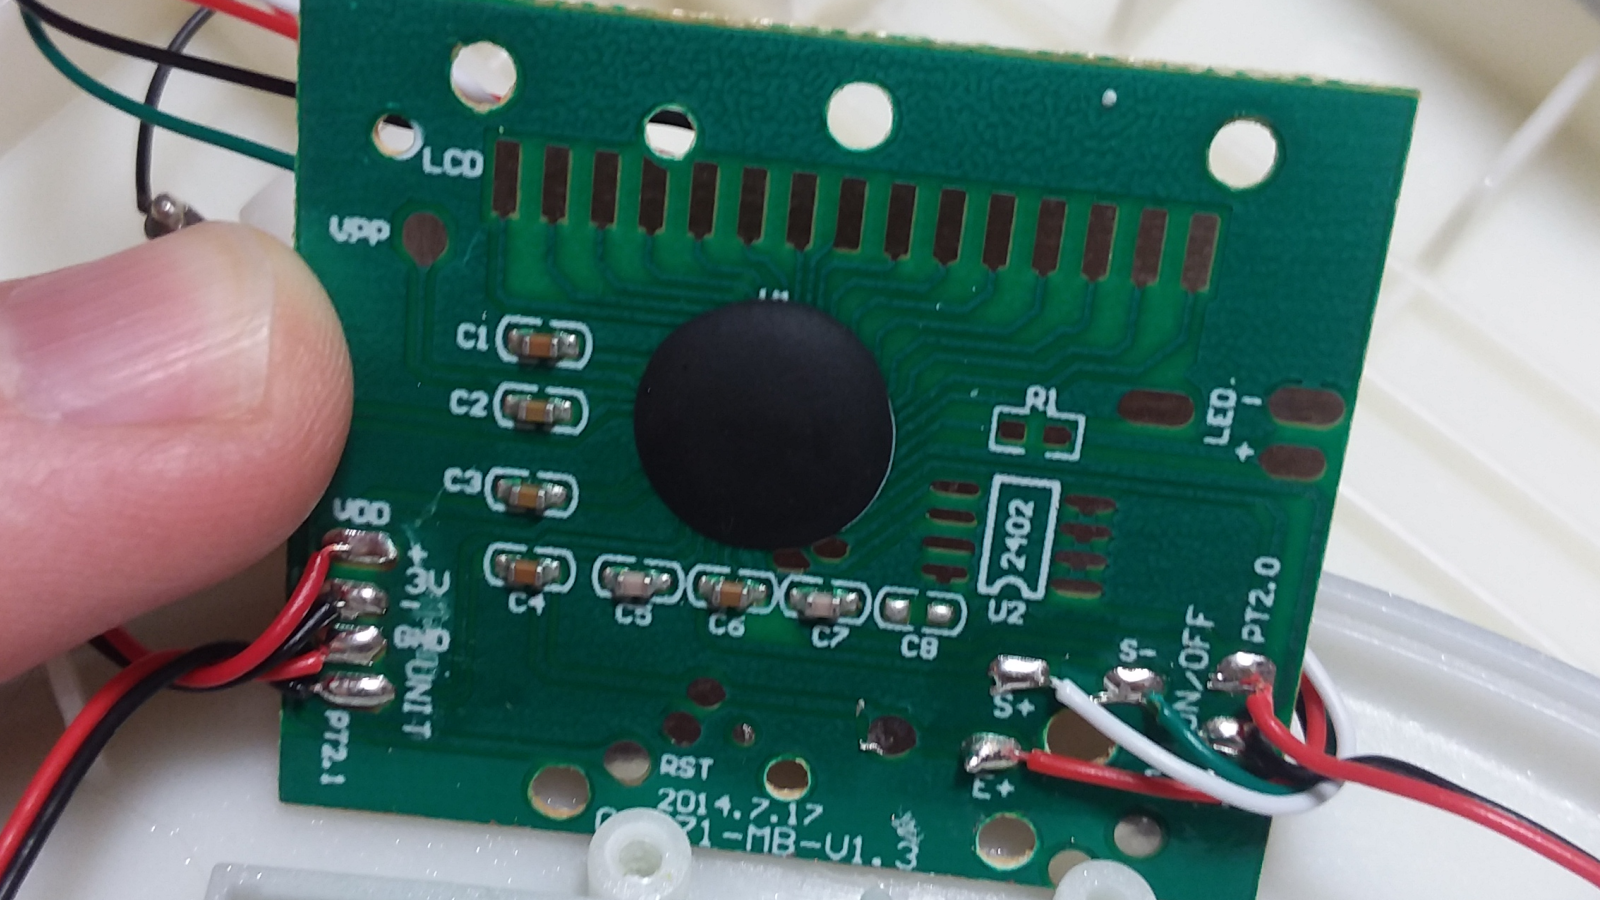
I was surprised to find no other resistors on the board, so the Wheatstone bridge is a full bridge (4 strain sensors). Upon some research, I discovered this is actually pretty standard for load cells. Sparkfun has a great article on getting started with load cells.
I was also surprised to see capacitors at every leg of the Wheatstone bridge. Perhaps these are for smoothing purposes?
![]()
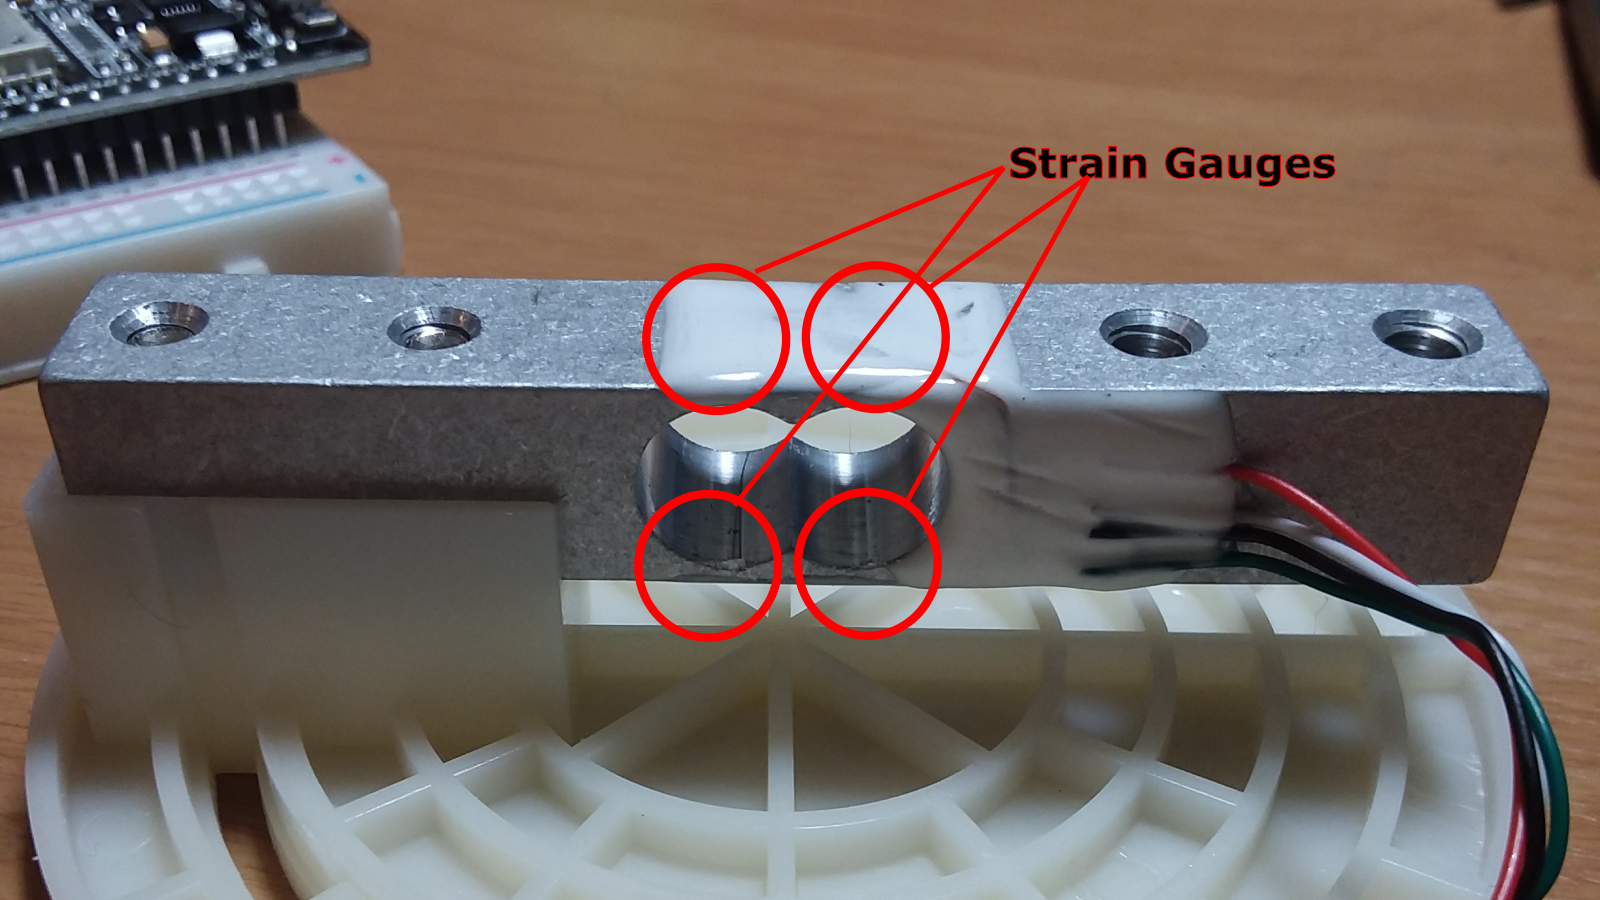
The cutout in the load cell is to ensure that deformation occurs there instead of distributed evenly throughout the bar. That cutout looks like someone drilled two separate holes. I assumed this was because of manufacturability, but was wrong. This geometry creates 4 weak points, allowing for the placement of 4 strain gauges: 2 in compression and 2 in tension.
![]()
Also no ADC or op-amp, unless they're under the epoxy blob, so either the microcontroller has a better ADC than the Nano, or the values are different enough that more resolution isn't needed. Looks like there's a spot for another IC, but it isn't populated.
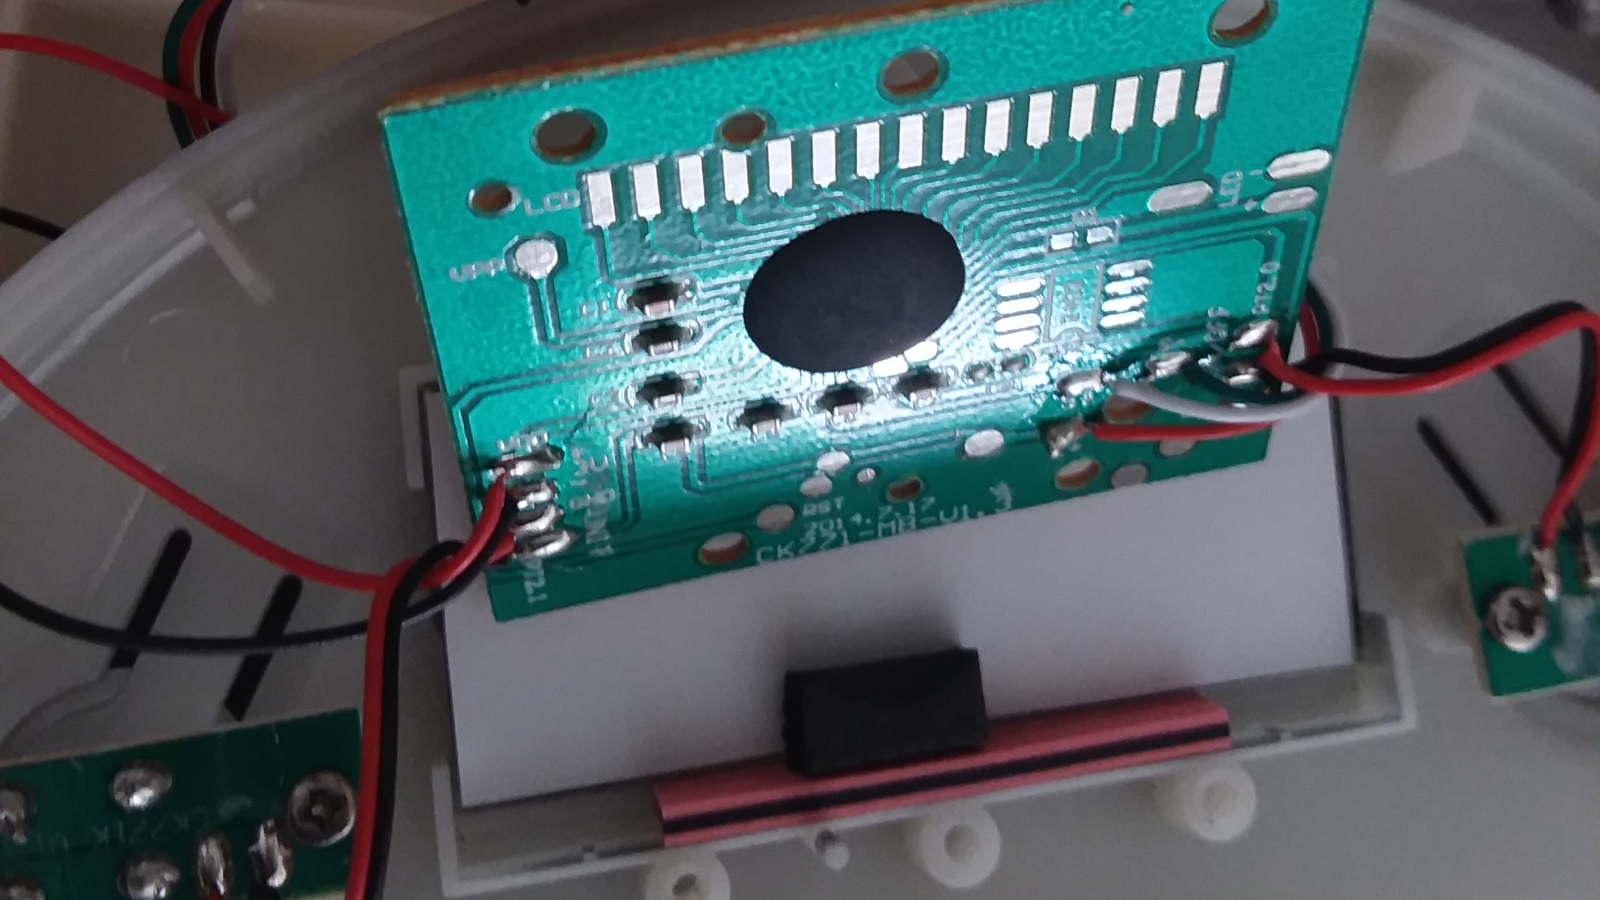
Surprisingly, there's no locking connector for the LCD, it just gets held on the PCB via the enclosure. Based on other teardowns of scales, this looks like it's pretty standard.
![]()
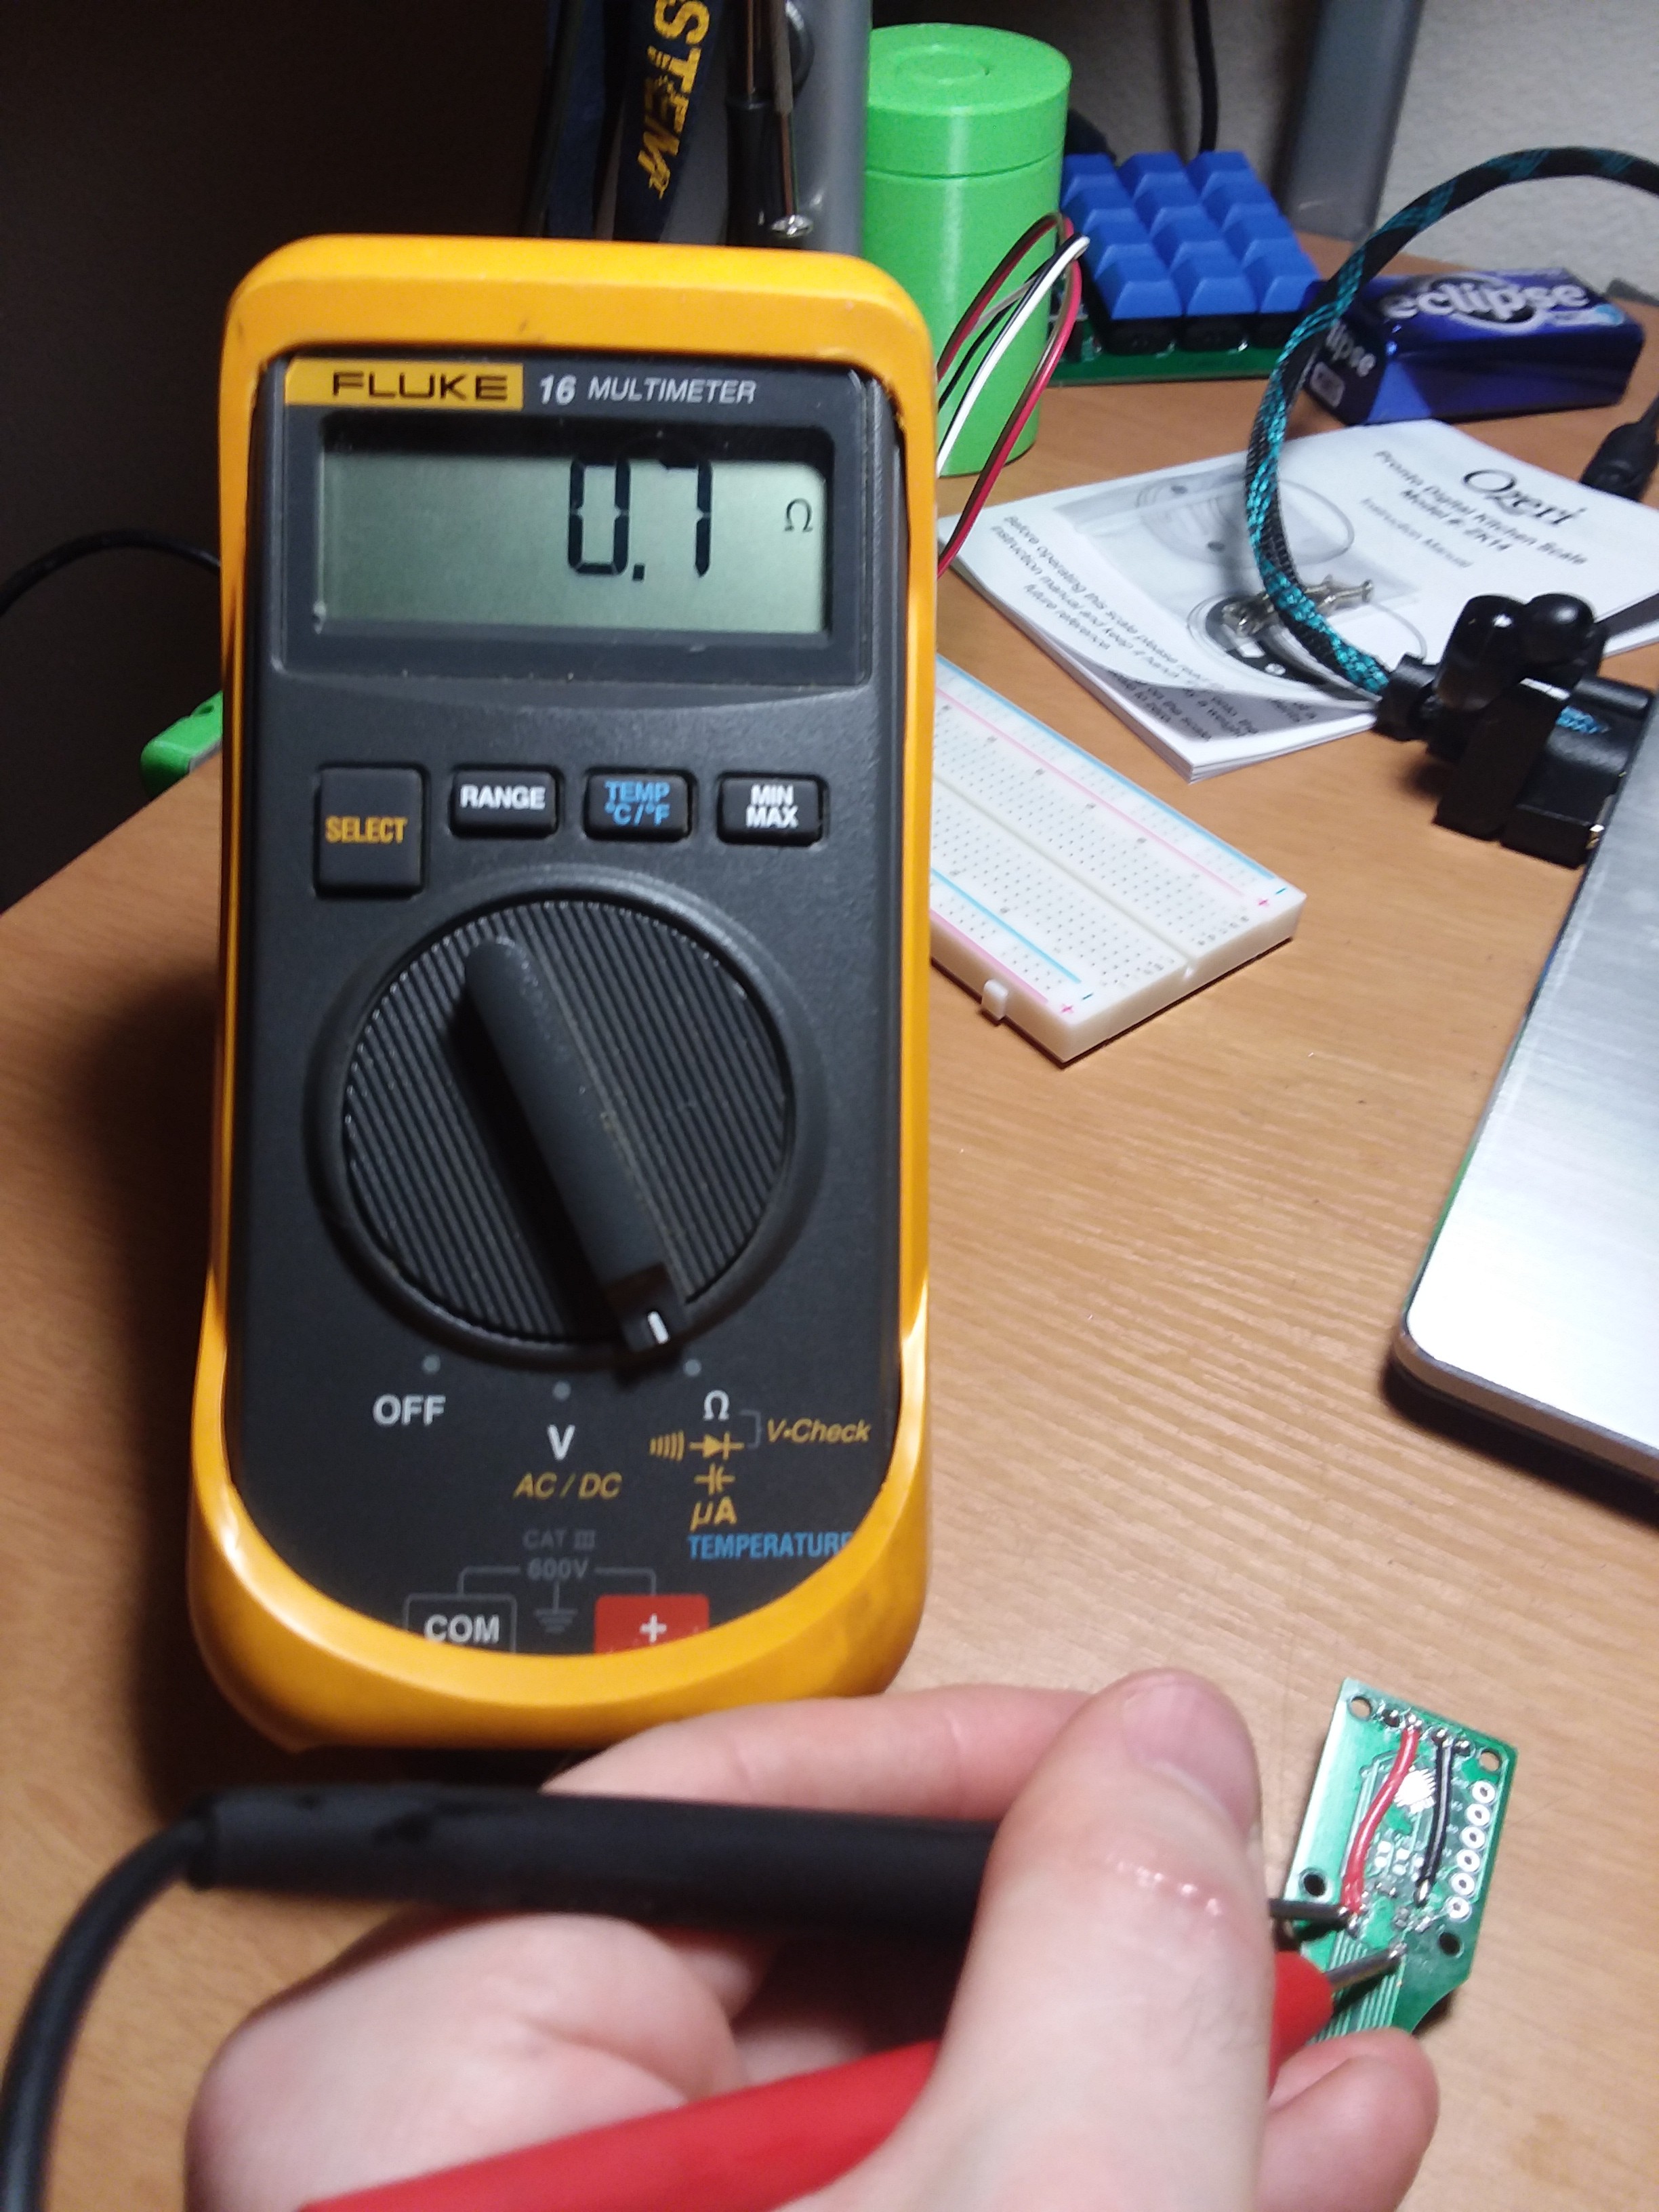
The individual strain gauge elements of this load cell appear to be 748 Ohms, very respectable, especially when compared to my gentleman's 3 Ohms.
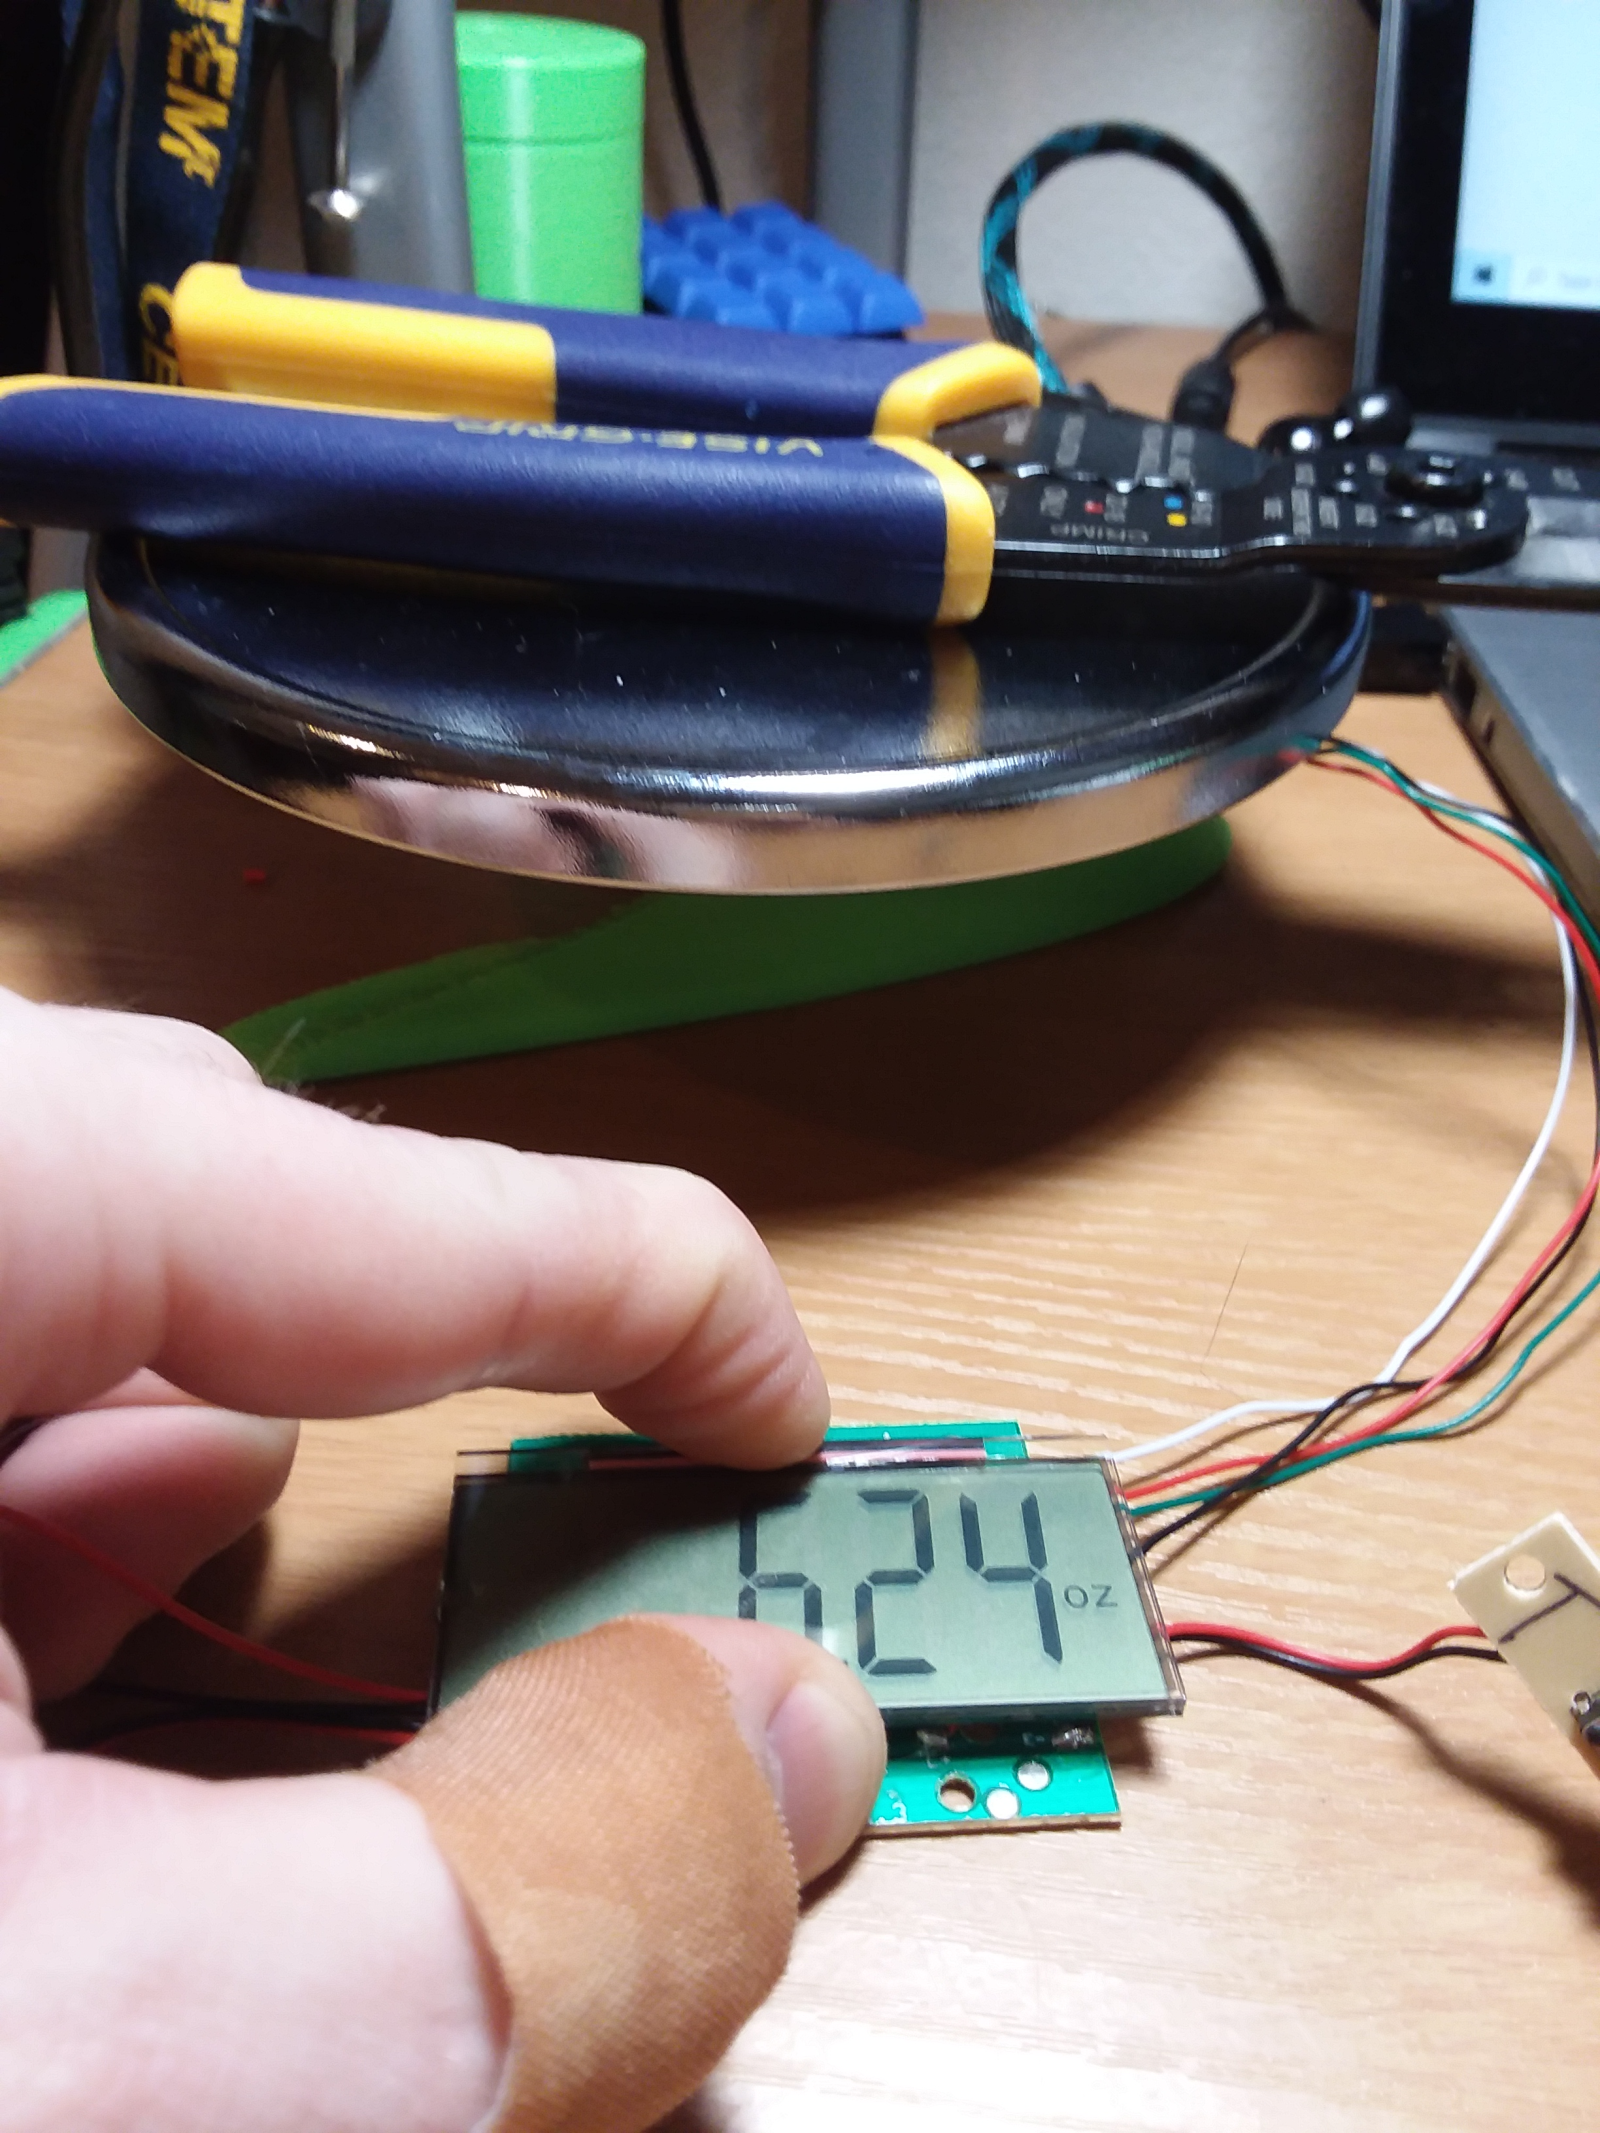
I ran the scale with no modifications (well, sprawled across my desk) and put a 6.24 oz weight on the scale (my wire strippers). My multimeter, which measures to 0.001 V, couldn't detect a change in voltage under load (1.273V at both junctions of the Wheatstone bridge). This means it can't be using a 10-bit ADC because those measure down to 0.003V with a 3V reference voltage.
![]()
What's Next?
Time to desolder the leads to the load cell and try using it with my ADS 1015 and a Nano. Based on the prices I've seen on load cells, this may be a better approach than rolling it all into one custom PCB.
I'm not sure there's a way for me to get a more sensitive strain gauge on a board than what I currently have. The only ways I know to make it more sensitive are to increase the resistance in the trace that makes up the strain gauge. To increase resistance, the trace needs to be longer or thinner. Thinner isn't possible because of the board manufacturer and longer increases the cost of the boards and takes up more space. The other thing I could do to try is getting an ADC with more than 12 bits of resolution, which will also be pricey.
-
How We Got Here
06/21/2021 at 23:06 • 0 commentsFirst PCB Version
I wanted to embed a strain gauge in a PCB. I'm not sure this makes any practical sense, but thought it might be convenient to avoid the wiring and hassle of attaching a strain gauge to a load cell by embedding the strain gauge with the rest of the wiring to make this an I2C-powered sensor. Also in this version were a status LED, ATTiny85, and resistors to make a quarter bridge Wheatstone bridge.
![]()
These fill areas show a lack of professionalism. So where did things go wrong? Well I didn't even think to calculate what resistance the of the strain gauge would be. It was very low, like under 1 ohm. This was pretty problematic because it meant I needed a current-limiting resistor, which I didn't think to include. I really should've put a spot for a 0 ohm resistor just in case, but that didn't occur to me.
![]()
Well shoot... Even when I bodged in a current-limiting resistor I couldn't detect any change in voltage as a result of a load, because the voltage drop across the current-limiting resistor left very little resolution for the actual strain gauge. I ended up bodging in some more wires to cut the ATTiny85 out of the picture entirely to allow for easier debugging with an Arduino Nano.
![]()
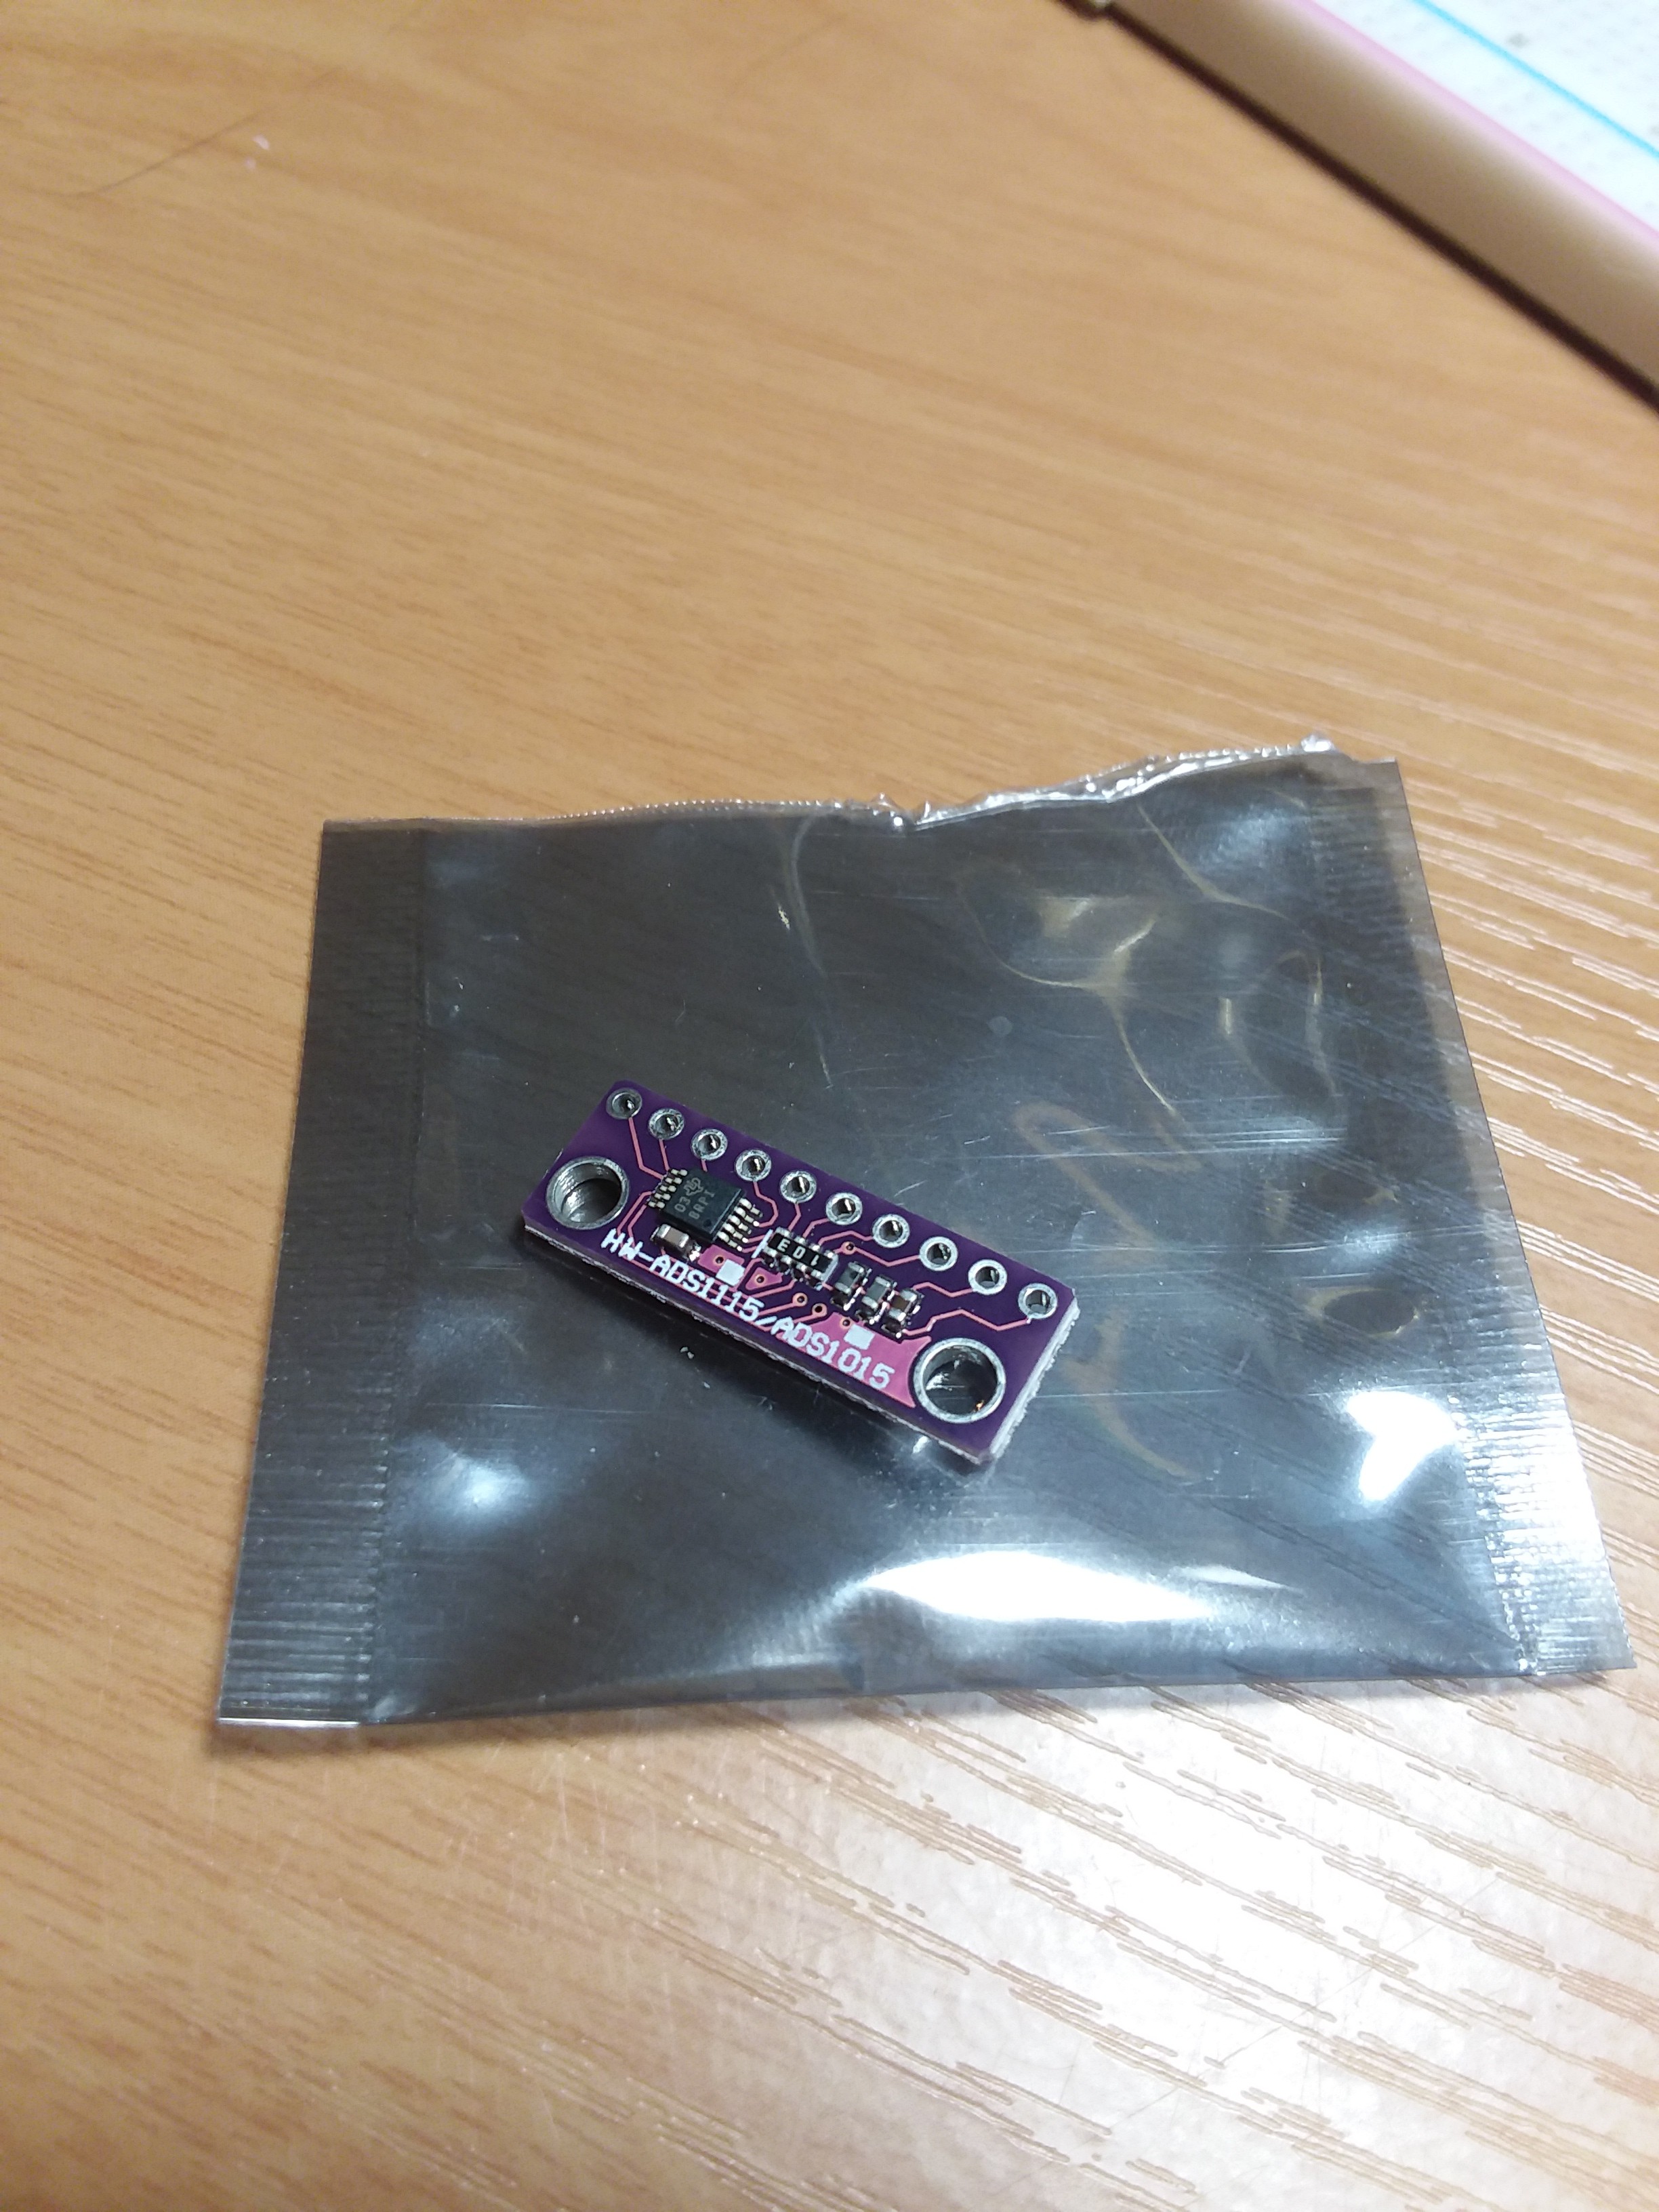
First time cutting traces and bodging in a resistor. I thought this might still be salvageable (spoiler: it wasn't) if I just hooked up an ADC with better resolution. I bought a breakout board for an ADS 1015, which has 12 bits of resolution compared to the Arduino Nano's 10 bits. Still no noticeable difference when a physical load was applied.
![]()
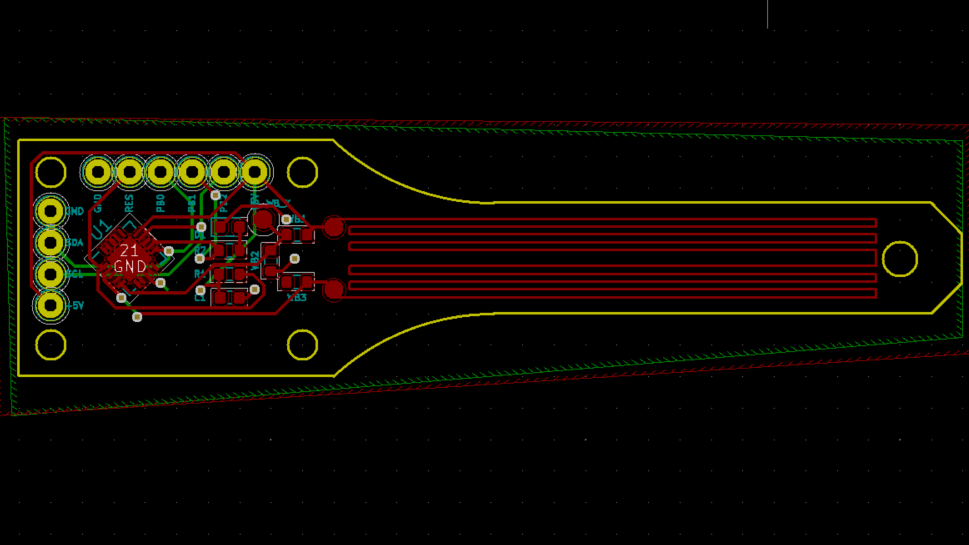
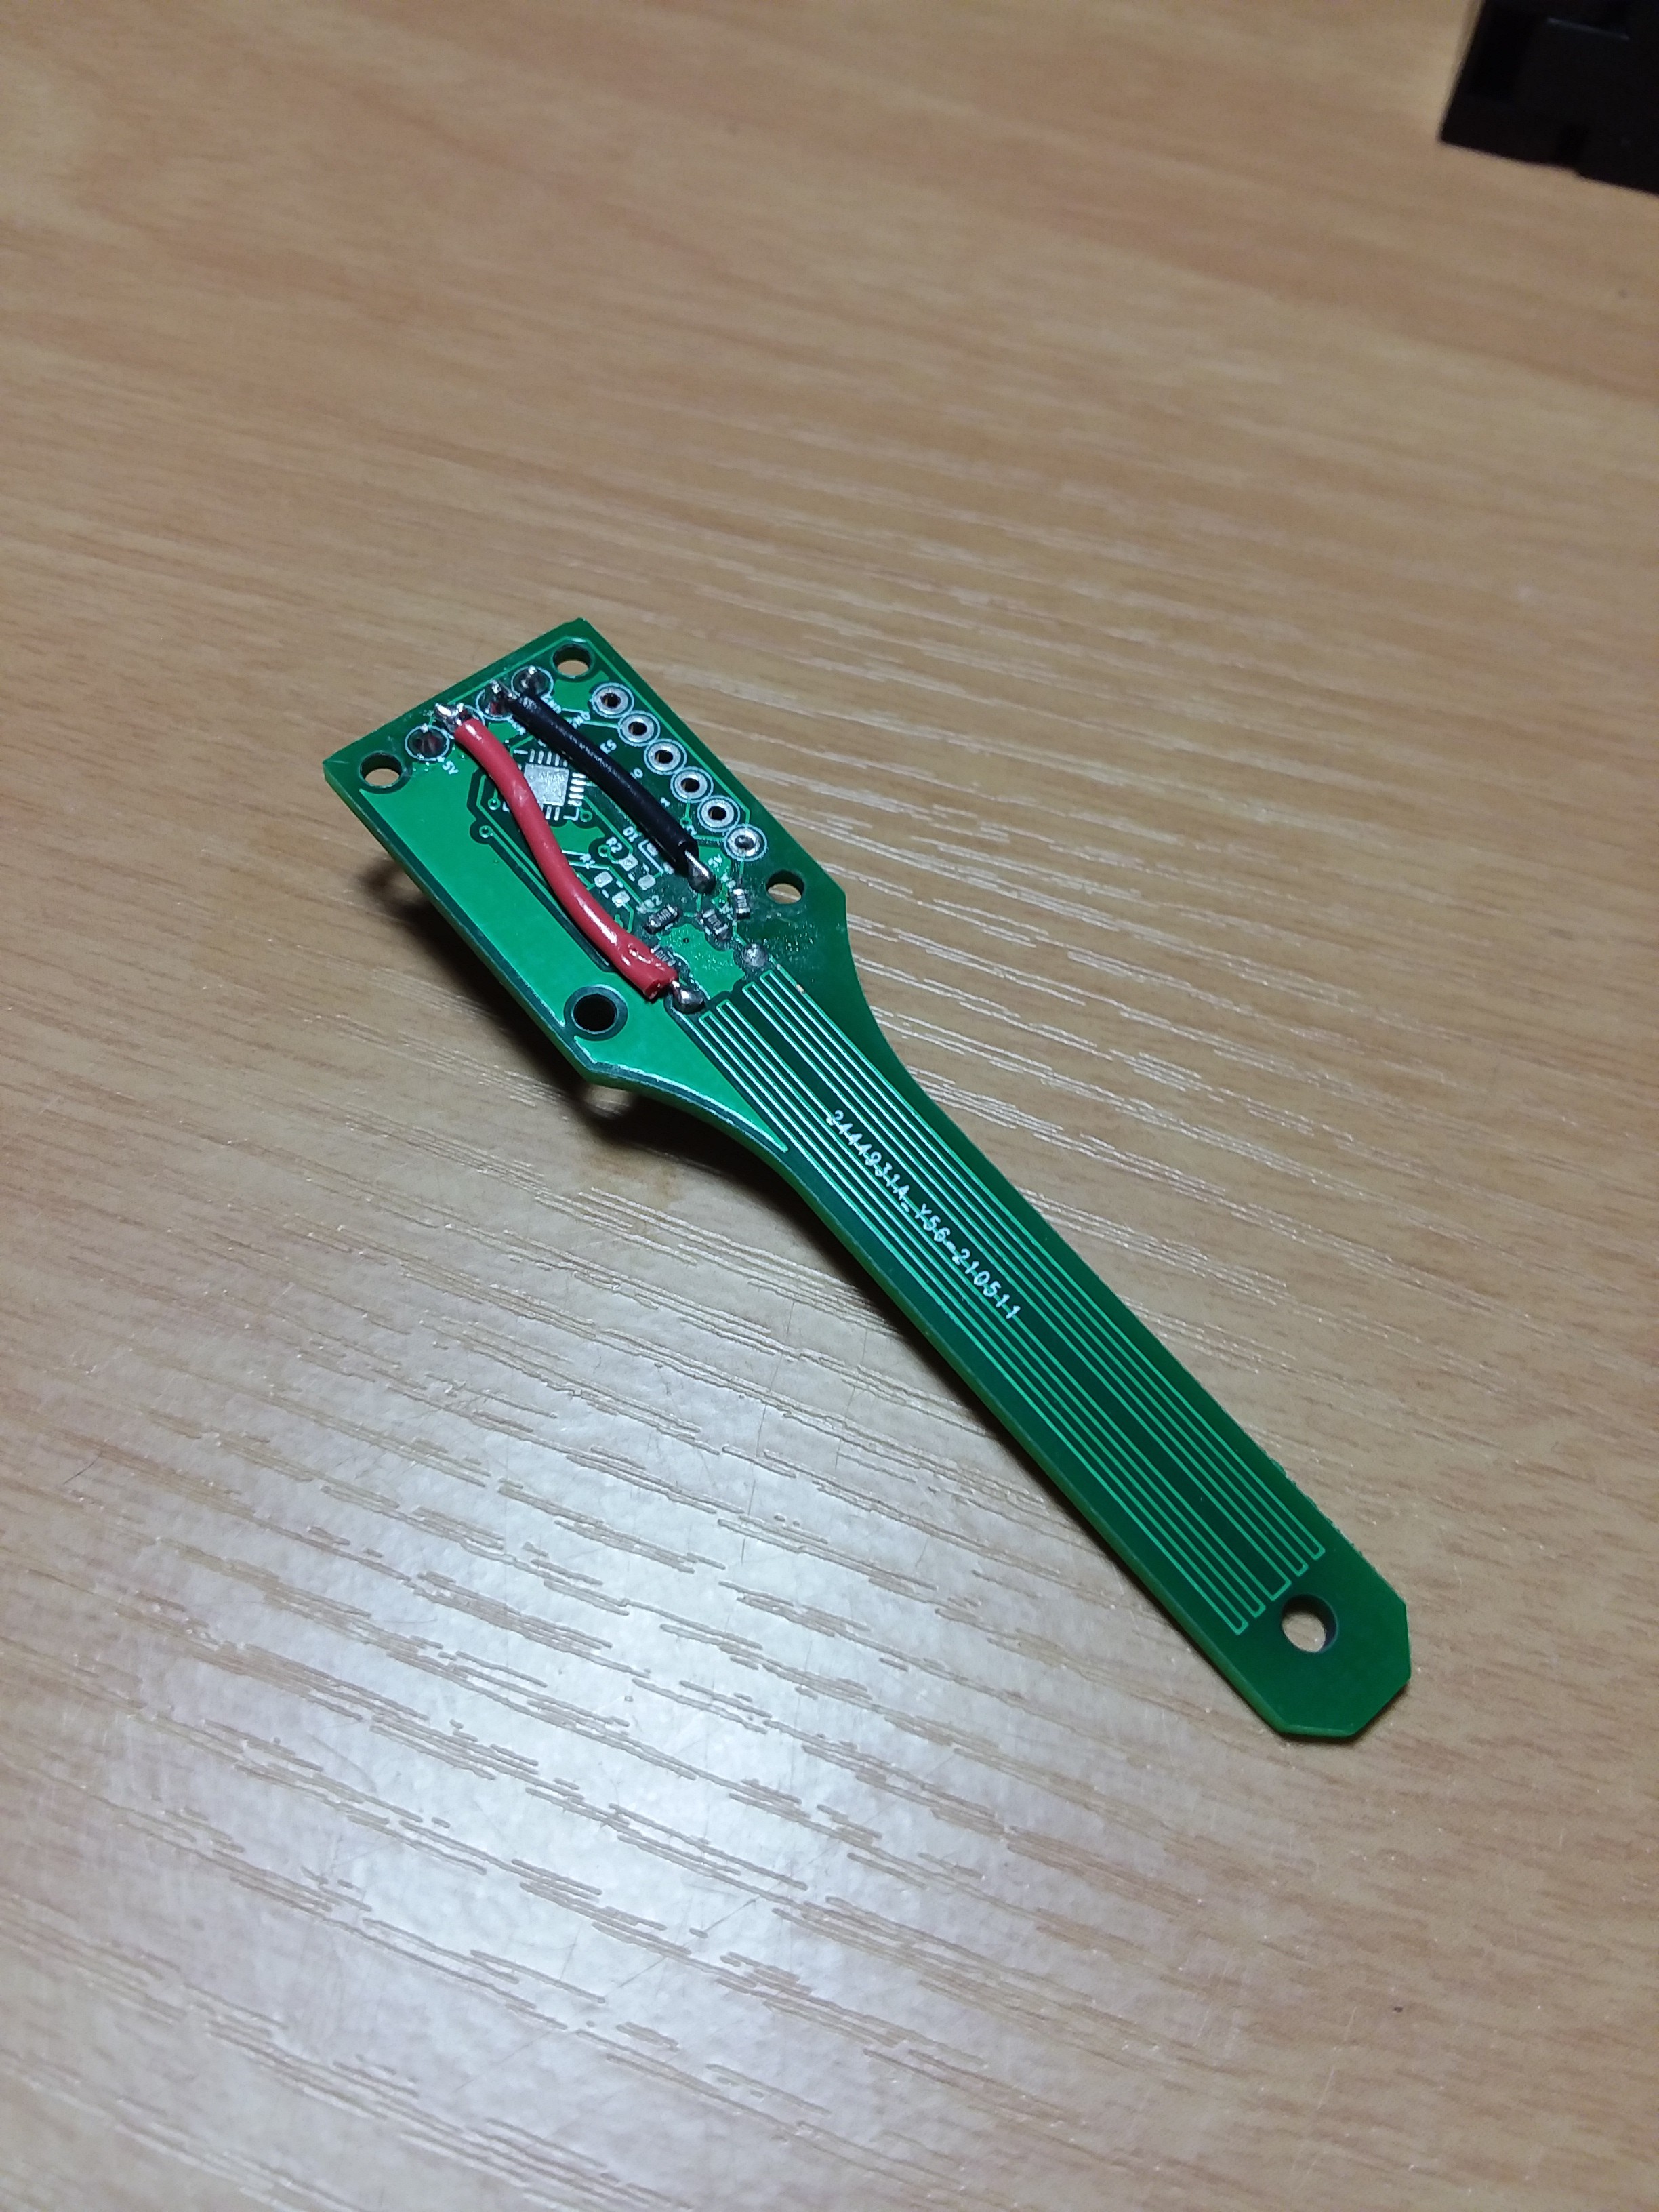
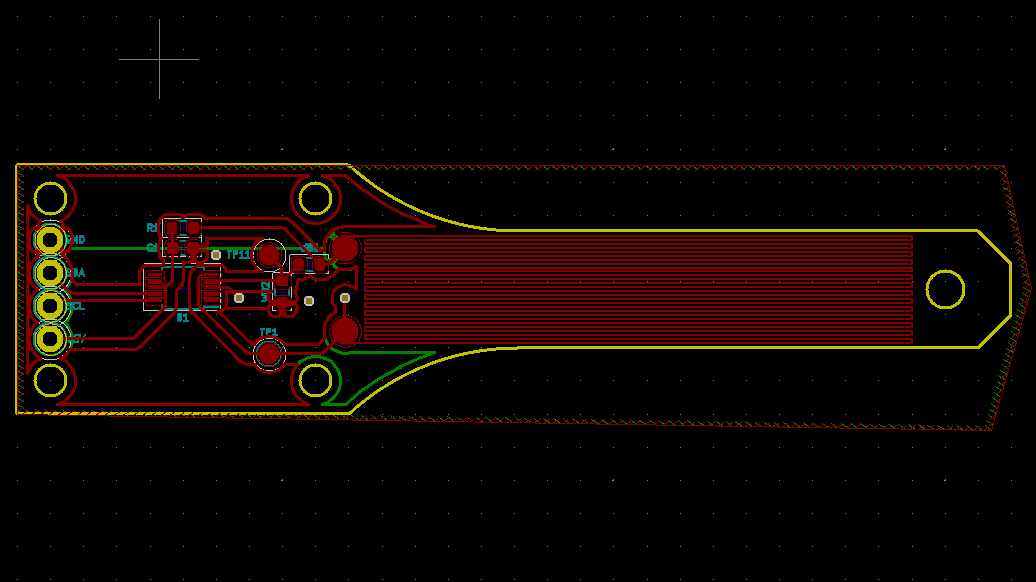
Second PCB Version
To fix the issues of the first PCB, I decided to design a new strain gauge right at the limits of my manufacturer's trace width and spacing capabilities (6 mil and 6 mil). Instead of a quarter bridge, this one would be a half bridge, which means a strain gauge on both the top and bottom surface. One would be in tension and the other in compression, creating a larger voltage difference. Instead of using an ATTiny85, I planned on an ADS 1015, even though you can't actually source them right now. I can always lift one off these breakout boards if everything else appears to be working.
![]()
Maybe slightly better fill areas than the first version? Finally, with this version I could actually detect a change as a result of a physical load! The change wasn't quite as extreme as I would've liked, so I have some more tweaking to do. I'm also currently only at the stage of detecting voltage changes, not translating those into strain or weight yet.
What's Next?
Try to actually calculate strain and weight from the data I'm currently getting and compare those to known weights.
Investigate commercial scales and see if I can set something up with a commercial load cell for comparison.