ogdento
-
Testing the samples!
11/17/2022 at 05:31 • 0 commentsI sent my custom LCD plan off to a few different manufacturers, some I never heard back from but I did finally get a quote I was comfortable with. After finalizing some details regarding order quantity and price, and actually paying for the samples, it was a not-too-long wait for them to arrive. I was a happy guy when the samples arrived!
![]()
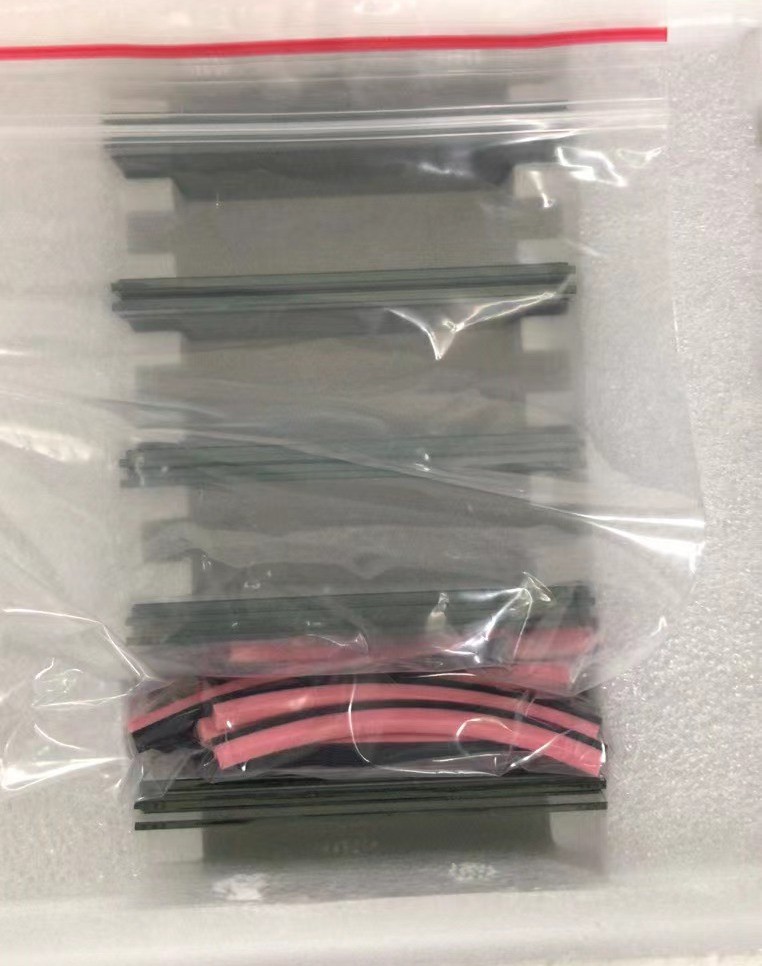
Included in my quote were new elastomeric strips, but I messed up one dimension of the strip and they didn't fit, so I need to re-measure and get new samples of those. Apparently you're supposed to allow some extra percentage for the eventual compression of the strip, but I allowed too much. Live and learn.
In any case, I was able to re-use the original elastomer from the display - which happened to be the older round/hollow elastomer vs the newer pink foam sided strip that seems to be more common nowadays. As this was the first LCD I'd ever designed and had manufactured, I was over the moon when I popped my first sample onto the meter and powered it up... I immediately saw the power on test with all segments on, and breathed a very happy sigh of relief!
![]()
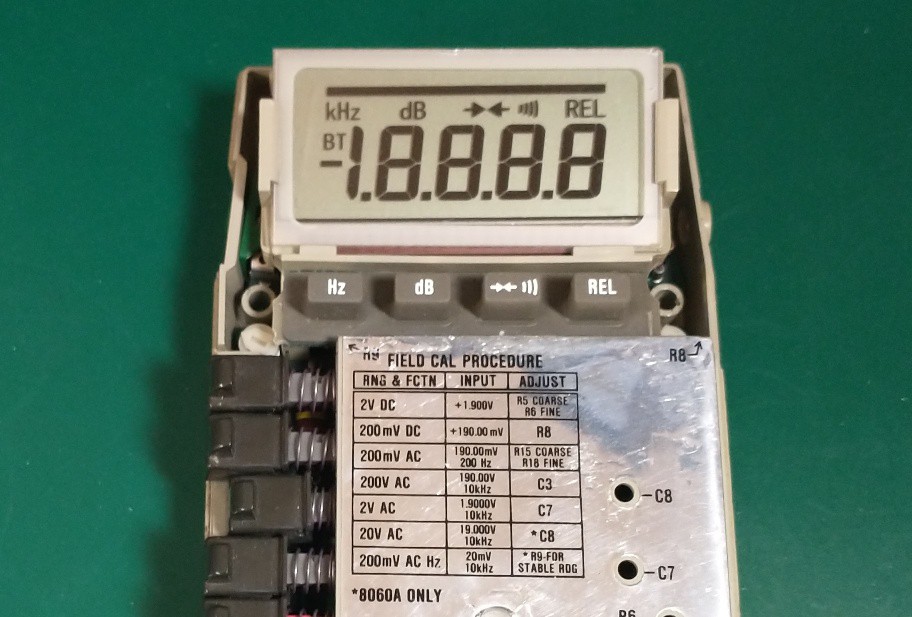
I was pretty pleased with how it came out - especially since I'd never attempted this before! The digits are a little taller and a little skinnier - more like the Fluke 83/5/7 iii series, but I think they look good on the 8060a. The font I chose is a touch larger than the original but is clear and easy to see. Considering I didn't take an exact copy from the manual or a photo - which would have been easier than drawing it all myself - I quite like it!
Now I've got to wait for new elastomers and get to fitting some replacement LCDs in my remaining meters. I'll eventually make these available for sale, but I'm a little ways off yet.
-
Designing the custom LCD
11/17/2022 at 05:21 • 0 commentsDave at eevblog posted an excellent video series on designing custom LCDs, so I watched those a number of times. I also found another eevblog user who posted a great writeup of a replacement LCD he designed for his Tandy/Radio Shack TRS-80 PC-1 (coincidentally I desperately wanted one of these when I was a kid).
The Fluke 8060a manual has a pretty good image of the display... it's not exactly the same as what you see on the glass, but it would have been close enough to use for a replacement. However, I didn't feel quite right copying the work done in the manual, and I wanted to make a few of my own tweaks anyway so I created my own graphics for the LCD.
I used Inkscape to draw the segments how I wanted them... I increased the digit size a tiny bit and also dropped the continuity bar down a little bit from the top of the display so I'd be able to see it better. (with the original display I sometimes struggled to see if the continuity bar was ON, since it wsa so close to the display bezel which often cast a shadow on the top of the LCD)
The LCD details are:
1. Display Type - TN/Positive
2. Polarizer Type - Reflective
3. Drive Mode - 1/2 Bias, 1/2 Duty
4. Operating Voltage - 3V
5. Viewing Direction - 6 o'clock
6. Connector Type - ElastomerThe 8060 display pinout is:
pin  H1    H2
---------------
1    H1
2    cont  bar
3    rel   audible
4    A0    B0
5    G0    C0
6    E0    D0
7    F0    DP0
8    A1    B1
9    G1    C1
10   E1    D1
11   F1    DP1
12   A2    B2
13   G2    C2
14   E2    D2
15   F2    DP2
16   A3    B3
17   G3    C3
18   E3    D3
19   F3    DP3
20   1/2   1/2
21   BT    NEG
22   K     HZ
23         H2
The Inkscape image, the LCD details and the pinout then went into a document that I could send off to an LCD fabricator for a quote.
-
Scoping the display driver
11/17/2022 at 05:02 • 0 commentsThe display in the 8060 is driven by a Sharp SM4a "4-bit microcomputer" which can do up to 68 segments with a 1/2 duty 1/2 bias drive. I didn't have a clear picture in my mind of the waveform that drives the display segments so I poked around a bit with my scope.
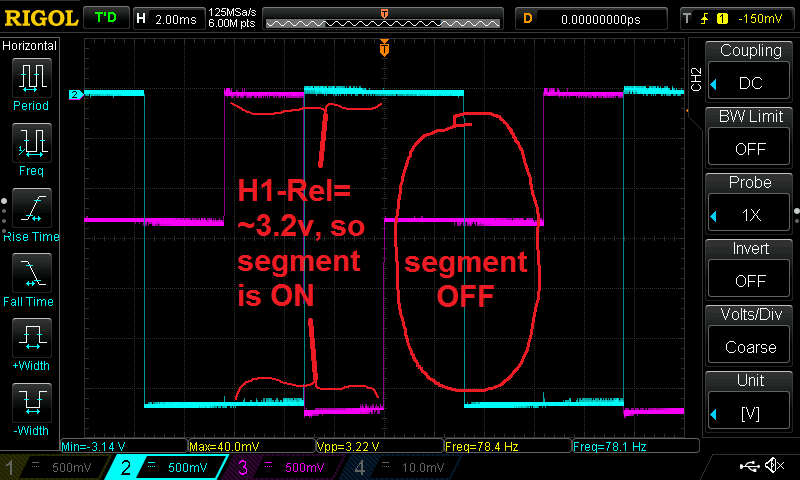
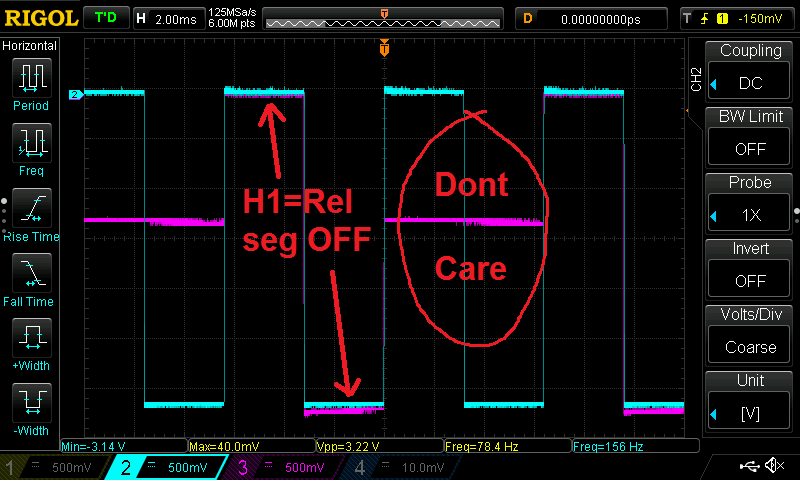
The drive signal is 0 to about -3.2v overall. The segment waveform is a ~156hz square wave, and the H1/H2 are stepped and out of phase with each other. When H1 or H2 and the segment waveform have a 3.2v difference (this will be for half of the H1/H2 cycle), that segment is ON. The other half of the cycle has a difference of 1.3/1.8v and the segment is OFF. The average voltage for the cycle is zero - otherwise the LCD would be damaged.
Here's a shot showing the drive signal for turning on the Rel segement, which is connected to the H1 common (notice that there is a delta of 3.2v - so it's ON - for 1/2 of the cycle):
![]()
Here's the signal when the segment is off (notice that no segments have a 3.2 volt delta):
![]()
Fluke 8060a Custom LCD
I've had a number of 8060s with failed displays and always wanted to design a replacement... so I did!