Close
0%
0%

MetaShunt: High Dynamic Range Current Measurement

A low-cost and accurate tool for analyzing the power consumption of ultra-low power and IoT devices with rapidly changing current usage

Similar projects worth following
MetaShunt is an electronic instrument designed for high-bandwidth, very high dynamic range measurements of the instantaneous current and power and accumulated energy use of low-power and IoT devices between 50 nanoamps and 1,500 milliamps

MetaShunt leverages a simple idea - by quickly and accurately measuring the voltage across a current shunt resistor and engaging additional shunt stages when needed, MetaShunt ensures that it can provide accurate current measurement across a range of approximately 10,000,000:1 (from 50nA to 1,500 mA) without providing significant voltage burden. This range of current is specifically targeted for use with ultra-low power and IoT systems. By measuring current rapidly over time, the total energy use during a given portion of your code can be determined. MetaShunt acts as a virtual ground for your system, so that you can use your battery. Or, MetaShunt can provide 3.3V or 5V to the system under test if desired.

Available now on Tindie here!


Q: Why do you need this tool?

  • You are developing low power electronic projects, and need to know how much power you are using during short wake-up cycles
  • You develop IoT systems, and the power consumption changes drastically during data transmission and you want to measure it
  • You are testing components to validate them against the datasheet, and the current is lower than your multi-meter can measure reliably

Q: Isn't this basically a JouleScope or Otii Arc?

Yes, it is designed for very similar use, but does have significant differences. MetaShunt is designed more for DIY hobbyists than those products are, and that can be seen in price, capabilities, and openness. MetaShunt has an open USB serial interface protocol and example Python interfacing scripts so that users can build their own testing scripts with it. There are no subscriptions or features behind paywalls. 


Q: Can I buy one?

Yes! It is available in Tindie here!
MetaShunt V2 Case Base Model.stl

Standard Tesselated Geometry - 4.14 MB - 08/16/2025 at 17:12

Download

MetaShunt V2 Case Base Model.FCStd

fcstd - 1.82 MB - 08/16/2025 at 17:11

Download

MetaShunt V2 LT Case Model.stl

Standard Tesselated Geometry - 3.45 MB - 08/16/2025 at 17:09

Download

MetaShunt V2 LT Case Model.FCStd

fcstd - 2.17 MB - 08/16/2025 at 17:09

Download

  • Bringing MetaShunt into The Agentic Era

    Jake Wachlin • 09/06/2026 at 21:16 • 0 comments

    Power/current profiling tools like MetaShunt allow us as developers to get deep insight into what our firmware is doing, where it is breaking, and how we can optimize it. My previous log discussed significant updates to the Web UI, enabling deeper insights into the current consumption of products without the need to further develop log parser tools. You can directly see, for example, how much of the energy use is from deep sleep mode vs. periodic wakeup events, without needing to do the math yourself.

    These features are great, but as more and more software and firmware development is being augmented or done in whole-cloth by LLMs, it seemed suddenly obvious that those LLMs would need to be able to verify and test the power consumption of hardware they are working on too. This led me to develop (perhaps unsurprisingly with the help of an LLM) the open-source (MIT License) MetaShunt MCP server, available now on Github here. 

    MetaShunt MCP

    This project is a Python-based locally-running tool which provides a Model Context Protocol (MCP) interface to LLM tools you are using. It exposes interfaces to read decimated continuous or burst streamed measurements, so that the LLM can kick off measurements and validate against firmware it is measuring.

    What On Earth Does That Mean?

    OK, if you aren't deeply in the AI world, that prior word salad may not mean much to you. Let me show an example of just how powerful this is.

    In my example setup, I am using OpenCode as my harness, OpenRouter for model access, and DeepSeek V4 Flash as my model. I have only recently been using this model, and WOW. While not the most intelligent model, it is certainly capable of autonomously developing fairly significant projects (such as MetaShunt MCP) with minimal guidance and support, for literal pennies of cost. The cost vs. value ratio is off the charts. The entire development of MetaShunt MCP cost less than $0.30 with this setup. "What token spend?"

    Let's say I want to use this model for development of an embedded system. As an example, consider my Nanosleeper project, which was my finished project to build a dev board which can deep sleep at under 100nA total, while maintaining the ability to wake at a desired time. This project has a base open-source firmware here.

    The Setup

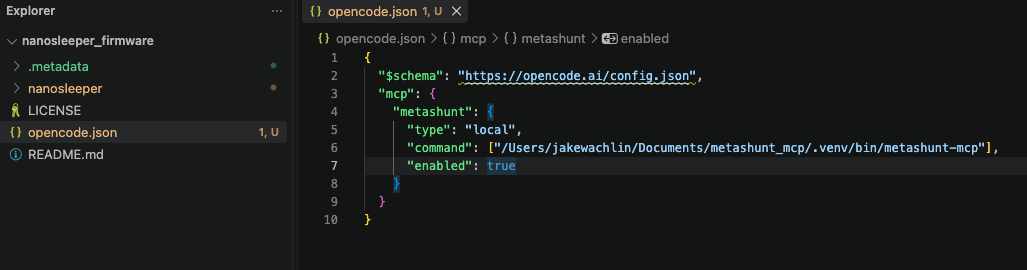
    I cloned both the Nanosleeper firmware repo and the MetaShunt MCP repo to my Documents folder, and then opened up the Nanosleeper project in OpenCode as a project. I then added opencode.json to the base of the folder, to let OpenCode know that I have an local MCP server at this location (more info on this setup process is on the MetaShunt MCP readme, and the LLM itself can also help you set this up). Restart the OpenCode window for this to take effect.

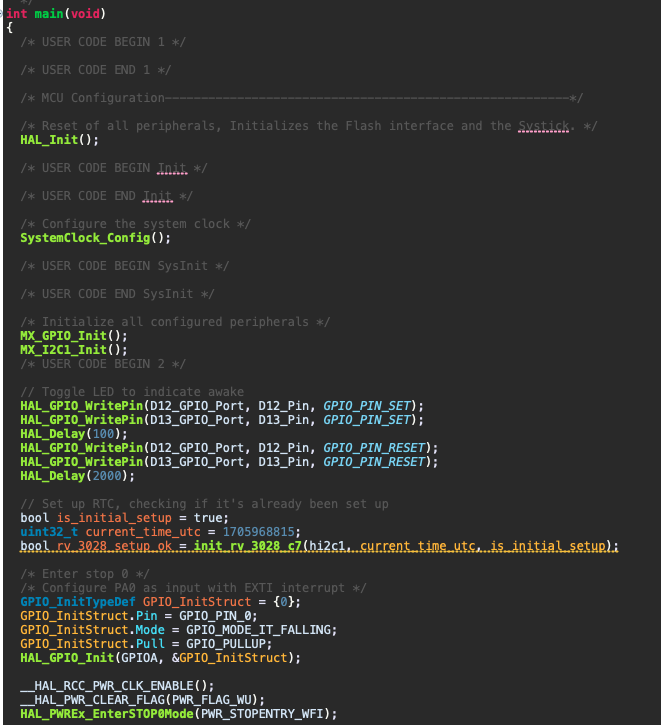
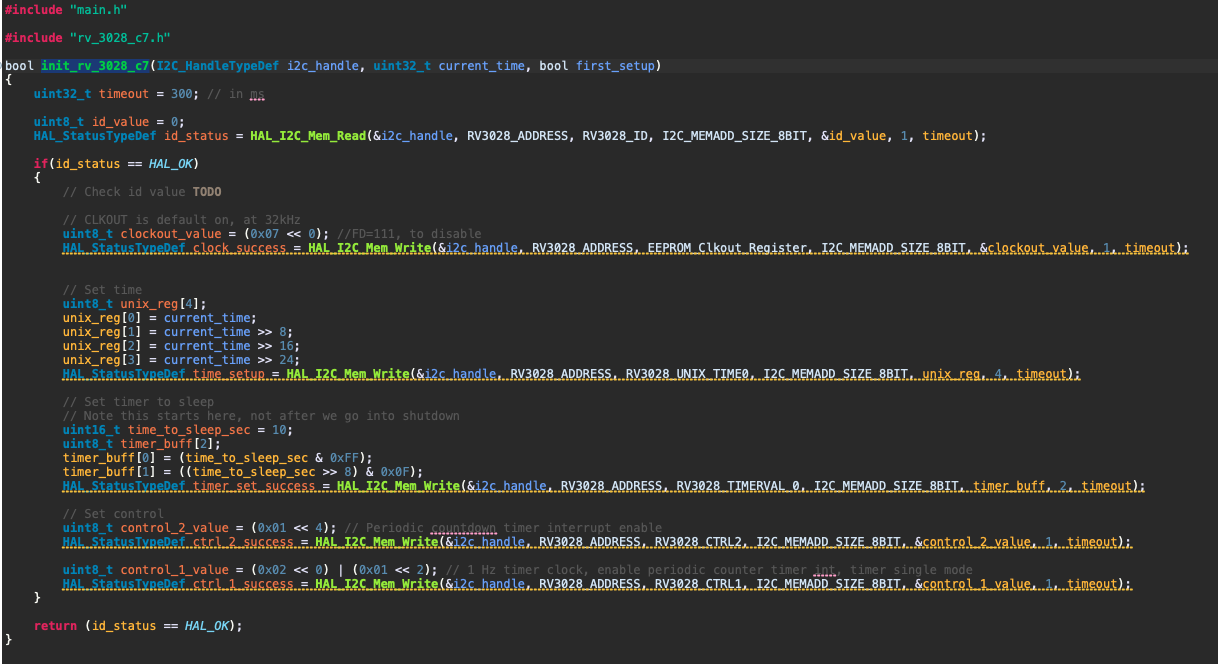
    The firmware for Nanosleeper is pretty simple. It is just meant to be a "Hello World" program for customers, and to provide a working example of sub-100nA deep sleep. The hardware is first configured. Then, two LEDs are turned on for 100ms, then back off. Then, the CPU busy-waits for 2 seconds. The external RTC (that will provide the wakeup in 10s) is initialized, and then the MCU enters STOP0 mode. It will be woken up by an interrupt from the RTC in 10s.

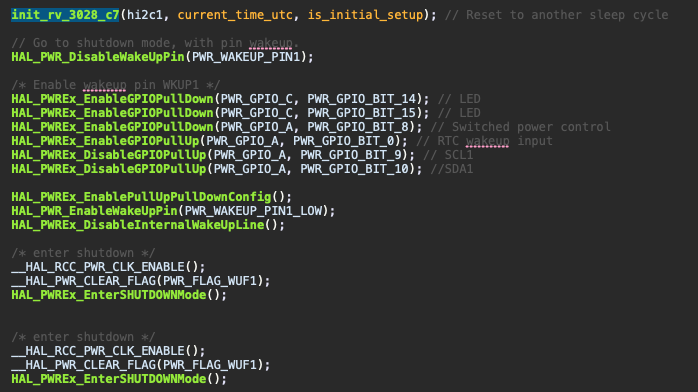
    After the wakeup from STOP0 mode, the RTC is initialized for another 10s wakeup cycle, and the MCU enters shutdown mode, where its consumption drops to 10s of nA. Wakeup from shutdown mode is effectively a POR, so the whole program starts over again.

    The Prompt

    You may then think that using the LLM to power profile this system is complicated and you need to be an uber-engineer. In fact, the opposite is true. I simply asked the LLM in simple language (and with a typo, oops!) to review the firmware, use the MetaShunt MCP server to power profiler, and to make recommendations. That's it! Believe it or not, but this was the very first attempt at connecting a project to the MetaShunt MCP, after the model already one-shot developed the MCP server. Wow. You can see that it immediately finds the...

    Read more »

  • MetaShunt Web UI: Major Upgrades

    Jake Wachlin • 09/06/2026 at 02:09 • 0 comments

    Over the last few weeks I've been pouring a lot of the work into the web UI, and I wanted to walk through the features that have been added. They've come together very nicely, supporting the workflows I use MetaShunt for.

    The whole thing runs in the browser over WebSerial — no desktop install, no Python, just a Chrome/Edge/Chromium tab and a USB cable. Get measuring in seconds. Or, if you don't have a MetaShunt, use the demo unit feature (more on that later) now, and check it out here!
    Additional Plots

    A single current-vs-time trace is fine for eyeballing a waveform, but it hides the structure of the current consumption. The UI now includes a small stack of derived charts that display that structure directly, and help the user identify where to focus on their current reductions efforts.

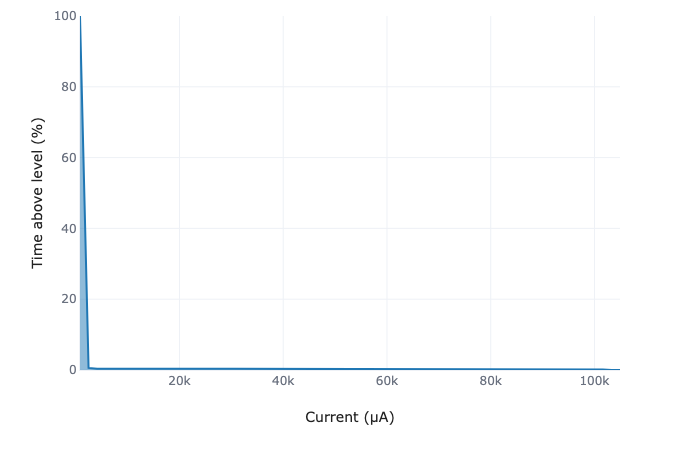
    There's an occupancy curve (cumulative time spent above each current level) — the fast way to see "this device spends 99% of its life at 1.5 µA and 0.1% of its life at 100 mA." 

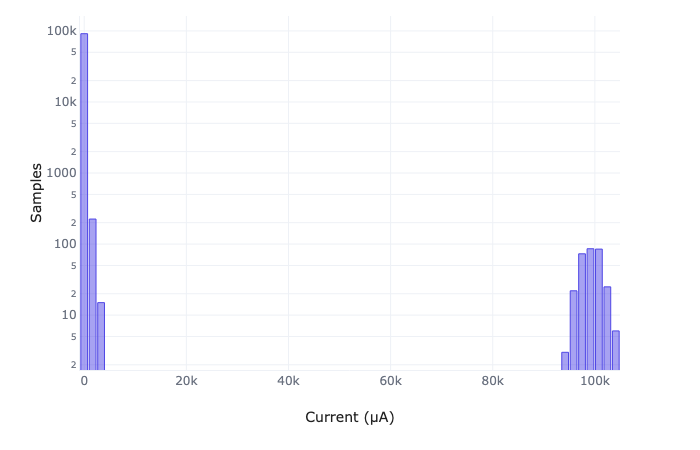
    Next to it, a current-distribution histogram on a log y-axis so the rare-but-important high-current bins don't get crushed flat against the sleeping majority. 

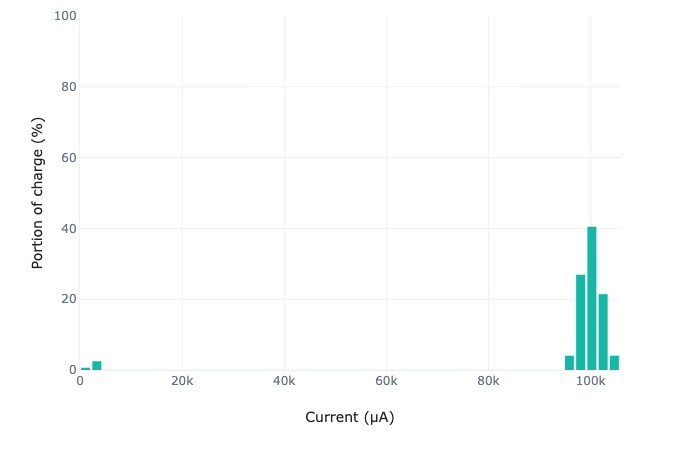
    Then a charge-share plot by current bin: instead of "how often am I at each level," it shows "what fraction of my total charge is burned at each level," which is the plot that tells you where to optimize first. In this example, even though most of the time is spent sleeping, most of the charge is consumed by short, high current bursts.

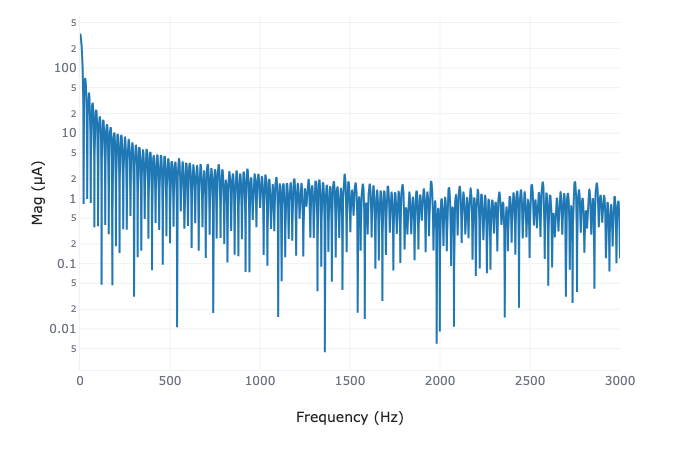
    There's also an FFT spectrum for when you're hunting periodic issues or noise impacts. It won't compute over decimated data (more on that next) — that would be meaningless — but for a clean continuous run it can help you debug periodic issues.

    Decimation Support

    Long captures are where profilers can struggle. At 6 kHz, a couple minutes of sampling is a few hundred thousand points, and plotting the whole thing gets sluggish fast. The UI now has a proper decimation mode to handle this without losing the parts that matters: the profile shapes, wakeup timing, and total energy used.

    You enable decimation with one button and pick a relative-change threshold (0.1% to 10%). The decimator emits a new point only when the signal wanders beyond that threshold relative to the last decimated point — or after a max span, so perfectly stable current still gets compressed instead of ballooning. Crucially, every emitted point is the time-weighted average over its interval, so the area under the curve — the integrated charge — is preserved.

    The compression numbers are shown, too: a small pill in the stats bar shows the active intensity, how many raw points came in, how many survived decimation, and the estimated memory the compressed store requires. The sliding live view always stays full-resolution; decimation only affects what's retained and what you export. Slide the threshold up to 10% for maximum compression, or down to 0.1% to limit the compression level.

    Data Labeling

    Captures are only as useful as your ability to understand them. The UI has a two-click region label system plus quick point labels, both rendered straight onto the current plot.

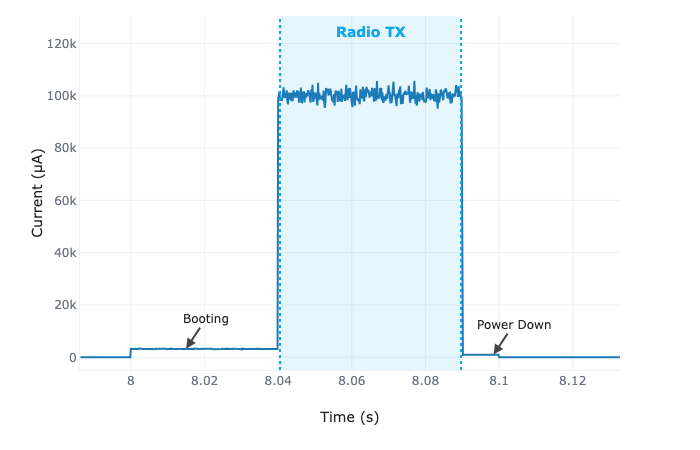
    Click "Add Region Cursors," click a start and end boundary on the current plot, and you get a shaded region with a prompt to name it — "Radio TX," "Boot," "Flashing." The name sits right on the plot, so a capture is self-documenting when you come back to it (or email it to a colleague). For a single spike or event, click directly on the trace and type a label at that exact sample; it's anchored with an arrow so it survives zooming and panning. 

    Demo Data Mode

    One of the most useful little additions doesn't involve the hardware at all, but it's one of the fastest ways to kick the tires on the whole interface. A "Start Demo" button streams synthetic, realistic data through the exact same pipeline as the real MetaShunt — same plotting, same decimation, same labelling, same import/export — without...

    Read more »

  • Web-Based UI for MetaShunt V2

    Jake Wachlin • 01/31/2026 at 17:04 • 0 comments

    Although the current Python UI is sufficient for using MetaShunt V2, it isn't the most user-friendly. Those who know Python and/or are developers may find it easy enough to set up, and may prefer the ability to script the interface, but I wanted to make a simpler option. Therefore, I built a new, modern GUI for MetaShunt V2 which is hosted on Github Pages and provides a web-based interface using webserial. It is cross platform, works on Chrome and Edge, and requires no installation! Check it out at https://jwachlin.github.io/metashunt-web-ui/ or check out the source at https://github.com/jwachlin/metashunt-web-ui.

    Using this GUI, you can make measurements, zoom in and out on charts, export data as a CSV file, export plots, and import past measurements for side-by-side comparisons. It supports continuous measurement as well as burst-mode measurements. Try it out and let me know what you think!

  • Power Profiler Kit II (PPK2) vs MetaShunt - Accuracy Implications for Ultra Low Power and IoT

    Jake Wachlin • 12/23/2025 at 18:45 • 2 comments

    After confirming the better than 1% calibrated accuracy of MetaShunt V2 in the previous logs, I wanted to go back to compare results against the Power Profiler Kit II (PPK2) from Nordic Semi. The PPK2 is the go-to power profiling tool for most hobbyists, but the +/- 10% accuracy of the PPK2 can lead to issues in power profiling. With that level of uncertainty, it can be difficult to discern issues with firmware. Is that subsystem of your project actually off? If it takes 10% of expected current, how do you know? 

    This blog post will cover three topics. First, a very low power example with the Nanosleeper development board, looking at current measurements and what that implies for battery life estimates. Second, focusing in on the implications of accumulated charge measurement, and how MetaShunt V2 LT separates the measurements from being tied to a computer for long-term measurements. Third, a higher power ESP32 example, comparing the results between the PPK2 and MetaShunt V2 for IoT applications. Let's take a look!


    Nanosleeper Current Monitoring

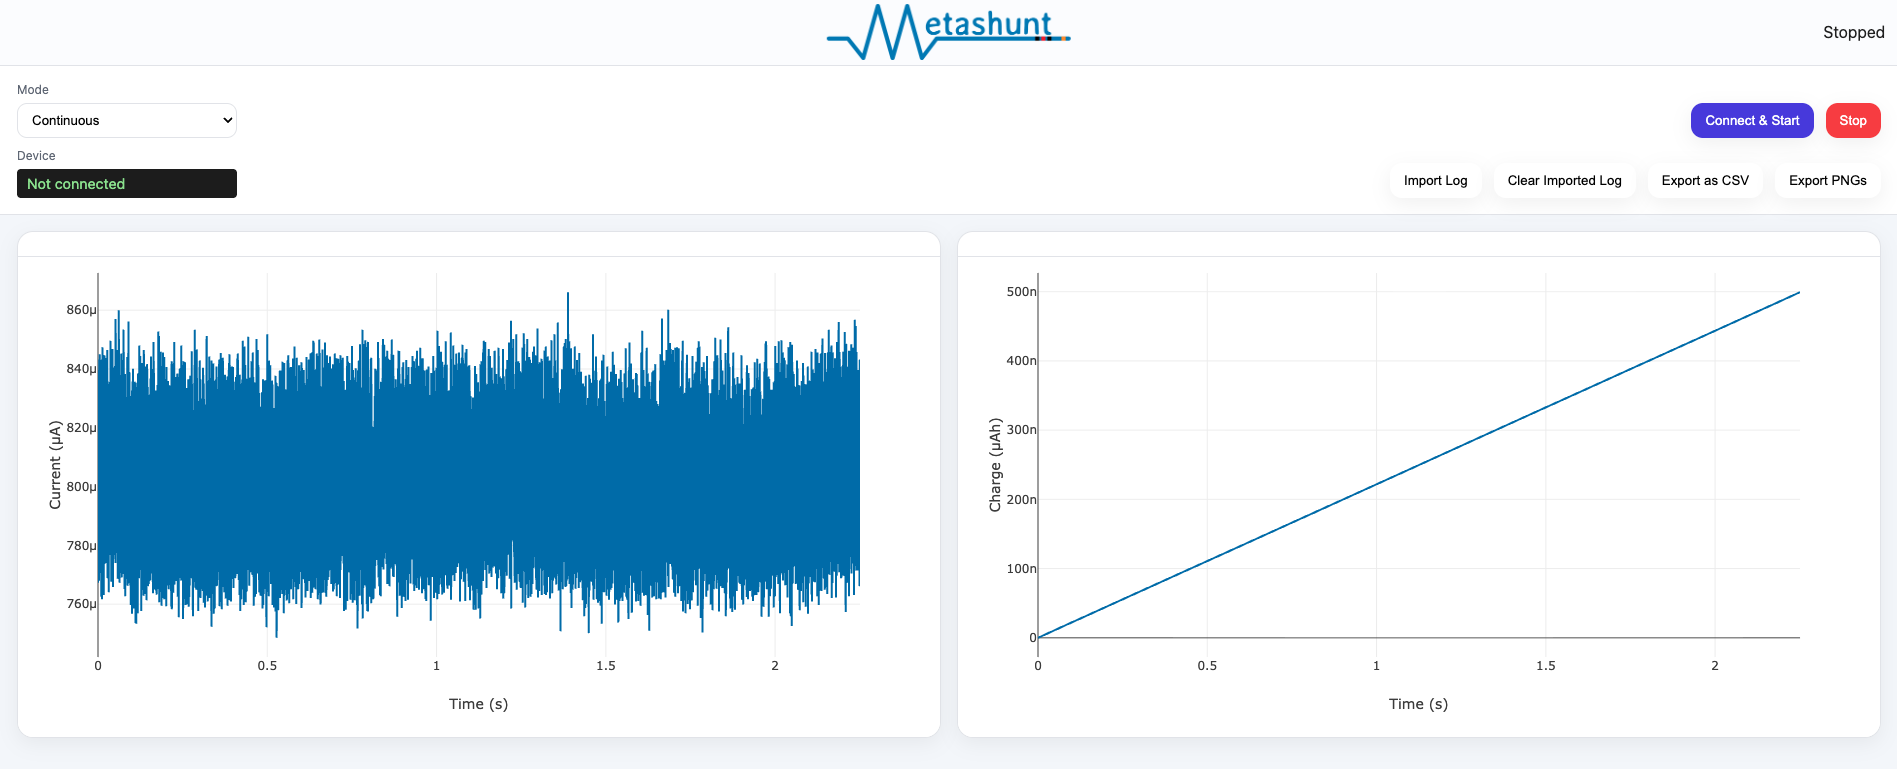
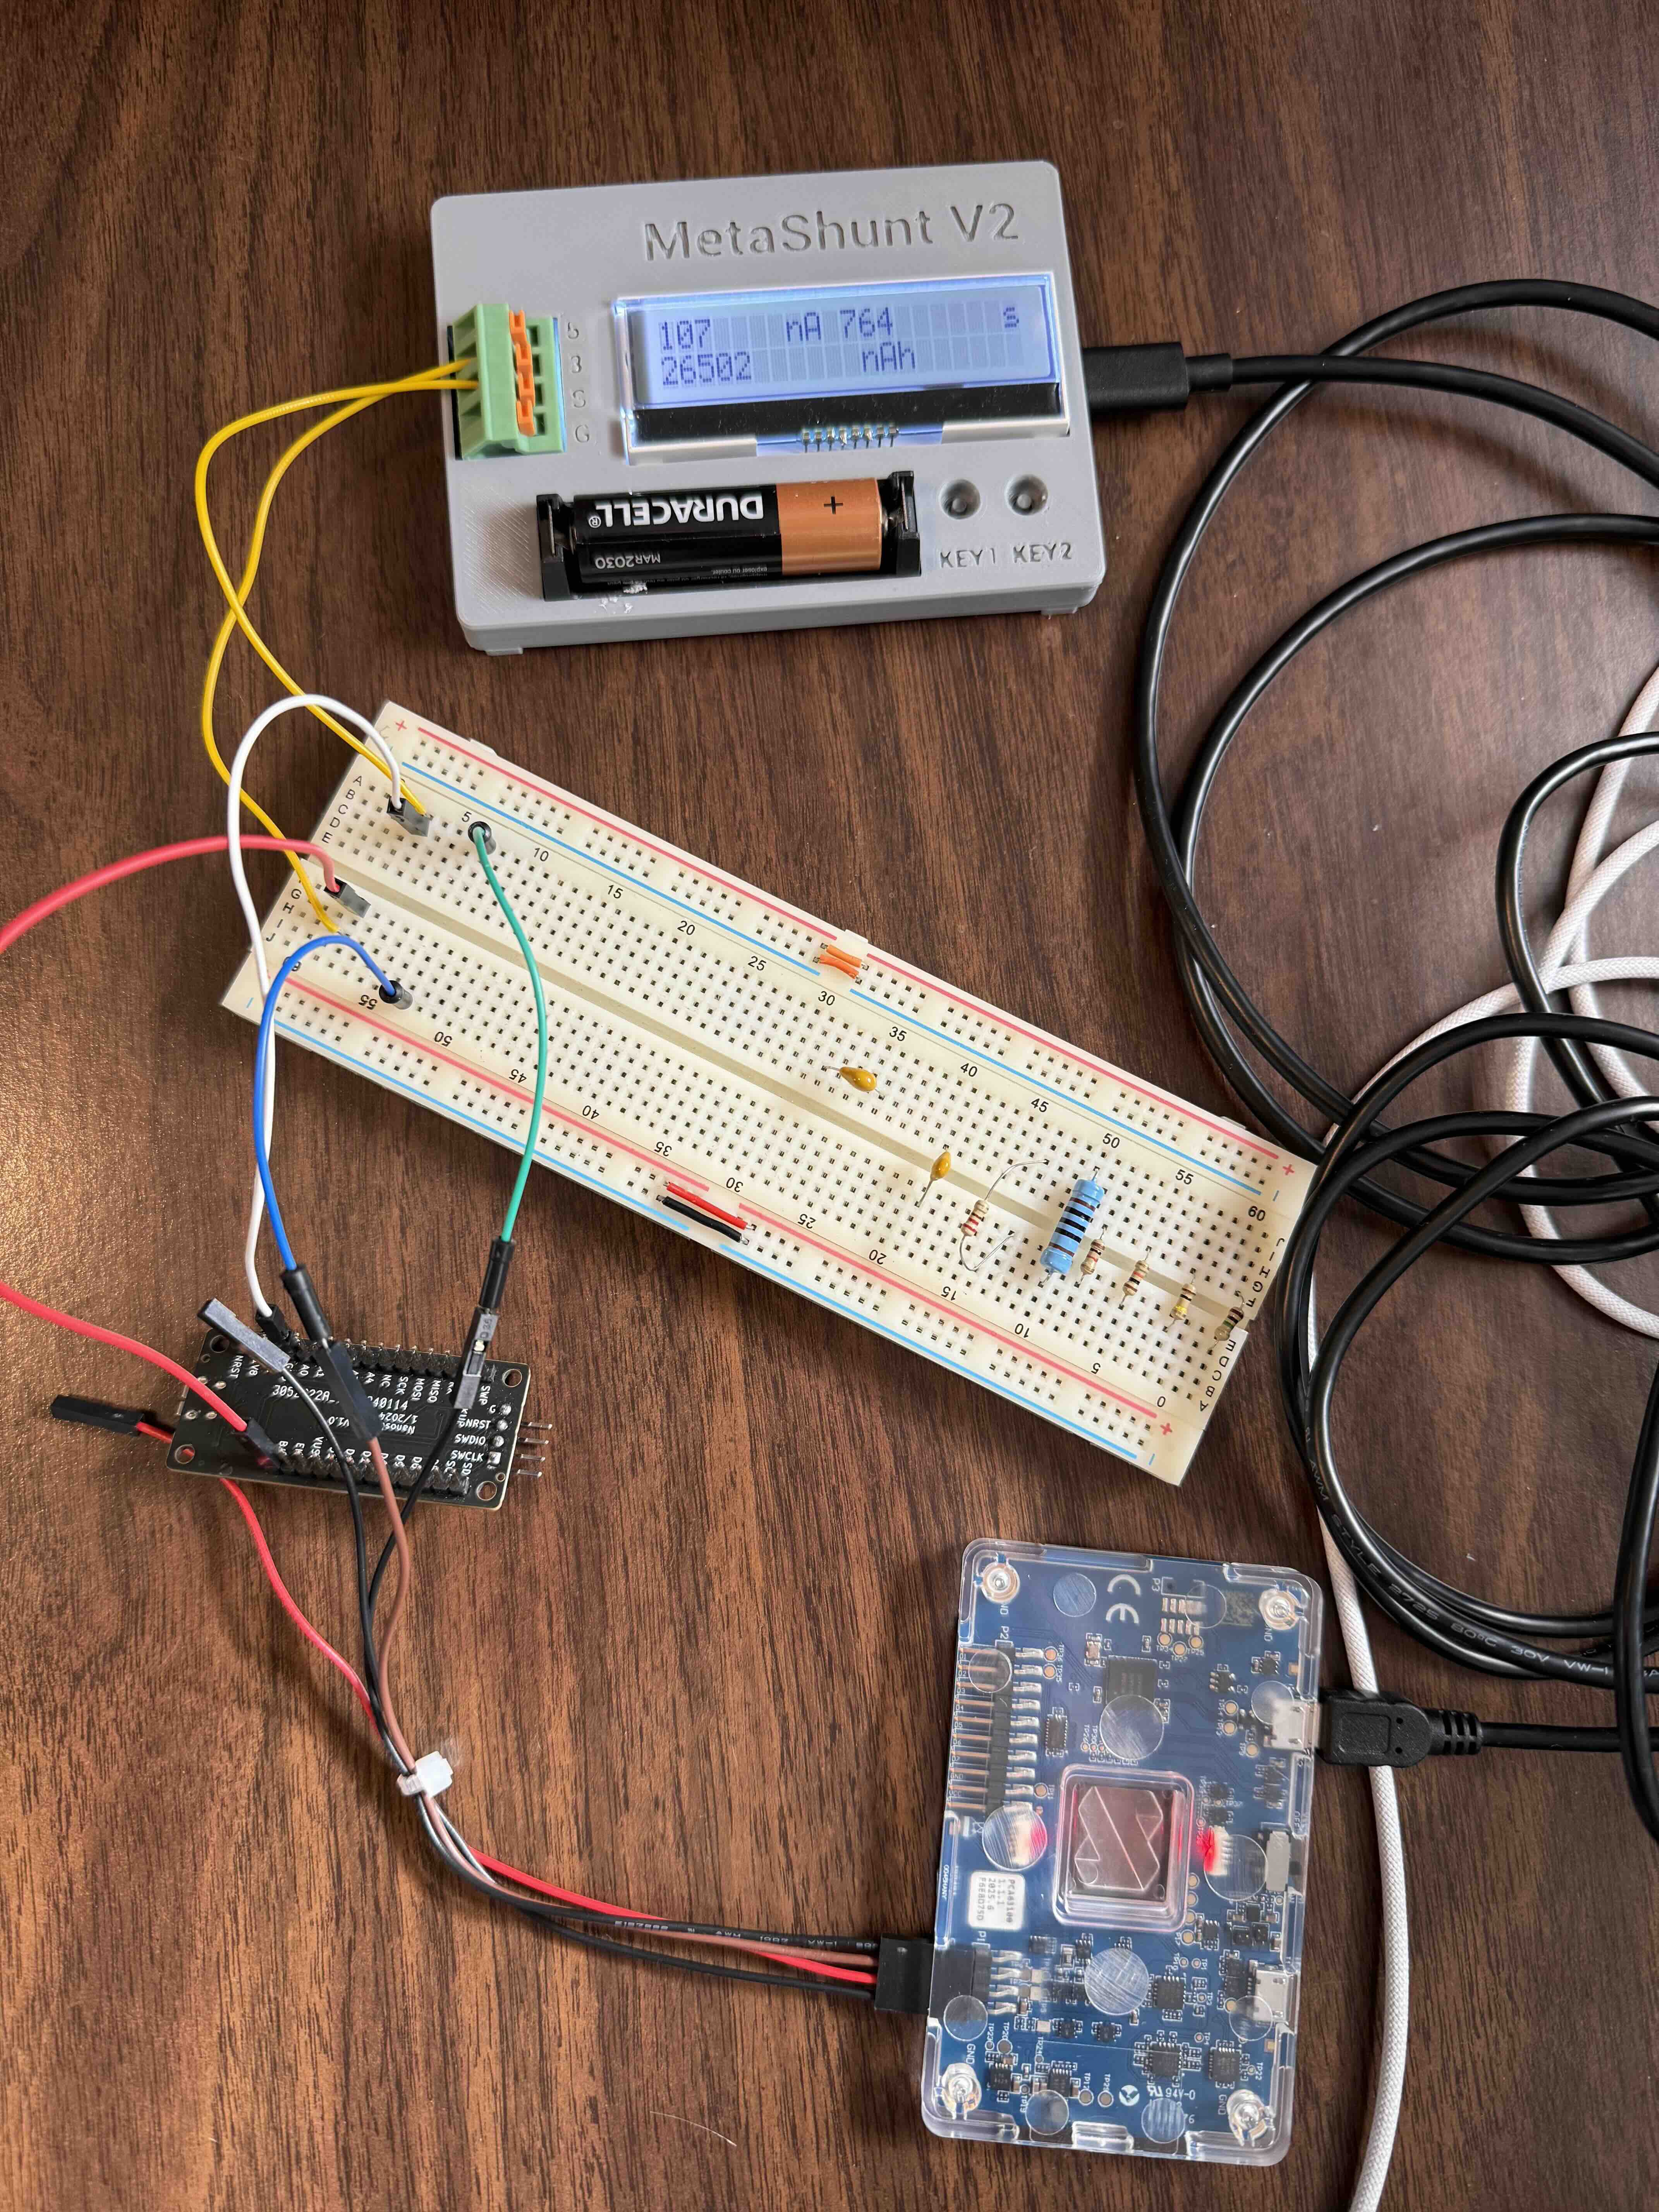
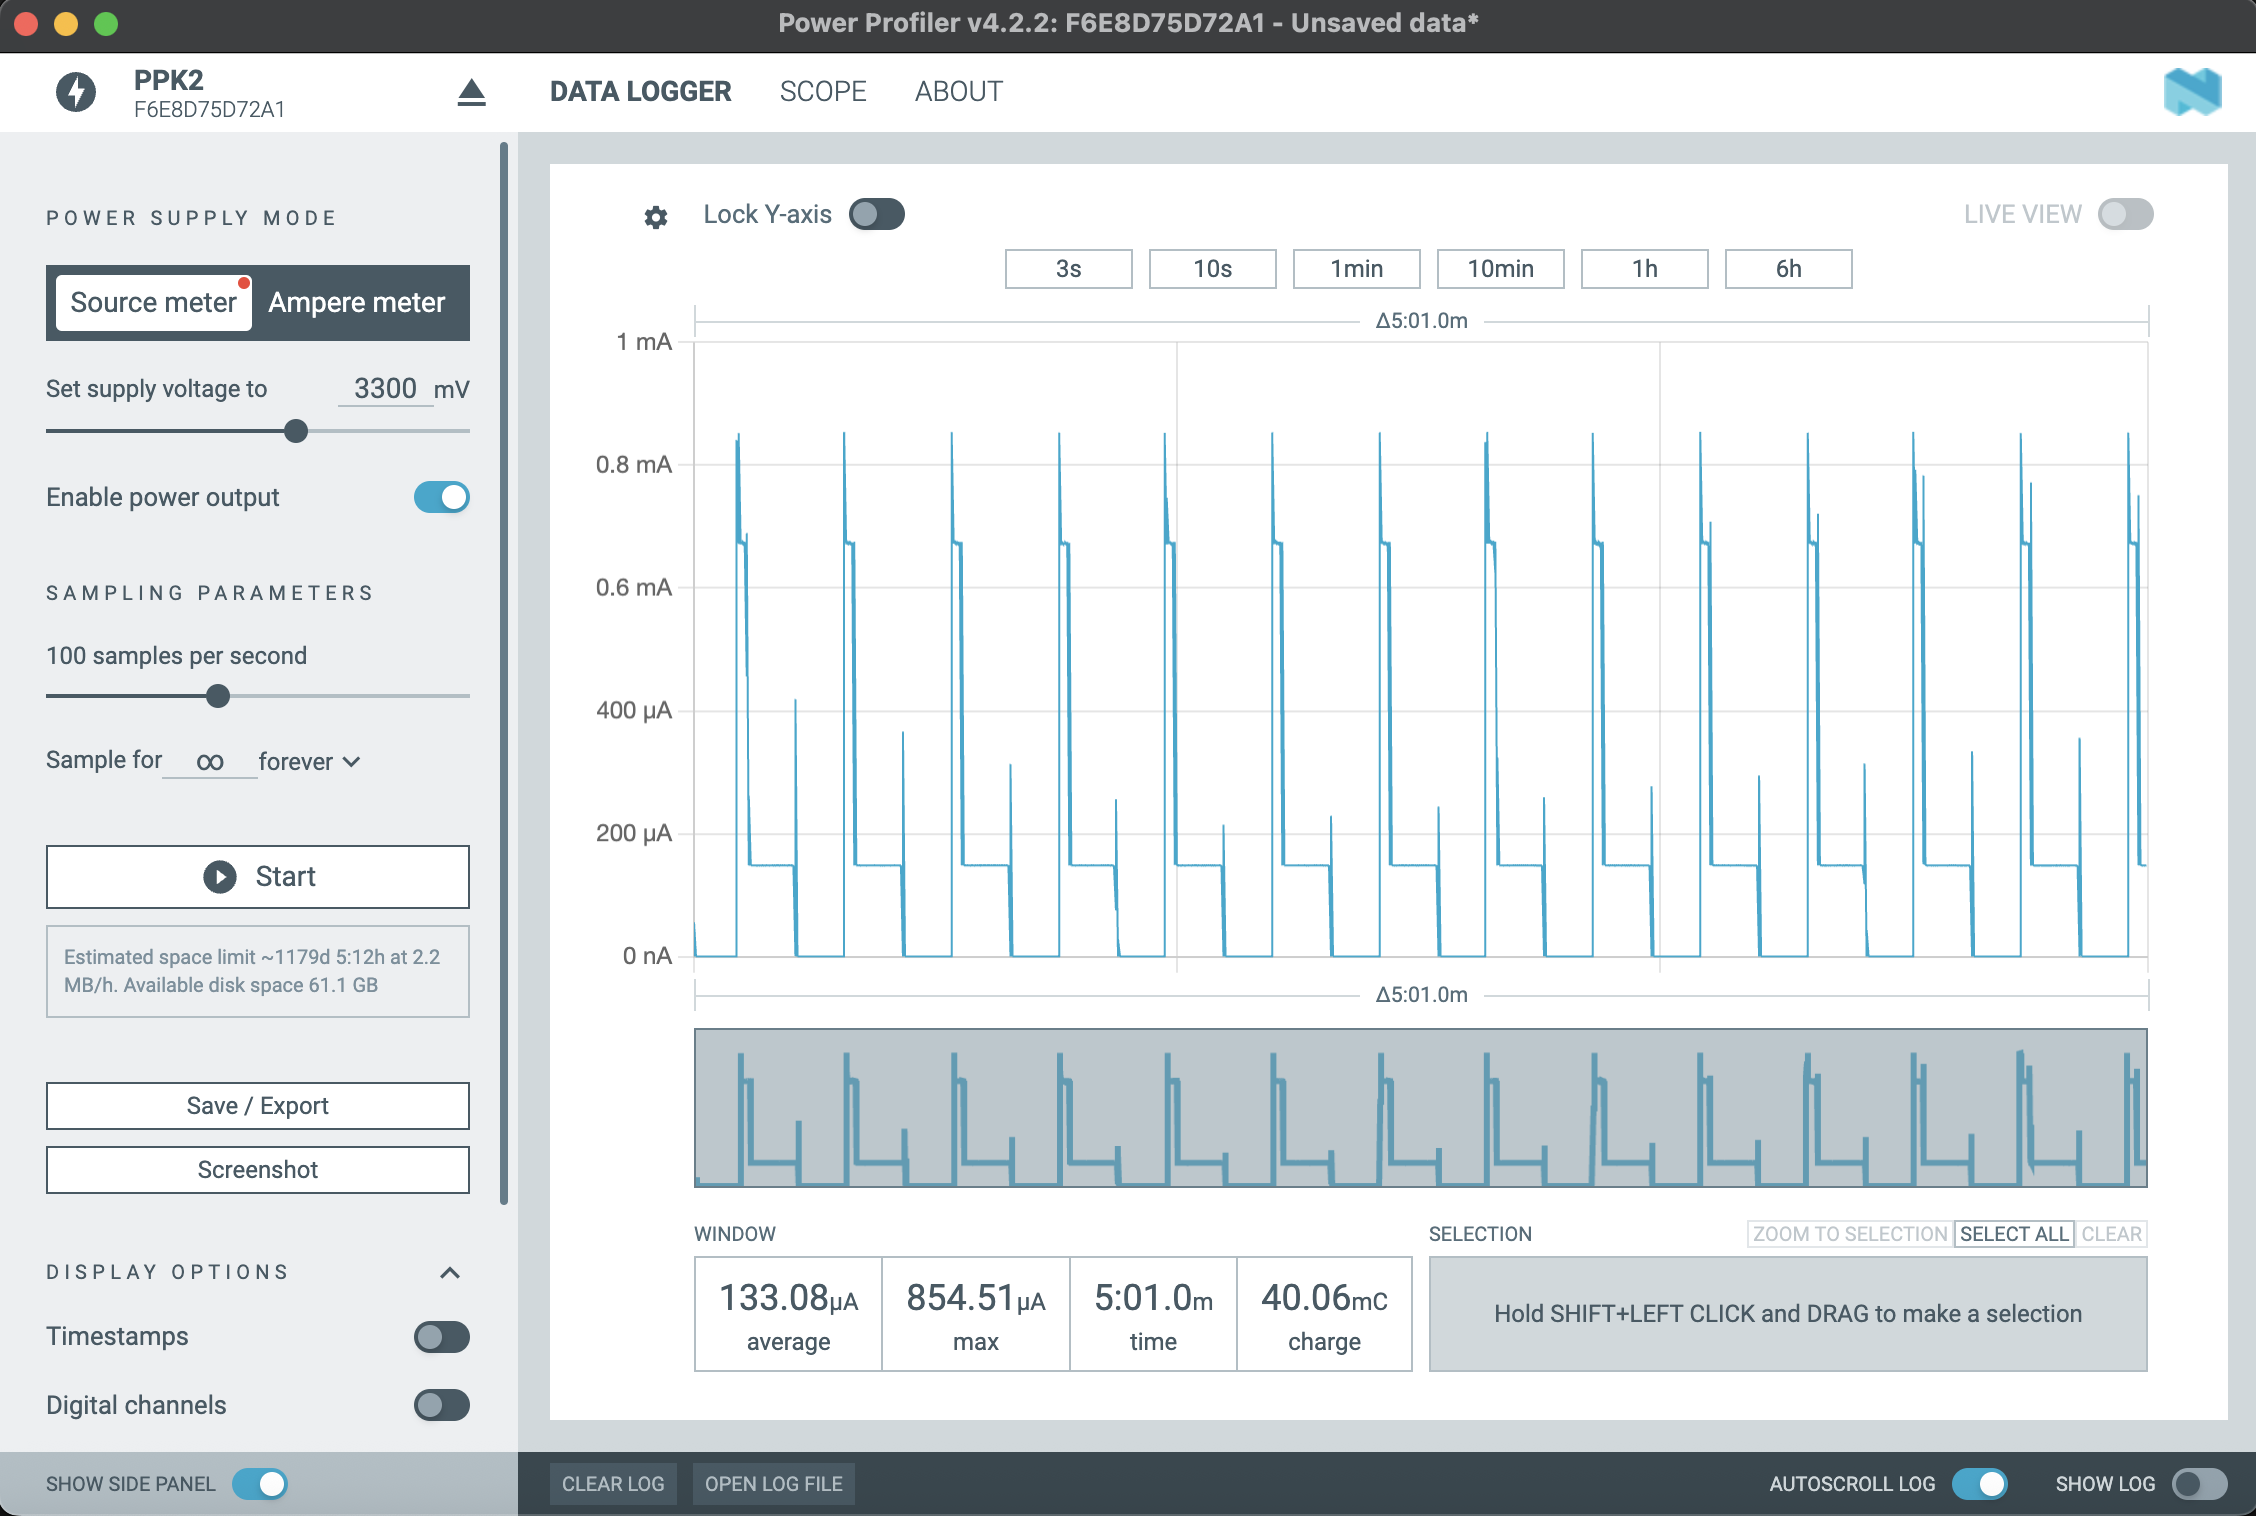
    Nanosleeper was set up to periodically wake up, flash LEDs, busy wait, enter low power mode, then enter deep sleep. The pictures below show the physical setup, and screenshots from the PPK2 GUI and the MetaShunt V2 GUI.

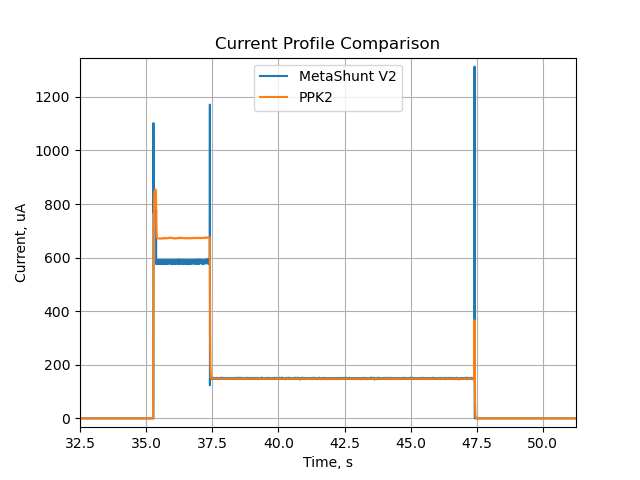
    From these views, it is hard to tell what's going on. If you didn't know better, you might believe that the PPK2 results are reliable, since the profile matches what is expected. However, when we plot the data on top of each other and zoom into a single wakeup cycle, we can see the significant differences in results. The current is especially different in the busy wait section, where PPK2 indicates the current is about 673uA, while MetaShunt V2 measures current at 584uA. This difference of 89uA is 15% larger than the MetaShunt's measurement! Note that the apparently higher noise of MetaShunt V2 is because in this test the PPK2 data was averaged out to 100 S/S, while the MetaShunt data is about 6,000 S/S.


    Nanosleeper Charge Accumulation

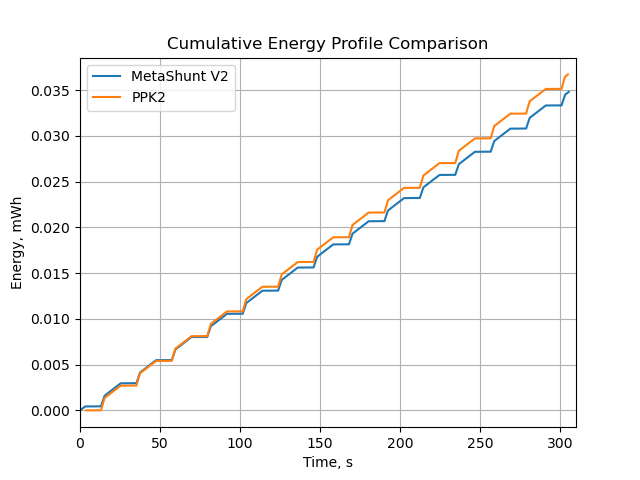
    One key feature of MetaShunt V2 LT is the ability to, without a computer externally recording and accumulating data, monitor accumulated charge. The PPK2 GUI can do this, but requires logging of data, which adds up quickly and is logistically difficult over days-long or months-long tests. For this example, we also compare the energy over time (assuming 3.3V) for both MetaShunt V2  and PPK2. This is shown in the plot below. Note it diverges over time.

    From the PPK2 GUI, we see a charge accumulation of 40.06mC over 301s. I took a picture of MetaShunt V2's display at 300s, which indicated 10,335 nAh. If we scale the PPK2 data back to 300s, it is 39.93mC, or 11,092 nAh. This is a difference of 7.3%, which can be quite significant! As we saw in the previous section as well, the biggest inaccuracy was during busy wait mode, and if Nanosleeper was in busy wait mode for a larger portion of time, this charge accumulation difference would be larger. Remember also, if this test were longer than 5 minutes (days-long or months-long), the PPK2 would need to be actively logging to a computer with GUI up and computer not going to sleep, while MetaShunt V2 can simply be connected to any USB power supply.


    ESP32 Comparison

    To compare a higher-power, IoT focused example, I powered an ESP32 development board with the PPK2, while using the MetaShunt V2 LT as a low-side, long-term charge accumulation measurement tool. Due to isolation issues, it wasn't possible to have both log simultaneously, but we can compare the total charge accumulation after 5 minutes. The pictures below shows the connection and the results from the PPK2. Note that the current is significantly higher than the Nanosleeper tests.

    The screenshot and image below show the PPK2 results and results from the MetaShunt V2 LT after 5 minutes.

    Over 302.6 seconds, the PPK2 measured 2.78C, which scaled to 300s is 2.76C. This is equivalent to 767uAh. MetaShunt V2 LT measured...

    Read more »

  • Calibration Tool Completed and Accuracy Tested

    Jake Wachlin • 12/21/2025 at 19:06 • 0 comments

    I built the calibration tool mentioned and prototyped on the previous log, and it is open source and documented on another Hackaday project here. This calibration tool can provide a precision current supply to MetaShunt, which we can use for calibration and performance testing.

    I recently analyzed the accuracy of the precision current supply here, and showed that the accuracy is quite good, typically better than +/-0.3%. A calibration script using a fixed reference device was developed and used on MetaShunt V2. This script is open source and listed here.

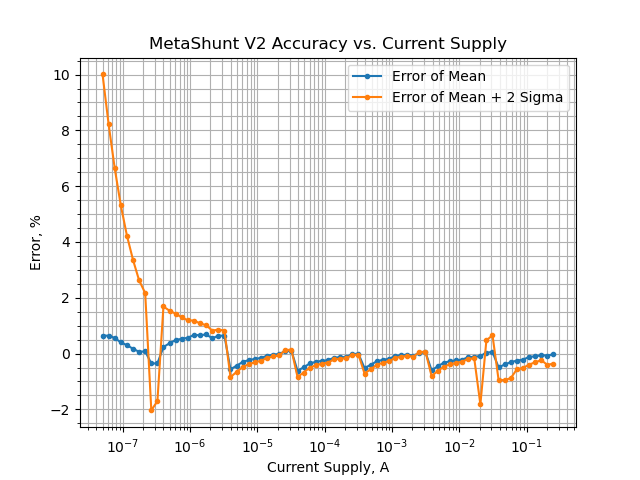
    This calibration script was used on a MetaShunt V2, and then several days later a calibration test script was developed here, and tested with that MetaShunt and an adjustable reference voltage configured current supply. This was a physically different current supply. For this test, 75 different current commands were tested, from 50nA to 250mA, distributed linearly on a log scale. For each current command, I measure for 1 second and compute a mean and standard deviation of the roughly 6,000 measurements that are received back from MetaShunt V2. I then plotted the error of the mean measurement and a 2-Sigma error for each. The plot below shows the accuracy across the current supply scale. Across the entire scale, the MetaShunt V2 provides highly accurate mean measurements, within +/-0.6% of the commanded current. Combined with the +/-0.3% error of the current supply, this indicates better than +/-1% absolute accuracy for 1s mean measurements across 50nA to 250mA. At very low current, the standard deviation varies significantly, likely due to the high impedance of the measurements at this scale.

  • Calibration Tool for MetaShunt

    Jake Wachlin • 08/17/2025 at 02:35 • 0 comments

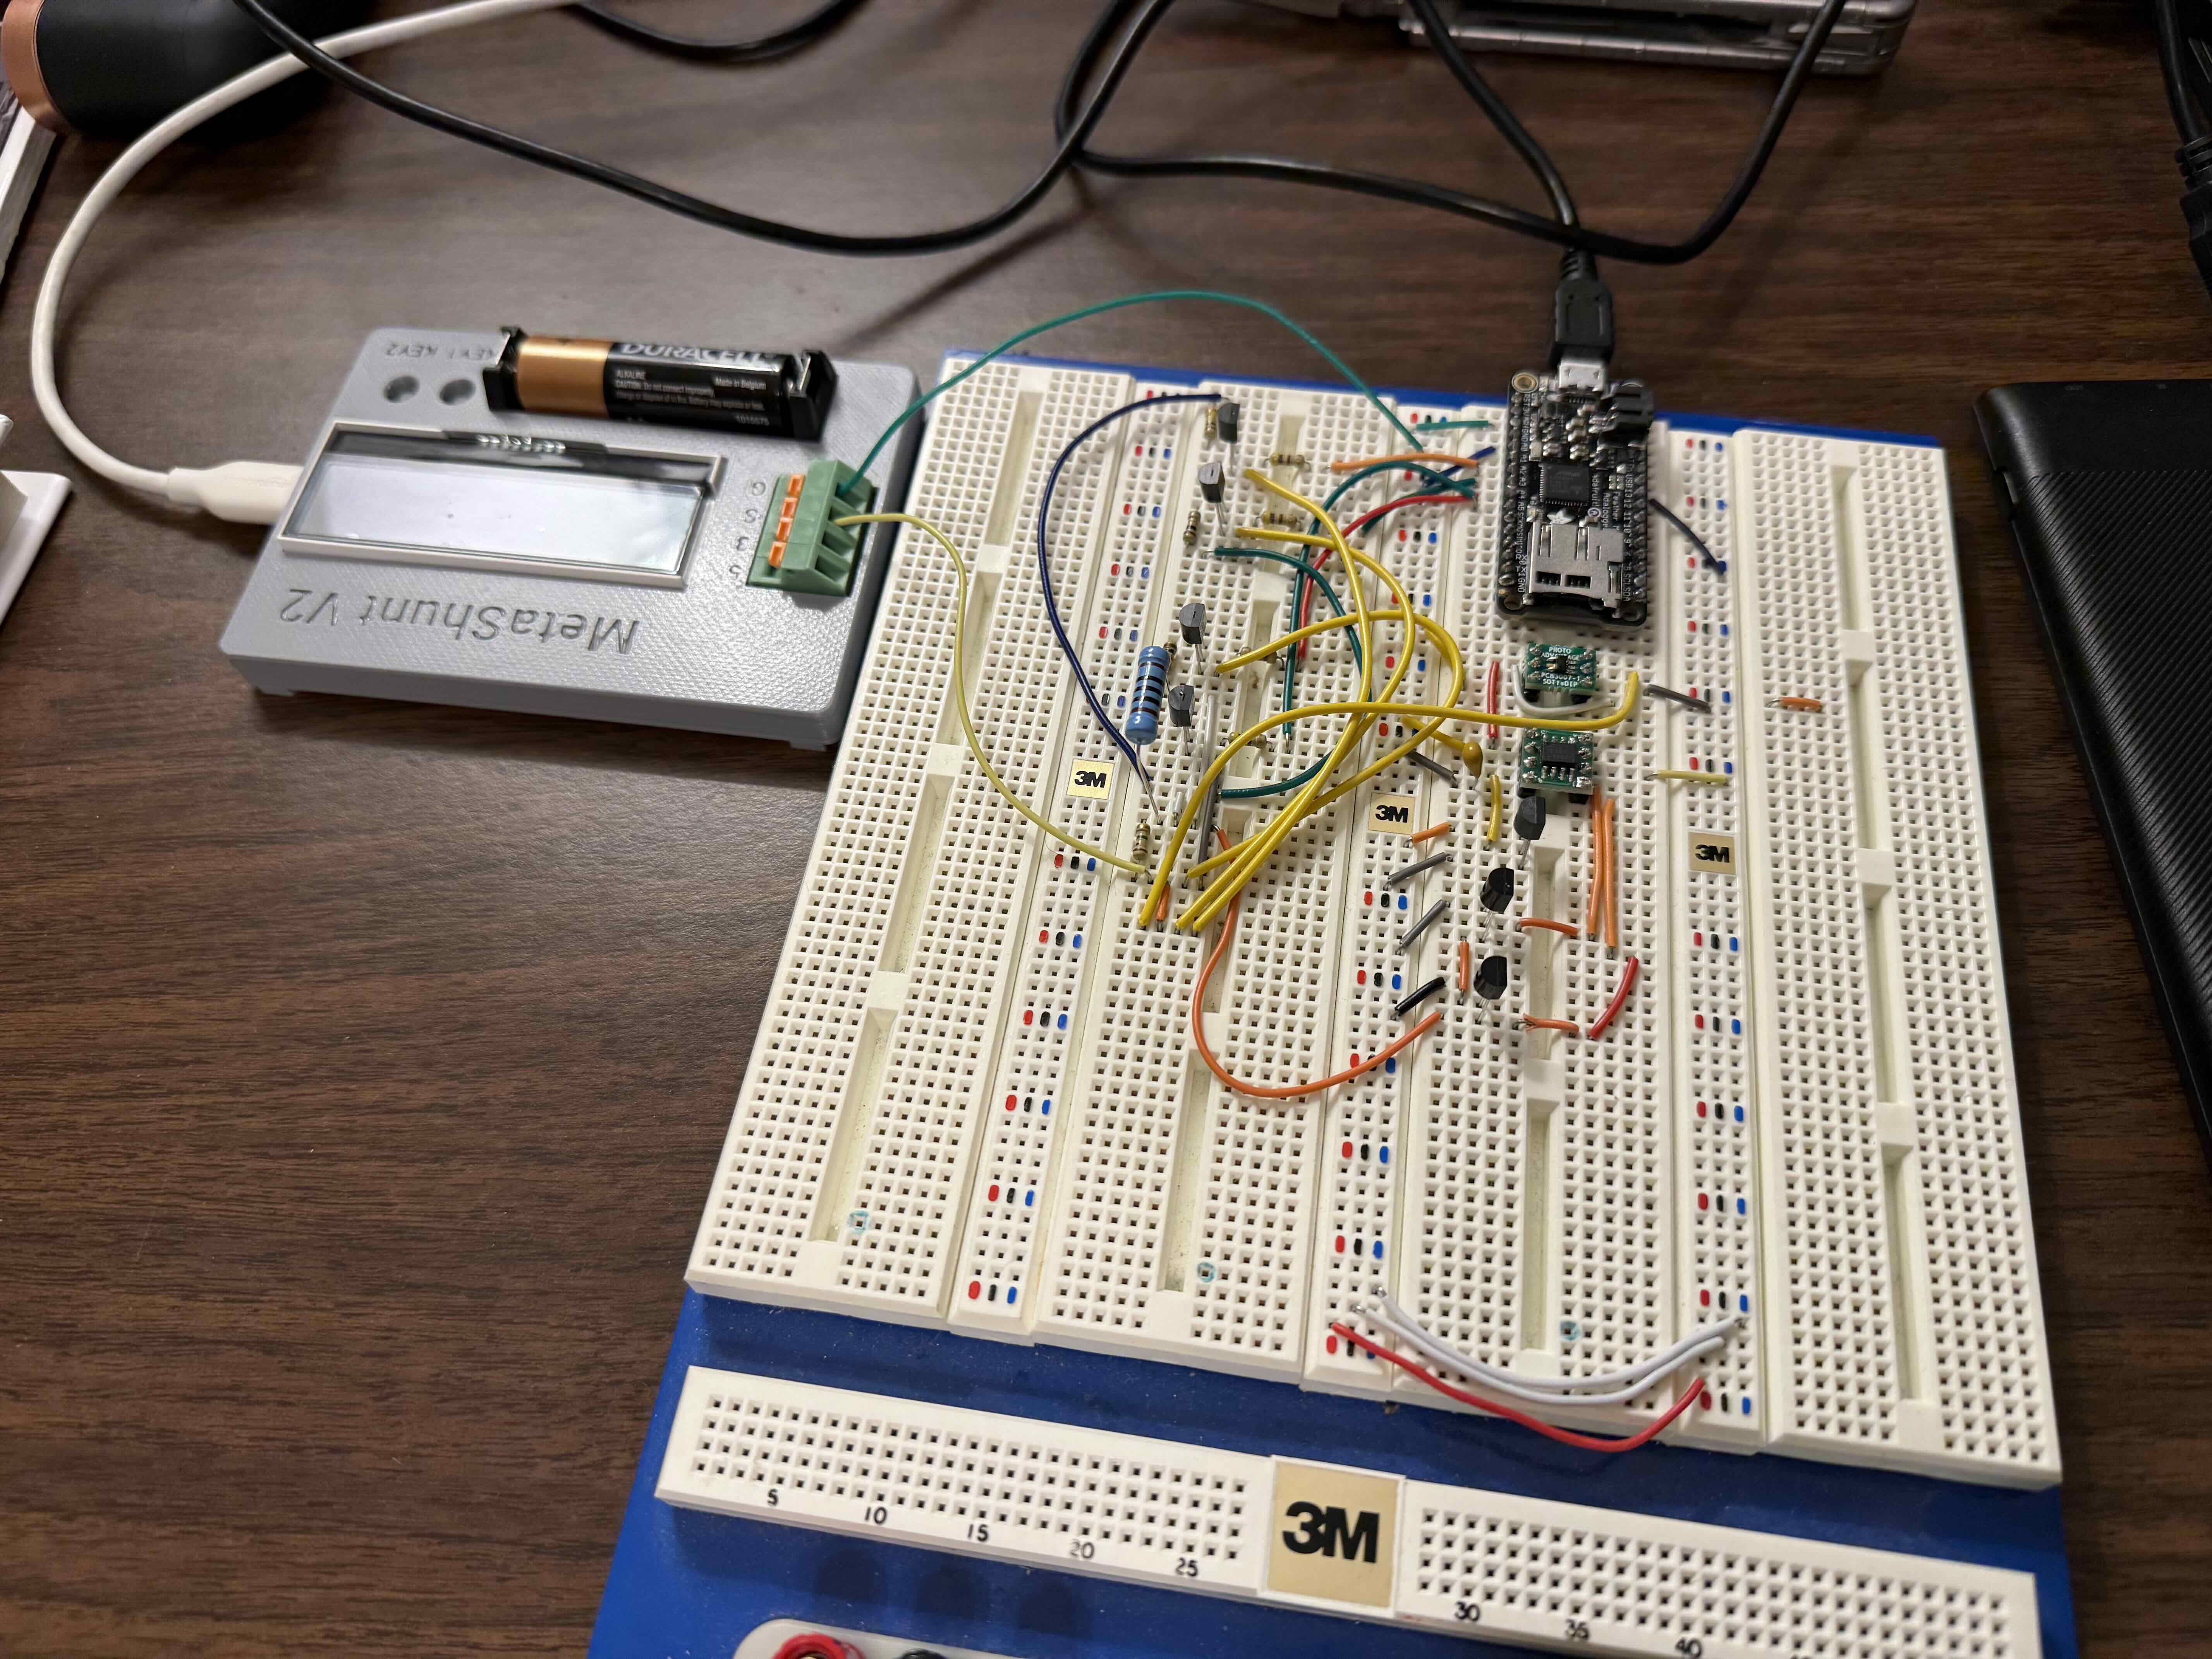
    To enable improved accuracy of MetaShunt V2, it would be nice to be able to calibrate at each of the 8 gain stages. With this in mind, I developed a high dynamic range current supply. To test the concept before ordering a custom PCB, I developed an equivalent breadboard version with the first 5 gain stages, seen below. The actual design has isolated power and isolated communications, so it can be connected to the same USB hub as MetaShunt without issue. This prototype however is not isolated, and so was powered by an external USB battery pack. An Adalogger M0 is used to control the gain stages, changing them every few seconds while I record the measured current on MetaShunt V2.

    I measured all of the relevant resistors and voltage reference in this design, and calculated the sourced current. Then I measured the current with MetaShunt V2 and compared the difference. The real design will use highly accurate components (0.1% resistors, 0.2% voltage reference, etc.) but for this test I am just measuring the components with a multimeter (accuracy unknown).

    Expected CurrentMeasured CurrentError
    2.39uA2.39uA0.0%
    27.2uA27.35uA0.55%
    254.4uA255.7uA0.51%
    279.2uA280.2uA0.36%
    2.525mA2.528mA0.12%
    2.801mA2.801mA0.0%
    24.813mA24.685mA-0.52%
    27.615mA27.415mA-0.7%

    So overall, fantastic accuracy across the board, and proved out the concept! Next step is to build the full system and build automatic calibration software for MetaShunt to improve it's accuracy even further. Nonetheless, even without calibration, MetaShunt is currently within 1% of the true current across 5 orders of magnitude in this testing!

  • MetaShunt V2 Case

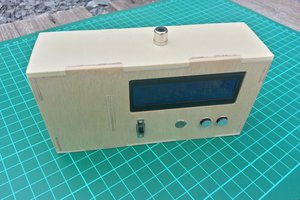
    Jake Wachlin • 08/16/2025 at 17:08 • 0 comments

    MetaShunt V2 Now Has a Case!

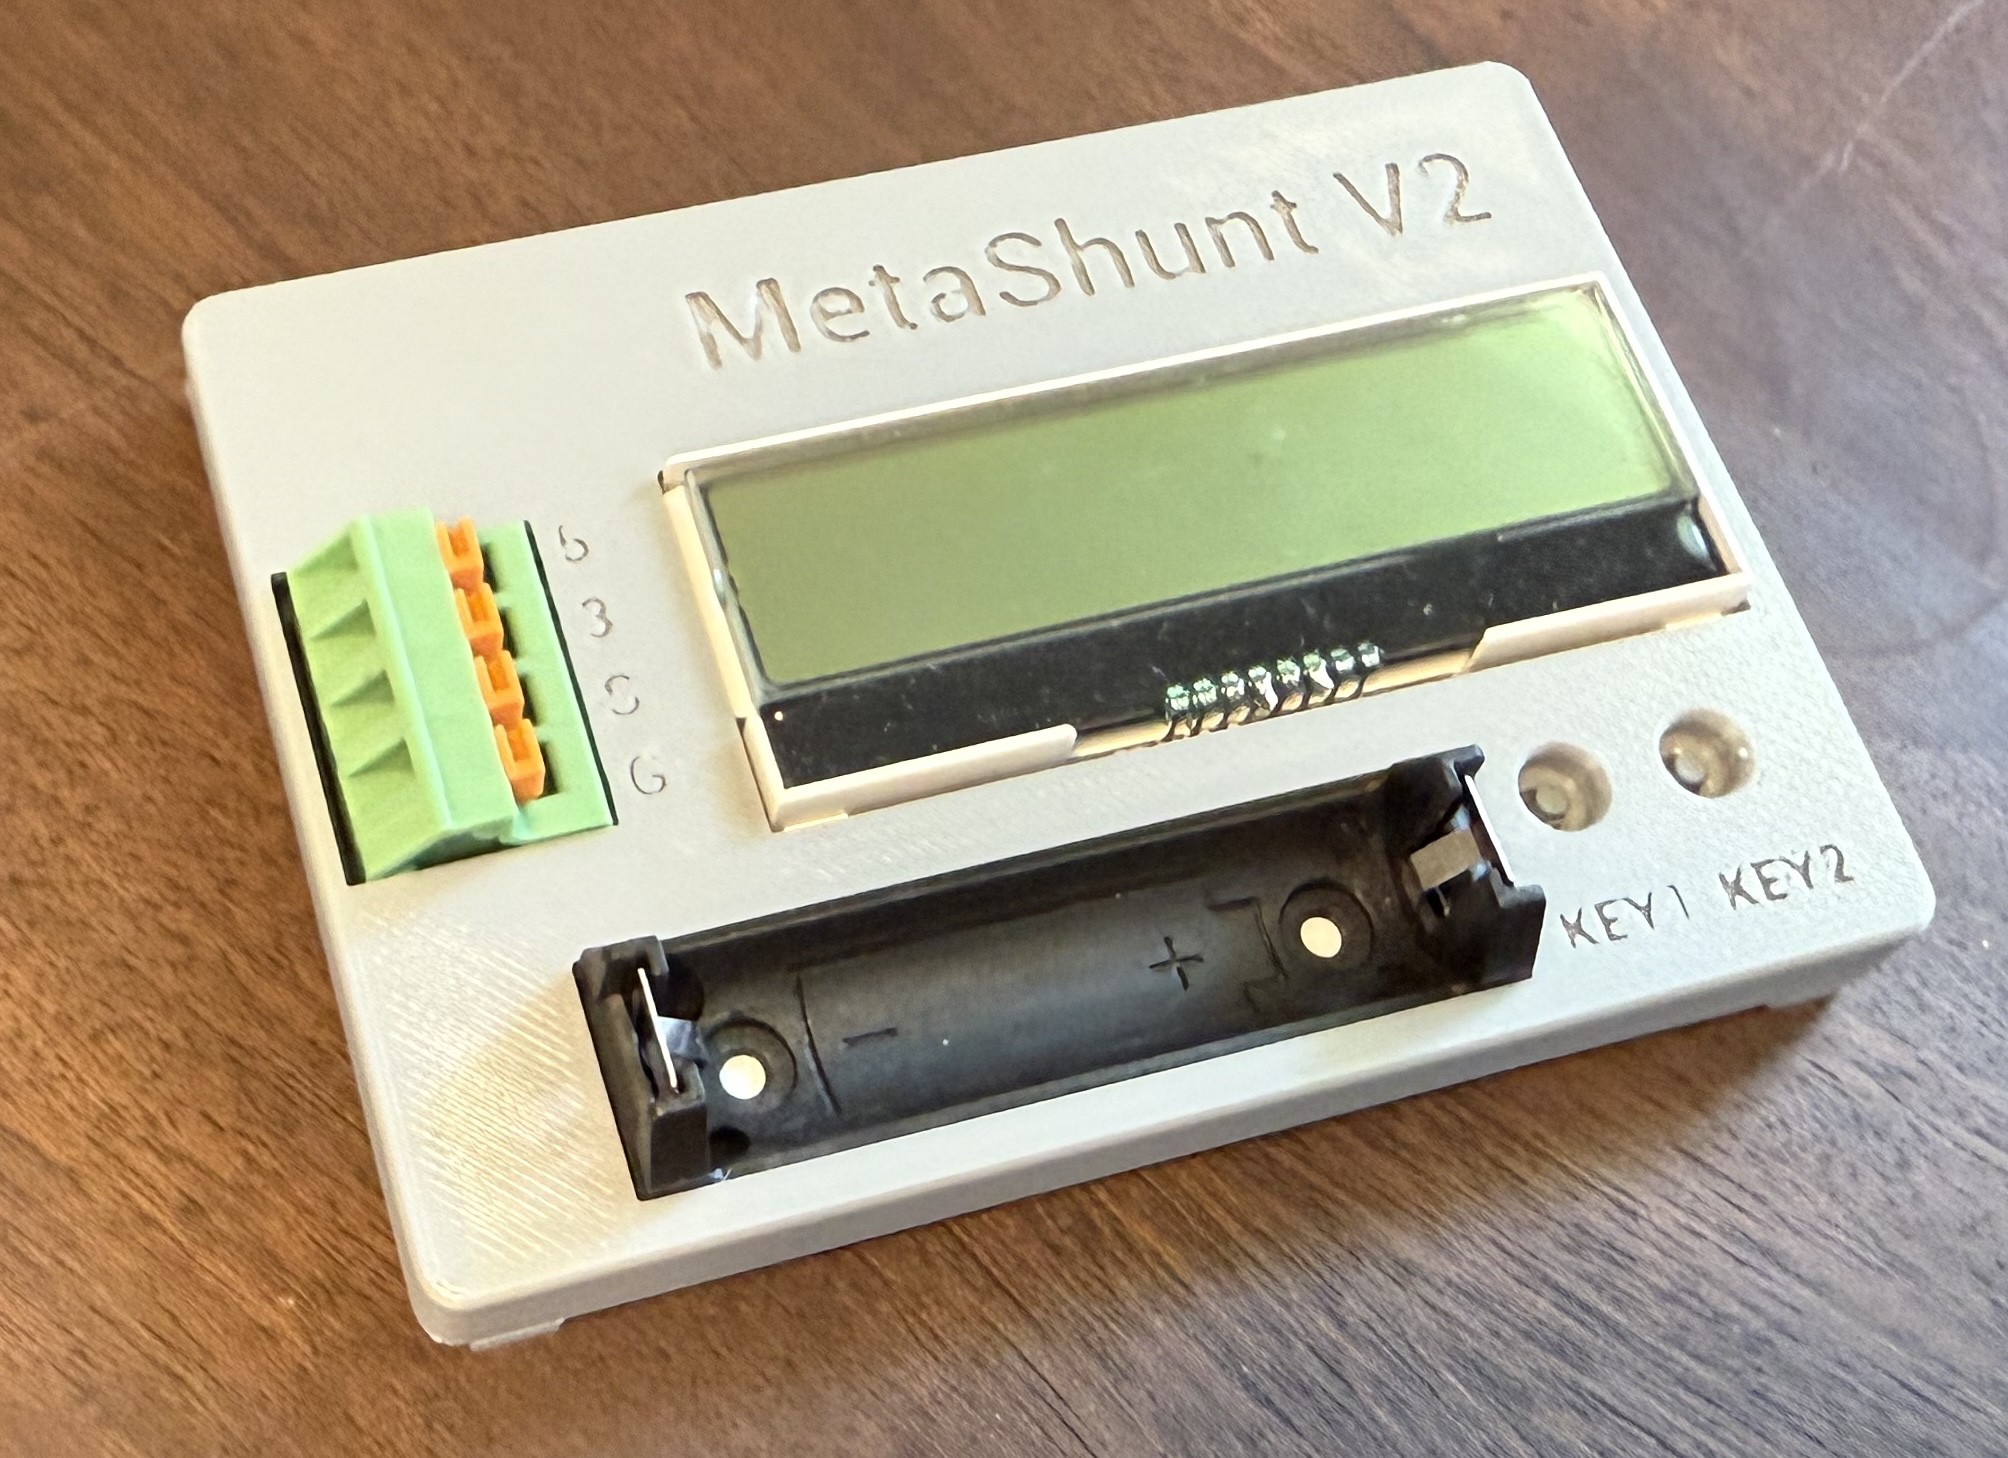
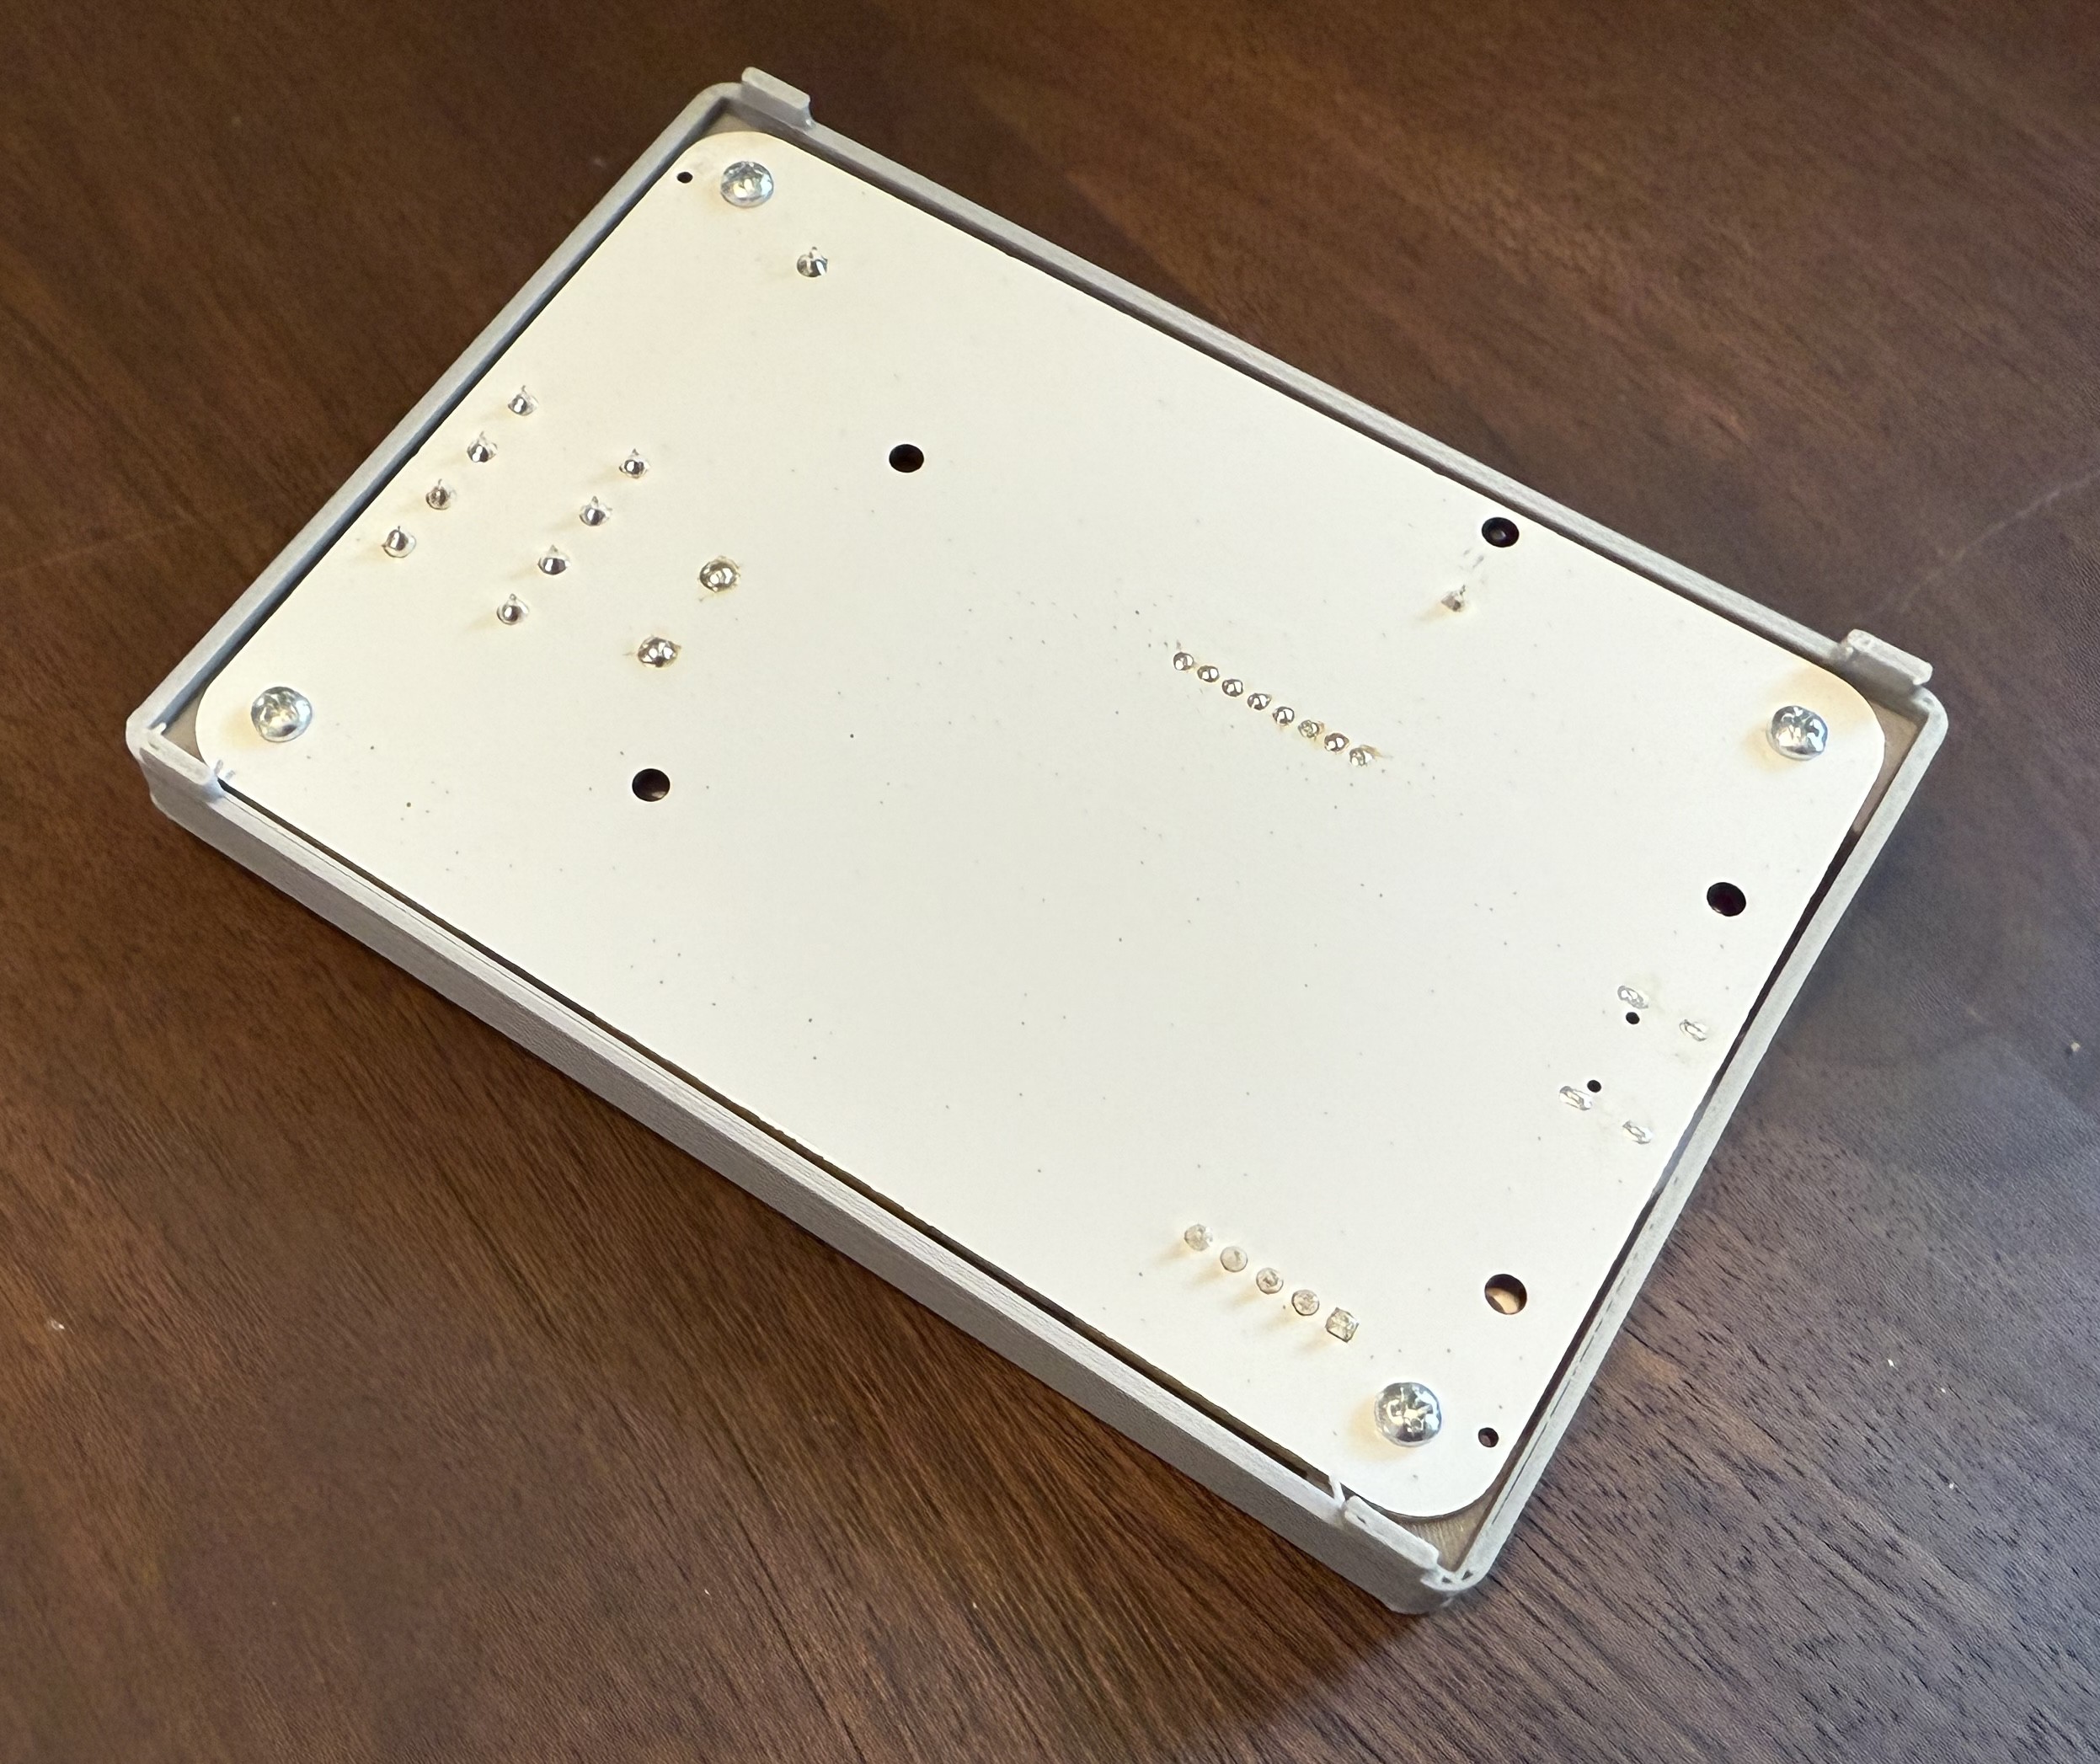
    I recently designed a simple, 1-part 3D-printed case for MetaShunt V2. Versions are available for the LT and Base models on the main page. The designs are given as is, and can be modified with no restrictions. STLs and FreeCAD files are provided for both. For both versions, this screw from McMaster Carr is used to mount the PCB into the case. I recommend printing it with the text down on the build plate, no supports needed (worked well in PLA+ on my printer).

  • Nordic PPK-2 vs MetaShunt V2 vs Otii Arc Pro - Low Current Testing

    Jake Wachlin • 06/30/2025 at 22:36 • 0 comments

    I recently purchased a Nordic PPK-2 development kit in order to compare its performance with the MetaShunt V2 and the Otii Arc Pro. These three products compete but have very different price points, and each has its own unique feature set. The table below compares the three on high-level specs. All specs are accurate at the time of writing.

    ProductPricePerformanceUnique Features
    Nordic PPK-2$89Up to 100 ksps output, 200nA-1A rangeHighest continuous output data rate, digital input sampling, SMU capability
    MetaShunt V2                   $199-$249              Up to 6 ksps output continuous, 127 ksps burst, 50nA-1.5A rangeOptional long-term computer-free coulomb counting, highest burst data rate
    Otii Arc Pro$949Up to 4 ksps, "nA to 5A" rangeSMU capability, (paid) battery simulator, NIST traceable calibration


    Test Setup

    The device under test was my ultra-low power development board, the Nanosleeper. Firmware was set up on the Nanosleeper to busy wait with the two onboard LEDs on for 2s, then busy wait for 1.5s with the LEDs off, then enter the STOP0 sleep mode for 5s, then enter the shutdown sleep mode for 5s. This cycle then repeats. Data was captured using each of the Nordic PPK-2, MetaShunt V2, and Otii Arc Pro, respectively. The data was output to CSVs, and then compared using the log comparison tools on the MetaShunt interface repo. Prior to testing, MetaShunt V2 went through its normal production calibration process, which actually only calibrates the high current ranges, and therefore did not effect this test. The Otii Arc Pro calibration process using the Otii 3 software was performed. The PPK-2 was not calibrated, since I was not able to find anything online about it or any way in their software to calibrate it. For each test, 3.3V was provided into the BAT pin on the Nanosleeper.


    Results

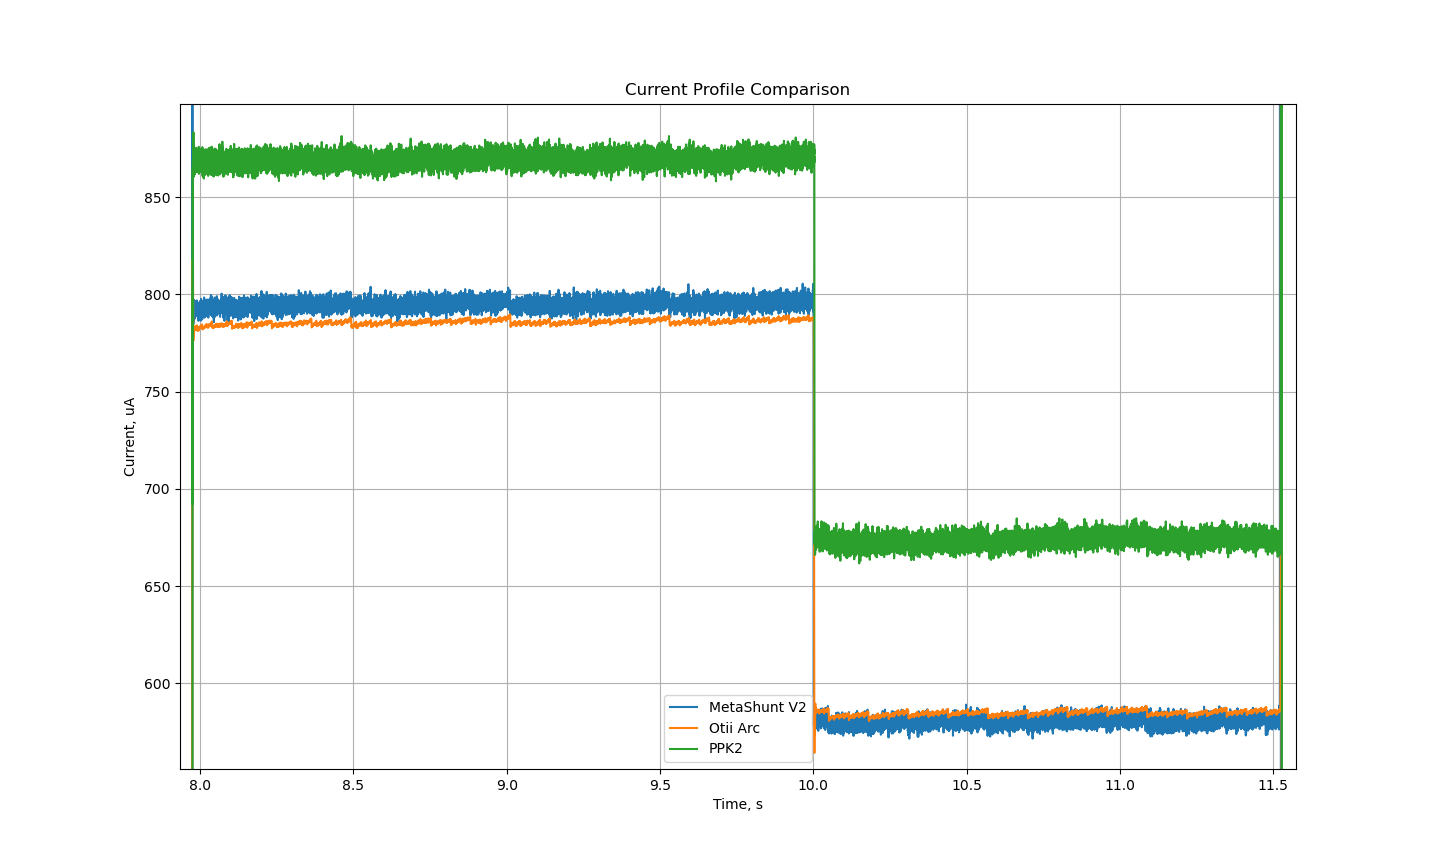
    The plot below shows the measurements for the three tools on top of each other. Even in this zoomed out view, it can be seen that the Otii Arc and MetaShunt V2 agree closely at the higher currents. The plots at lower currents in the sleep modes appear to be on top of each other at this scale, so later plots will show the accuracy of those. 

    The plot below shows the measurements in the two higher power conditions. For reference, a cheap multimeter in ammeter mode measured the current as 787uA and 583uA, indicating that the Otii Arc and MetaShunt V2 measurements appear to be far more accurate than those from the PPK-2.

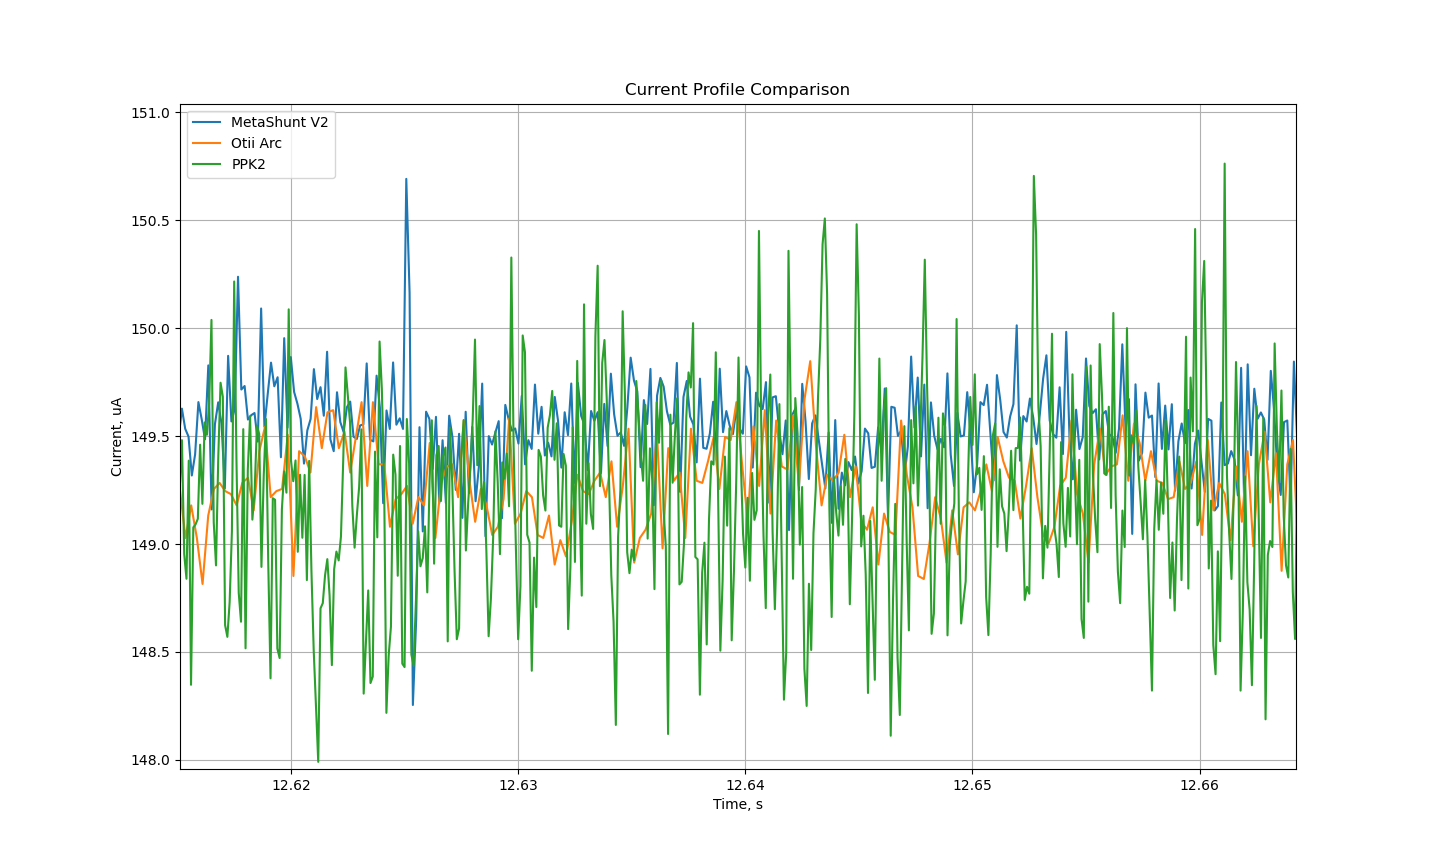
    Interestingly, the current measured in the STOP0 sleep mode was very similar for all devices. The low-cost multimeter measured 146uA, for reference.

    In the lowest power shutdown mode, I expect the current to be on average just below 100nA. This is below the spec of the PPK-2, but MetaShunt V2 and Otii Arc should be able to measure it. However, at this low current the noise level on the Otii Arc Pro nearly drowns out the signal.

    The energy plot below shows the cumulative energy use over time. The Otii Arc and MetaShunt V2 lines track each other almost perfectly, while the PPK2 plot diverges fairly significantly. If using these tools to predict battery life, this would lead to significant uncertainty in expected lifespan of your device!

    If we assume the NIST-traceable calibrated and ~5-10X more expensive Otii Arc Pro is the gold standard here, we see errors of the following:

    On, LEDs OnOn, LEDs Off
    MetaShunt V2 Error+1.2%-0.8%
    Nordic PPK-2 Error+10.8%+15.5%


    Conclusion

    The Nordic PPK-2, MetaShunt V2, and Otii Arc Pro are all useful tools in low power and battery powered systems development and testing. They come in a range of price points from $89 to $949, and while they have a varied feature set, all three focus on a core capability of measuring current across a very high dynamic range. The MetaShunt V2 performed within about 1% of the accuracy of the Otii Arc Pro at about 1/5th the cost. The Nordic PPK-2 was the lowest cost tool of...

    Read more »

  • MetaShunt V2 GUI

    Jake Wachlin • 05/03/2025 at 03:40 • 0 comments

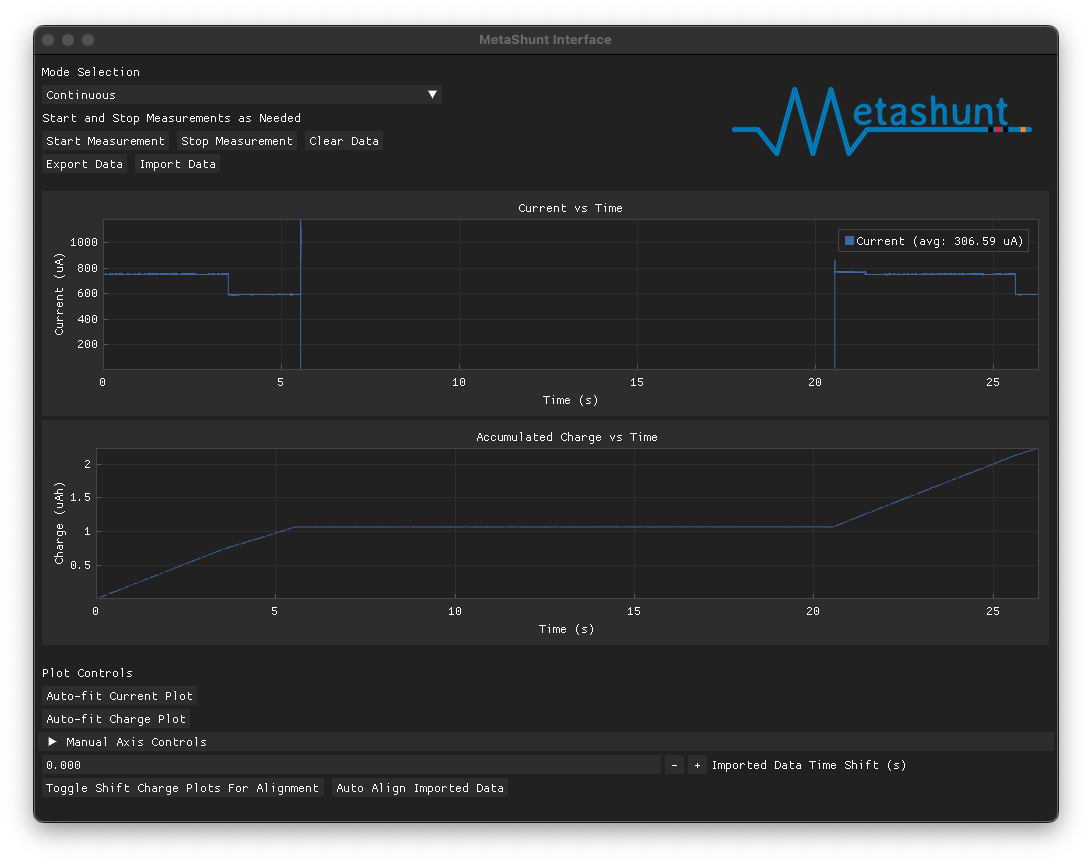
    Today I am proud to announce the launch of the first MetaShunt GUI, available now on the MetaShunt Interface Github repo!

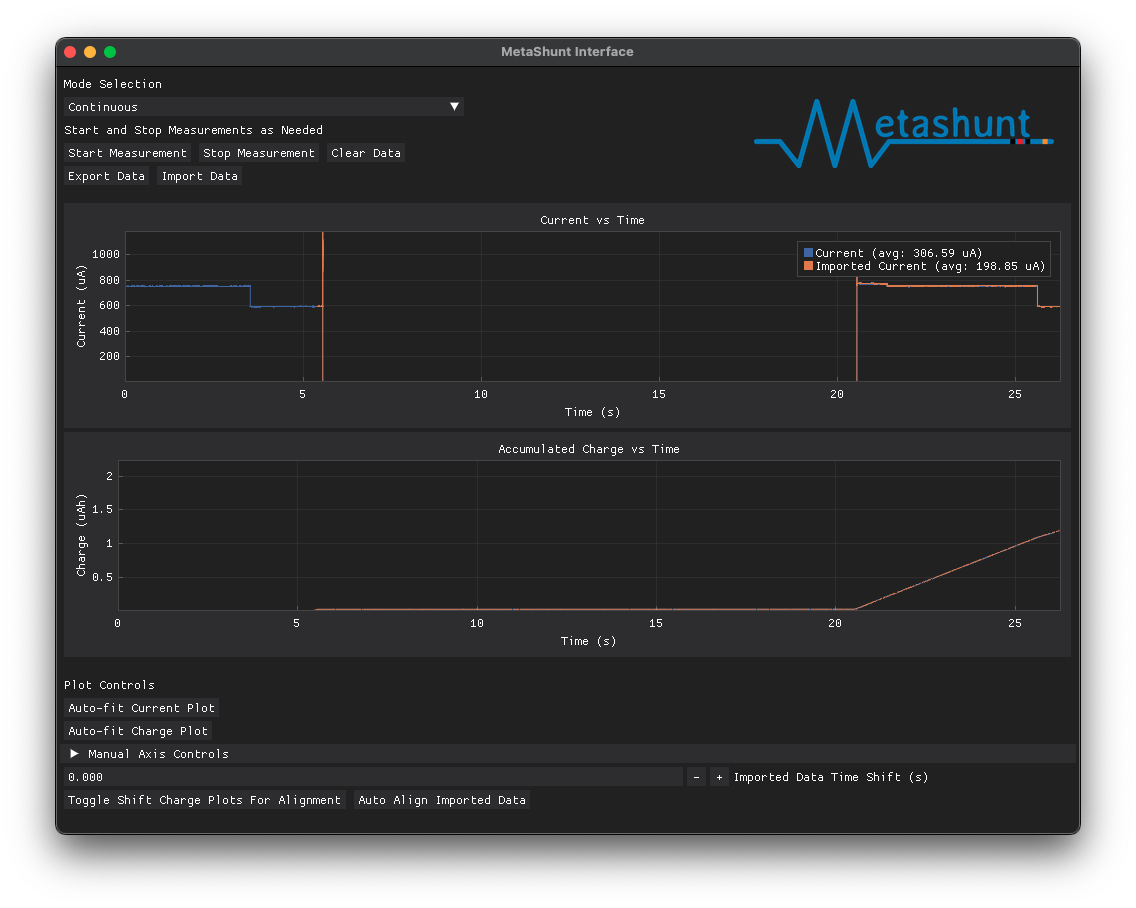
    Previously, the only interface to use MetaShunt V1 or V2 was a set of Python scripts which would allow for continuous (for a set amount of time) or burst measurements. At the end of the measurements, a set of plots would pop up. The user could alternatively tell the system to write the measurement data to a log instead of displaying it on a plot. A separate set of Python scripts enabled comparing two or more logs with each other, in order to analyze relative power consumption.

    While functional, these were not user friendly. All that has now changed with this GUI! 

    Users can now request continuous or burst measurements. While continuously recording, the plots auto-update, showing what is currently happening with the system. Burst measurements stop updating after the set of 37,500 datapoints in the burst have been received. Data can be exported and imported as desired, allowing measurements to be easily compared!

    The imported data can then be shifted in time manually using the buttons near the bottom of the screen. Or, if the signal has recognizable features, the "Auto Align Imported Data" button can automatically align the data based on the current measurements. In addition, the charge over time plots can be aligned with the "Toggle Shift Charge Plots For Alignment" button. This button is key to compare wakeup events between firmware changes to compare energy savings easily.

    Check it out for yourself now and please let me know if you run into bugs or have feature ideas! Happy hacking!

  • New MetaShunt Interface Feature - Comparison Tools

    Jake Wachlin • 03/25/2025 at 13:00 • 0 comments

    MetaShunt was designed for high dynamic range current measurement of embedded systems, particularly ultra-low power and IoT systems. These measurements help verify the functionality of a project or product. They tie in nicely with the power budgeting tools I've also developed, hosted on Hackaday.io here. However, I previously hadn't connected the two. This log demonstrates the new comparison tools I've added to the MetaShunt Interface Github repo, how they work, and provides some examples of their use.


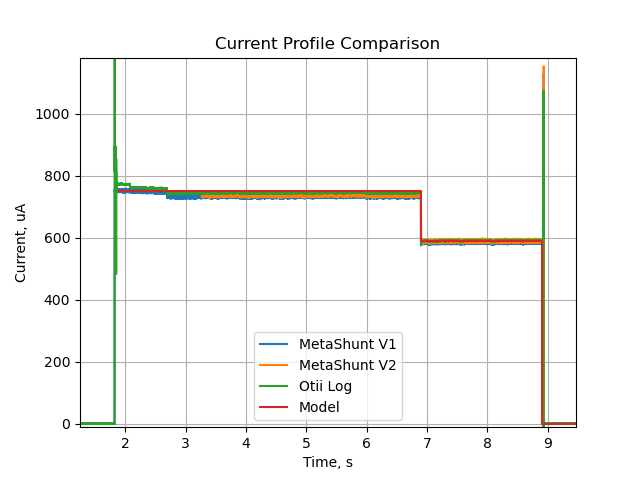
    First, lets look at the basic use of these tools - where they are located and what the interface looks like. The comparison tools are included in a folder on the MetaShunt interface. The key Python file to look for is metashunt_profile_processing.py. This can be used to set up the comparison plots between the outputs of MetaShunt V1, MetaShunt V2, Otii Arc, and my modeling tools. Each has its own enumeration to tell the parser what type of file it is, and the files can be temporally aligned manually, with no alignment, or by attempting cross-correlation (which may or may not work depending on what your signal looks like).


    Next, let's look at an example. In this example, my Nanosleeper development board is operating between run mode, run mode with LEDs on, and deep sleep mode. The script to view this example is in the Examples/Nanosleeper folder for the Comparison Tools on the metashunt_interface repo. The code is very simple.

    import sys
    
    sys.path.append('../../')
    
    import metashunt_profile_processing as mpp
    
    if __name__ == "__main__":
        metashunt_profile_1 = mpp.PROFILE(filename="metashunt_v1_nanosleeper.csv", filetype=mpp.FILETYPE.METASHUNT_LOG, 
                                          alignment_type=mpp.ALIGNMENTTYPE.TIMESHIFT, label="MetaShunt V1", t_shift=-6.1659)
    
        metashunt_profile_2 = mpp.PROFILE(filename="metashunt_v2_nanosleeper.csv", filetype=mpp.FILETYPE.METASHUNT_LOG, 
                                          alignment_type=mpp.ALIGNMENTTYPE.TIMESHIFT, label="MetaShunt V2", t_shift=3.26803)
        
        arc_profile_1 = mpp.PROFILE(filename="otii_arc_nanosleeper.csv", filetype=mpp.FILETYPE.OTII_LOG, 
                                          alignment_type=mpp.ALIGNMENTTYPE.TIMESHIFT, label="Otii Log", t_shift=0.0)
        model_profile_1 = mpp.PROFILE(filename="Nanosleeper_sim.csv", filetype=mpp.FILETYPE.EMBEDDED_POWER_MODEL, 
                                          alignment_type=mpp.ALIGNMENTTYPE.TIMESHIFT, label="Model", t_shift=1.8979)
    
        
        profiles = [metashunt_profile_1, metashunt_profile_2, arc_profile_1, model_profile_1]
    
        mpp.plot_profiles(profiles)

    The four files are processed, manually timeshifted, and then plots are generated. This automatically generates plots of current, power, and accumulated energy use. Note that the power and energy calculations use a system voltage parameter that is part of the Profile class and defaults to 3.3V.

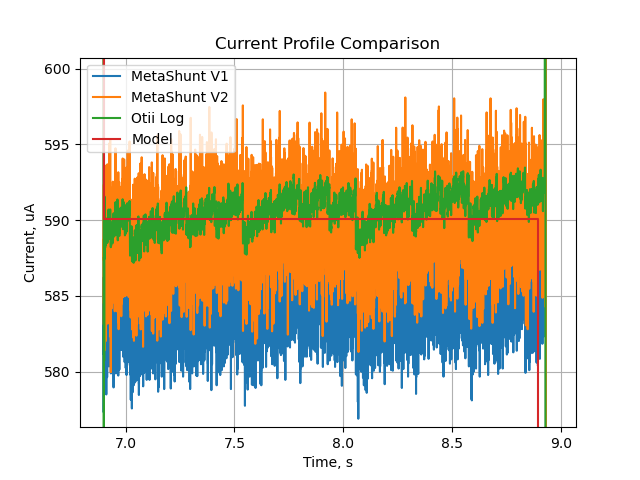
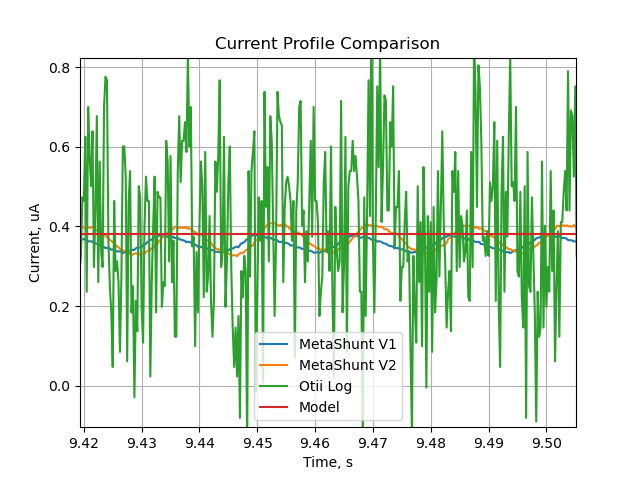
    The current plot, when zoomed to the first wakeup cycle, looks like the plot below. Note that the logs have different lengths and start at different points, so they don't fully overlap.

    This comparison tool is helpful for evaluating between firmware updates or for comparing to a predictive model of how much power your product or project should consume. For example, you can zoom into different sections and compare data from MetaShunt to data from the model (and in this case from an Otii Arc). Note that at higher current, the Otii Arc appears to have lower noise than MetaShunt V1 and V2, but appears to be much noisier at low current below 500nA.

View all 14 project logs

Enjoy this project?

Share

Discussions

Stephan Walter wrote 02/03/2024 at 17:42 • point

I'm certainly looking forward to Metashunt being available on Tindie. I wonder how this compares to Nordic's Power Profiler Kit II which is another hobbyist-friendly (<$100) current measurement tool.

What's nice about the PPK2 is that it can supply an arbitrary voltage to the target (0.8V-5V) and also that it has digital inputs, so that you can easily attribute a measured current to a certain device state using GPIOs.

  Are you sure? yes | no

Jake Wachlin wrote 02/21/2024 at 14:46 • point

Hi Stephan! MetaShunt is now listed on Tindie here: https://www.tindie.com/products/energylabs/metashunt-hdr-current-measurement-tool/. I am still working on getting units ready for shipment, but if you are interested you can sign up for the waitlist there!
  Are you sure? yes | no

Jake Wachlin wrote 06/30/2025 at 23:11 • point

@Stephan Walter I finally got around to comparing MetaShunt to the PPK-2 in a real world test, along with a much more expensive Otii Arc Pro. Read more on the test here: https://hackaday.io/project/193628-metashunt-high-dynamic-range-current-measurement/log/241602-nordic-ppk-2-vs-metashunt-v2-vs-otii-arc-pro-low-current-testing

  Are you sure? yes | no

Jake Wachlin wrote 12/11/2023 at 19:55 • point

Hey @Dan Julio thanks! I am thinking I will make the schematic open source so people can understand the implications of its approach on their measurements. 

The AA battery is used to provide a stable below ground rail for the op-amps so they don't have to operate near their negative rail with all the inconsistencies that can come from operating near a rail of a "rail-to-rail" op-amp

  Are you sure? yes | no

Dan Julio wrote 12/11/2023 at 01:17 • point

Good luck with this project, Jack.  It could definitely fill an important niche.  Will any parts of this be open-source?  Certainly would be nice to look at the schematic and understand how you're switching since that's so important in a device like this.  Also, just curious, what does the AA battery do?

  Are you sure? yes | no

Similar Projects

Does this project spark your interest?

Become a member to follow this project and never miss any updates