 EmericB
-
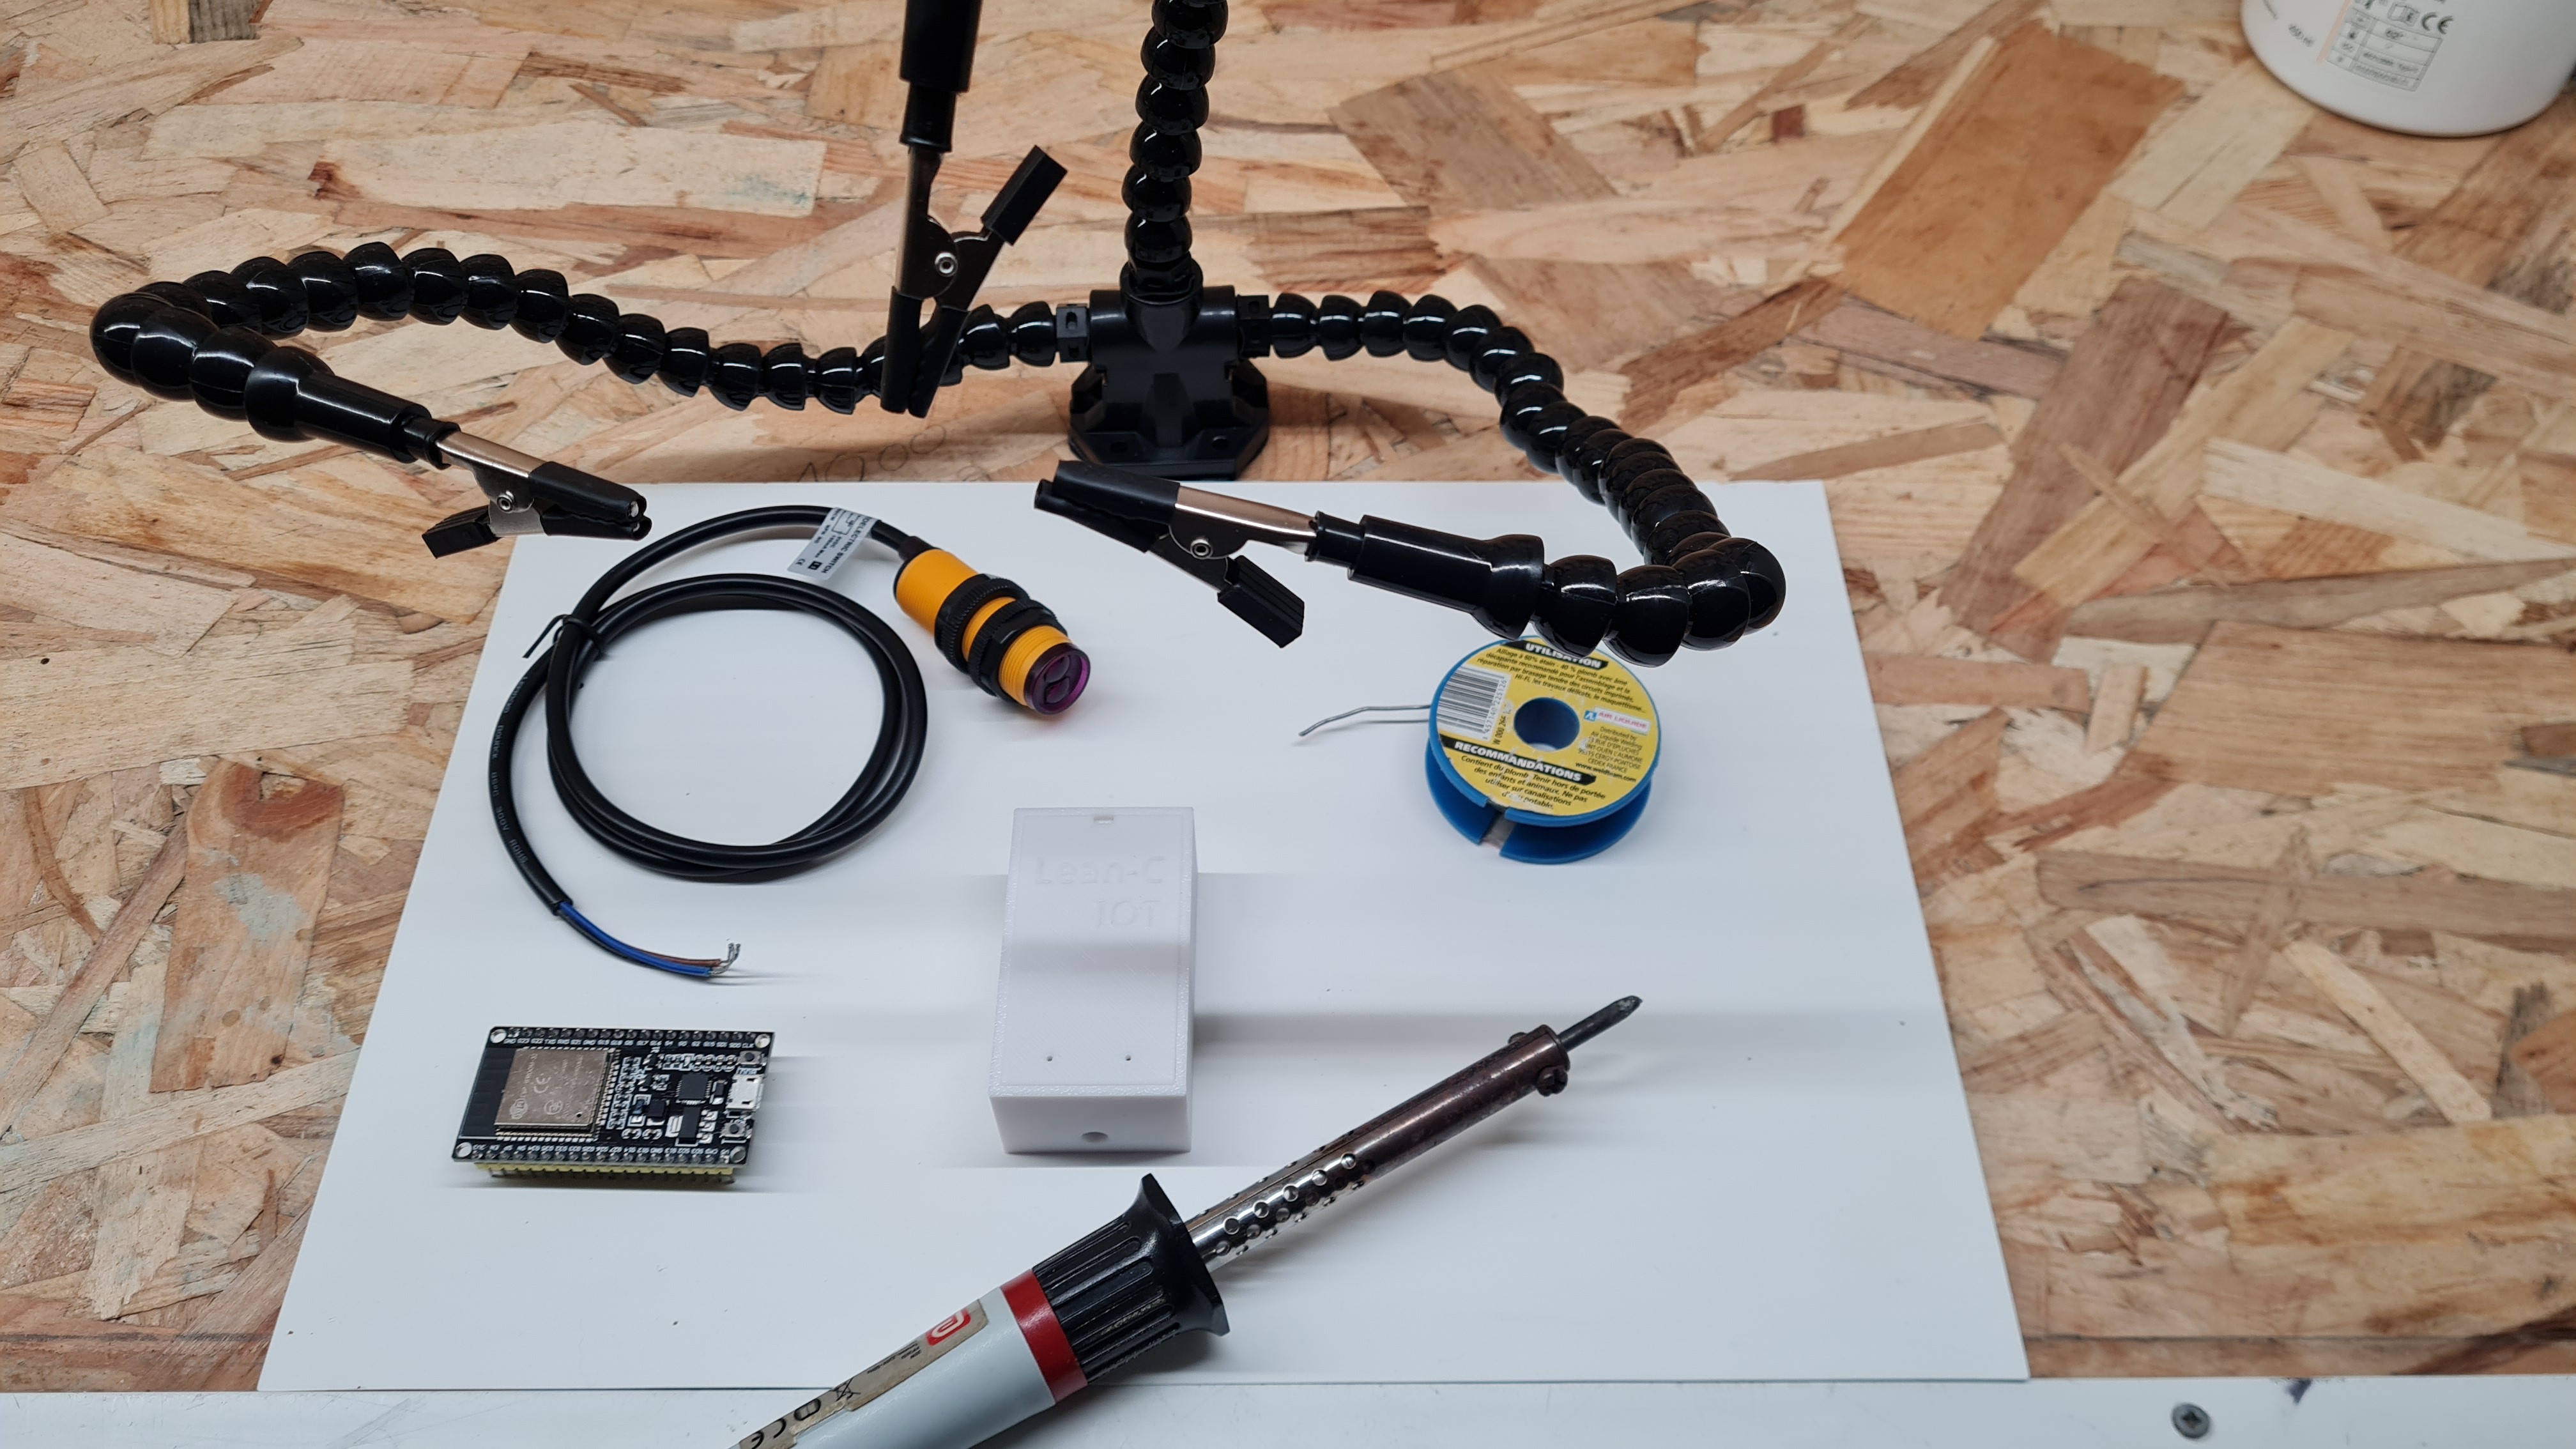
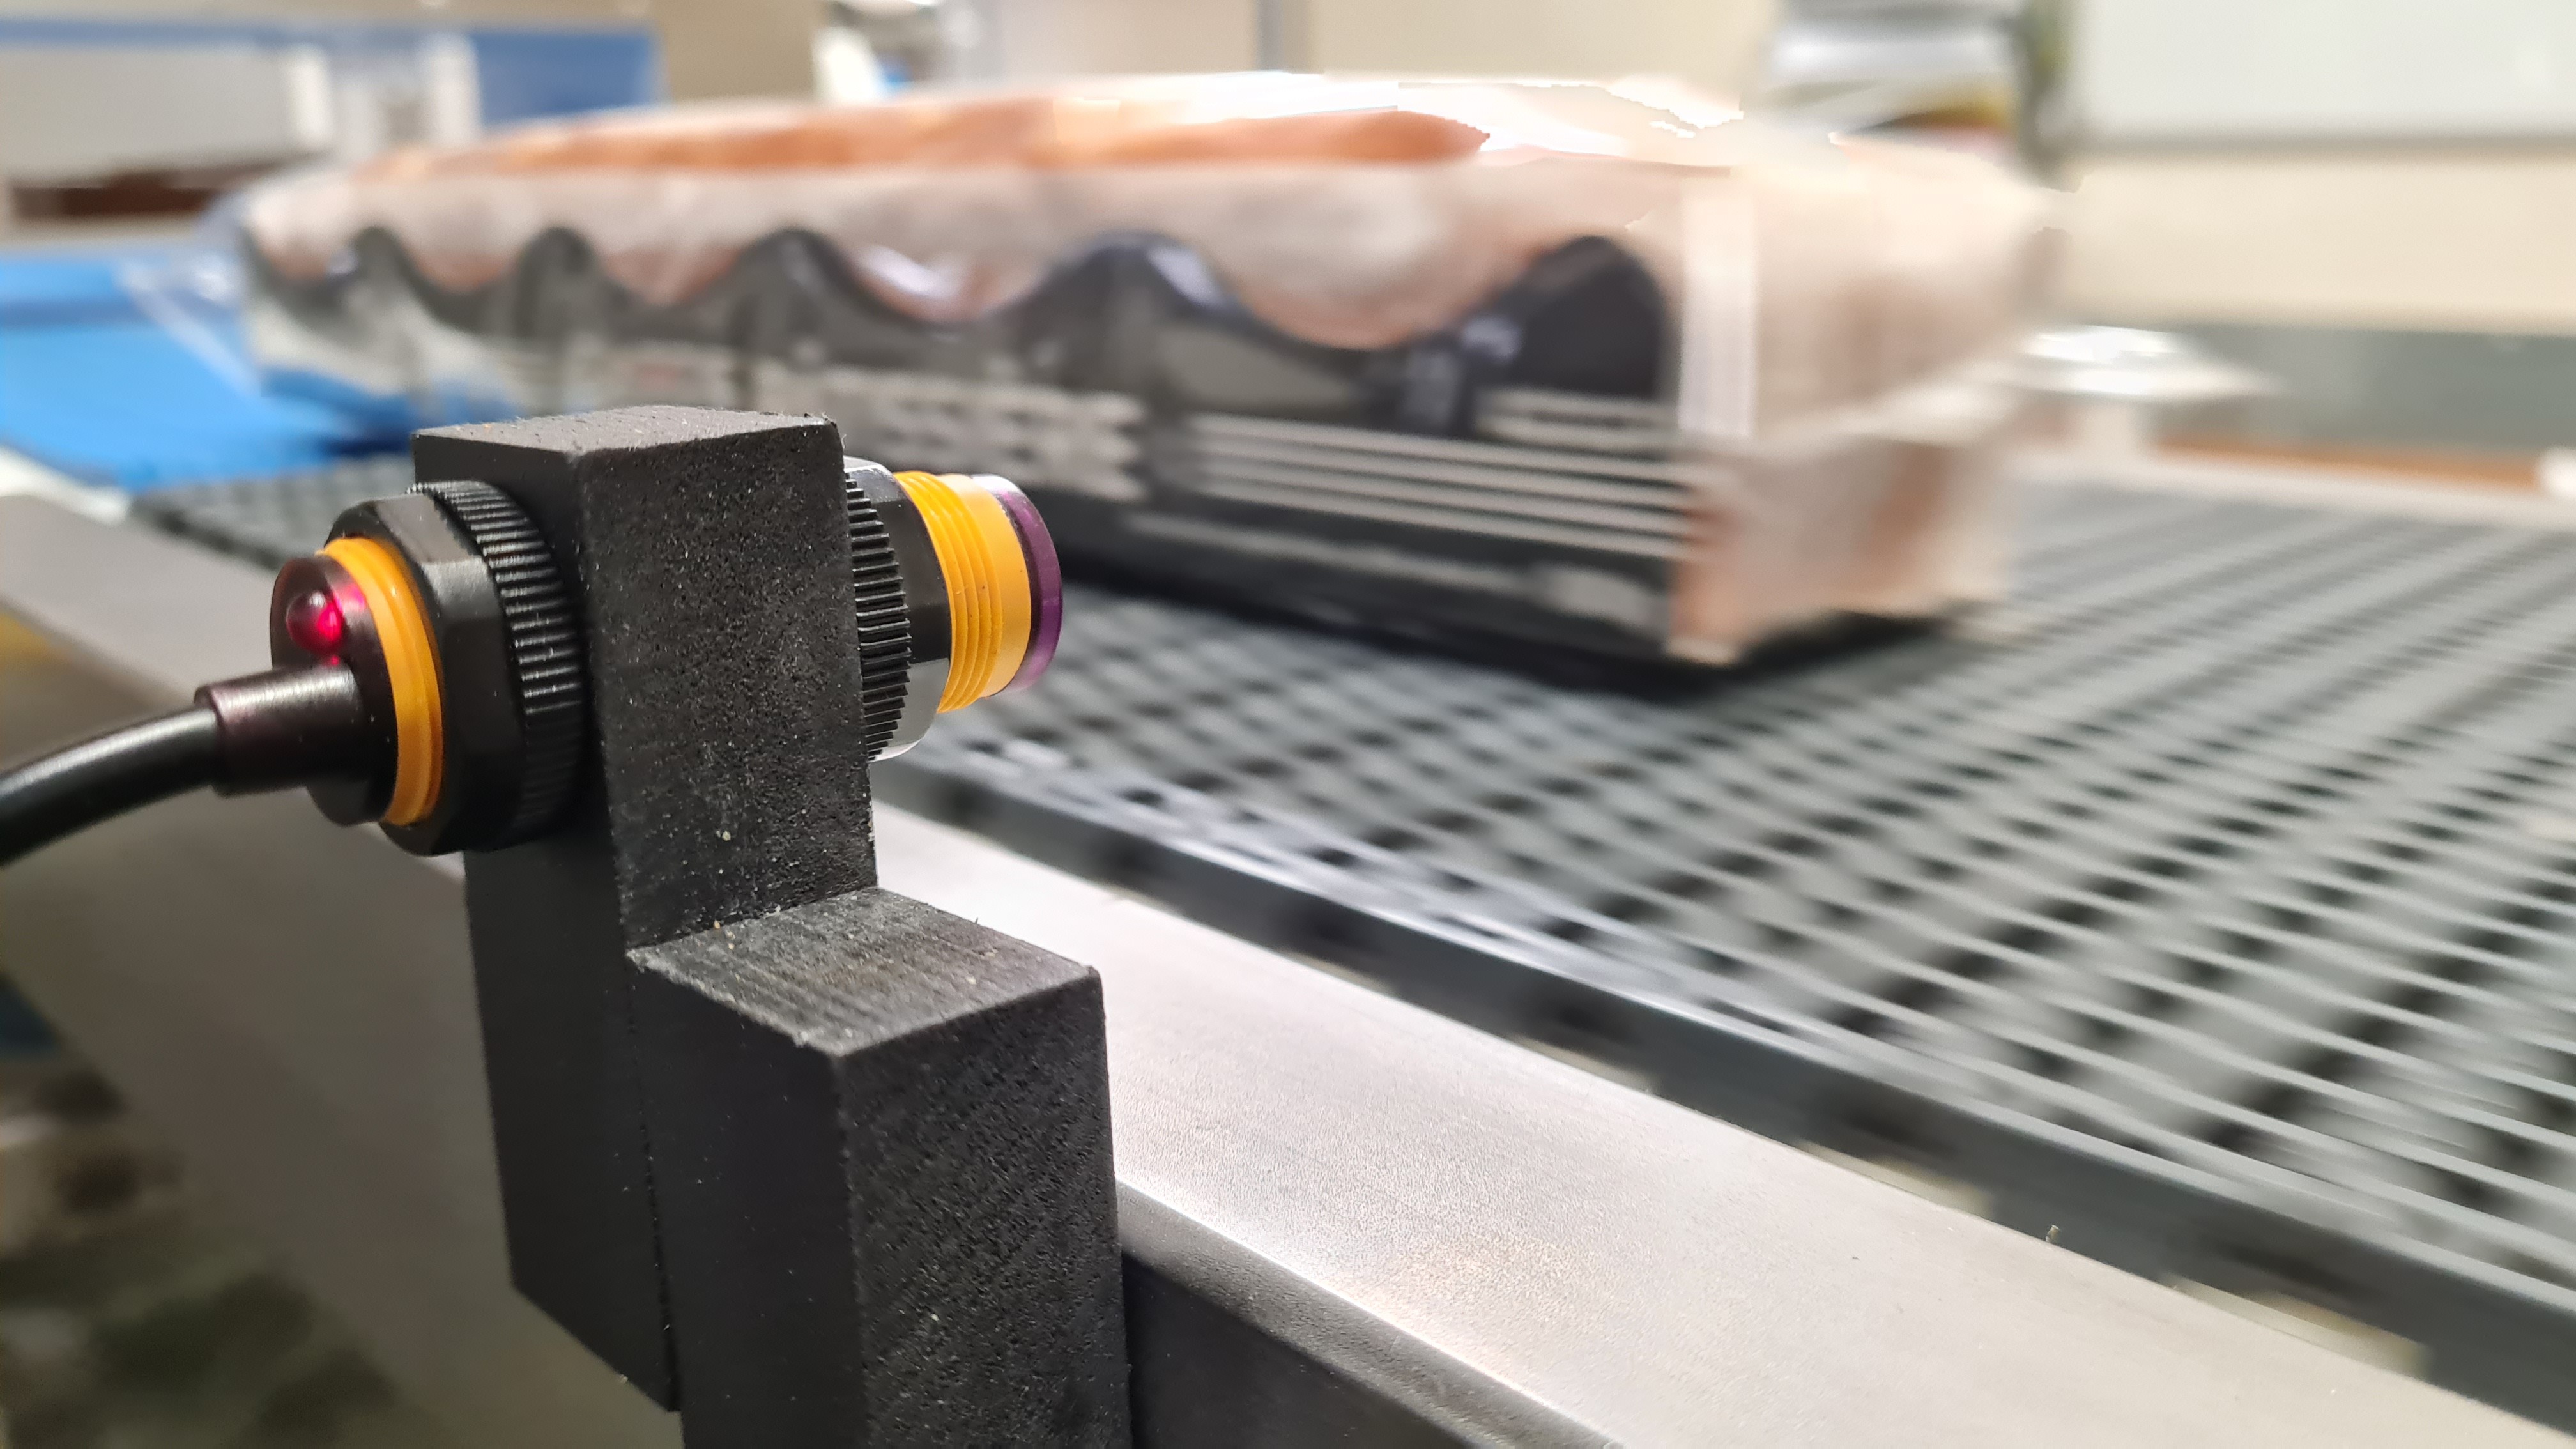
11Connecting an IR sensor to the ESP32
![]()
The 3D-printed casing is designed with a hole on one side for routing the IR sensor's cable, and on the opposite side, it features a space to accommodate a USB cable.
For powering the board, I've opted for the simplicity of using a USB port. This approach allows for easy power supply within the factory setting by utilizing a standard phone charger and a USB cable. Additionally, the accessibility of the USB port will simplify future software updates.
![]()
-
12Conclusion and Structure for the Next Part
![]()
Recap of Part One:
We have laid the groundwork for our production monitoring system using a MySQL database. This database is set up to automatically receive, every minute, the number of objects detected by our sensors. Automating data collection represents a significant advancement for managing our production flow, providing a first layer of operational intelligence.
Goals and Outlook:
However, our ambition does not stop at merely automated data collection. We aim for a more advanced exploitation of this information, which will be the focus of the second part of our project.
Planned Development in Part 2:
In this next phase, we will concentrate on developing a set of SQL queries and PHP pages dedicated to creating a dynamic dashboard. This dashboard aims to:
- Access Security: Be exclusively accessible to authorized members of our organization, thus ensuring data confidentiality and security.
- Real-time Summary and Analysis: Provide an instant overview and retrospective analysis tools. This will serve as a lever for continuous process improvement.
- Autonomous Detection of Production Stops: Have the ability to automatically detect and quantify production interruptions, calculating various key indicators such as service time and Overall Equipment Effectiveness (OEE).
- User Interactivity and Feedback: Allow users to document the reasons for stops or slowdowns, using this feedback to identify root causes of failures and prioritize corrective actions.
- Benchmarking and Alerts: Display cadence evolutions by production line, highlight optimal performances, and signal significant deviations to encourage a competitive yet positive environment and effective internal communication.
Conclusion:
With these clearly defined objectives, we are ready to move on to the second phase of thisproject. This crucial step will allow us to transform raw data into valuable insights for a more refined and reactive management of our production. The implementation of this dashboard will mark a turning point in our ability to drive operational performance and engage the organization in a continuous improvement process.
Industry 4.0: An economical SAAS MES part 1
An OpenSource MES that is easily implementable with resources accessible to everyone.

Discussions
Become a Hackaday.io Member
Create an account to leave a comment. Already have an account? Log In.