Close
0%
0%

SpiroBoard Aeroponics pH / EC / Motor Controller

A Raspberry PI HAT designed to control an aeroponics tower system

Similar projects worth following
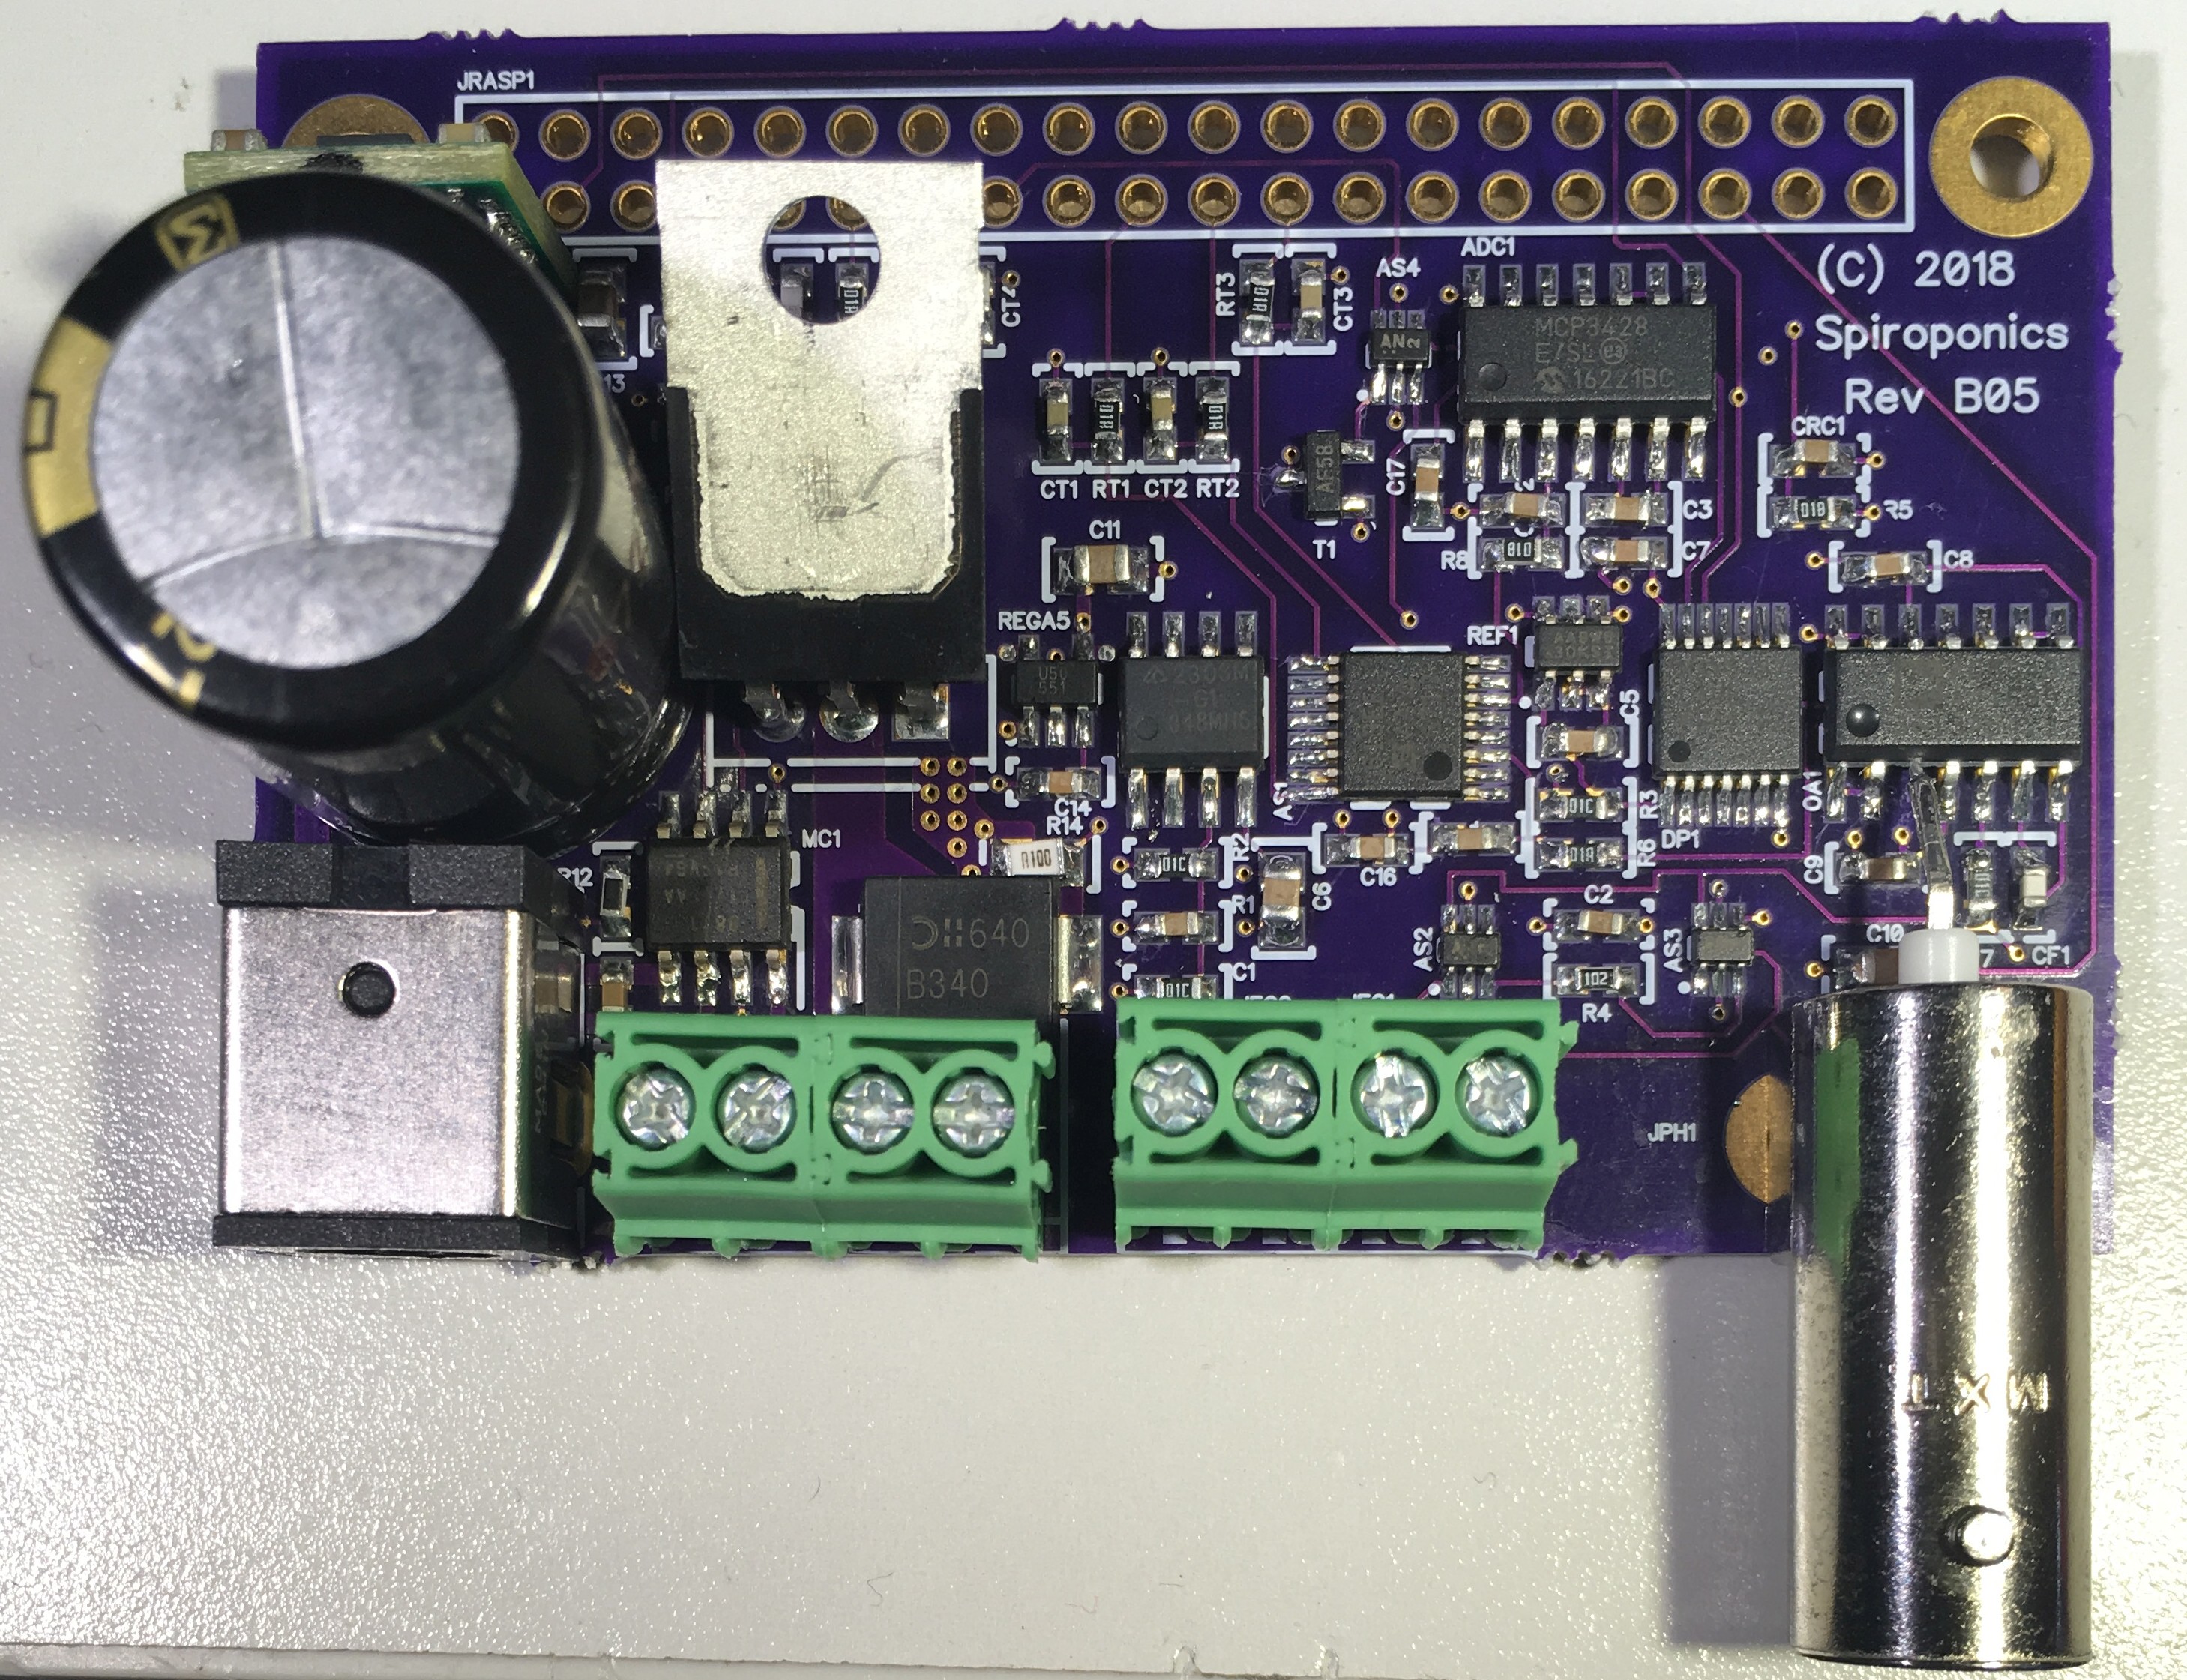
The SpiroBoard along with software running on the Raspberry PI monitors pH, Electro Conductivity (EC), air temperature and water temperature. It also controls a 12V 6.5A water pump and a motorized valve. The board monitors the pump current to estimate the water pressure and detect clogged filters or spray nozzles. As a bonus, it also provides 5V at 1.5A to power the Raspberry PI. The board is powered by standard 12V/8A supply with a 5.5 x 2.5mm coaxial power plug.

I am currently debugging the board and will fill in more details in the project log below as the process continues.

The internet has a dizzying amount of information on EC and pH. After sifting through it, I found some potentially interesting links that are detailed below.

The DIY EC meter project that inspired the original EC portion of this design

A tutorial on EC probes

A DIY EC sensor project with with lots of great information and links

The Difference between EC and PPM

Tutorial on how to verify the operation of a pH probe

A comparison of commercial pH calibration buffers

SpiroBoardB06.pdf

Latest version of the schematic. Added optional screw terminal power input, larger sense resistor, and RC on sense resistor connections to ADC

Adobe Portable Document Format - 115.18 kB - 01/08/2019 at 21:26

Preview

read_ec_ph.py

This opens the pigpio library and calls a function in spiroboard.py to read the EC and pH

plain - 1.43 kB - 09/06/2018 at 14:31

Download

spiroboard.py

This is a python file that uses the pigpio library to read the EC and pH from the Spiroboard

text/plain - 17.12 kB - 09/06/2018 at 14:25

Download

SpiroBoardB05.pdf

This is the schematic for the new sample-and-hold version of the design. The frequency and amplitude of the square waves used to measure the EC can be programmed through software on the RPi.

Adobe Portable Document Format - 106.64 kB - 07/17/2018 at 04:45

Preview

spiroboarda04.pdf

This is the original schematic for the PC board. While debugging, I found a few problems that require a bit of surgery on the board. I will upload a new schematic when I have finished debugging, assuming that the patient lives.

Adobe Portable Document Format - 86.23 kB - 02/16/2017 at 13:54

Preview

  • There's a New Board in Town

    Chris Johnson07/13/2018 at 19:00 0 comments

    I just finished assembling the new version of the SpiroBoard.  I hope to post testing/debugging updates over the next few weeks.

    The new design is much different than the original.  It doesn't even use the peak detect circuit that I described earlier.  Instead, it uses the pulse generation routines in the pigpio library on the RPi to generate a square wave and the associated sample-and-hold signals to measure the conductivity after the rising edge of the square wave.  Note that the square wave is 50% duty cycle, so there is no DC component.

    I will be posting a new schematic and circuit description when debugging is complete.

  • Peak Performance Success

    Chris Johnson02/13/2018 at 15:48 0 comments

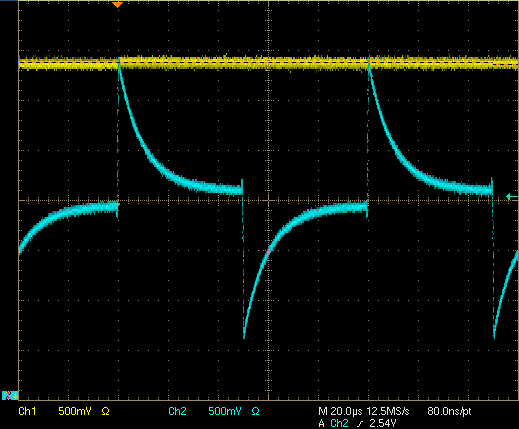
    They say that a picture is worth a thousand words, so:

    As you can see, THE NEW PEAK DETECT CIRCUIT WORKS!  It's always nice to see something work in real life versus simulation.  It's kind of hard to see exactly how close the peak detect output (yellow) matches the EC peak, but according to the automatic scope measurements, it's within 20mv.  Measuring it manually with cursors, it looks closer than that.  I can't measure the levels any closer with the scope because the large DC value exceeds the scope input range at higher vertical resolution.  I'm guessing that measuring it with the averaging effect from the ADC will produce even better results.  The real test will be in measuring actual calibrated solutions.  Right now it's running with the solution represented by a 1K resistor in series with a 10nf capacitor to generate the peaked waveform.  Real EC waveforms will likely be less peaked, which should be even easier for the peak detector to follow.

  • Digital Pot Shots

    Chris Johnson02/09/2018 at 02:29 0 comments

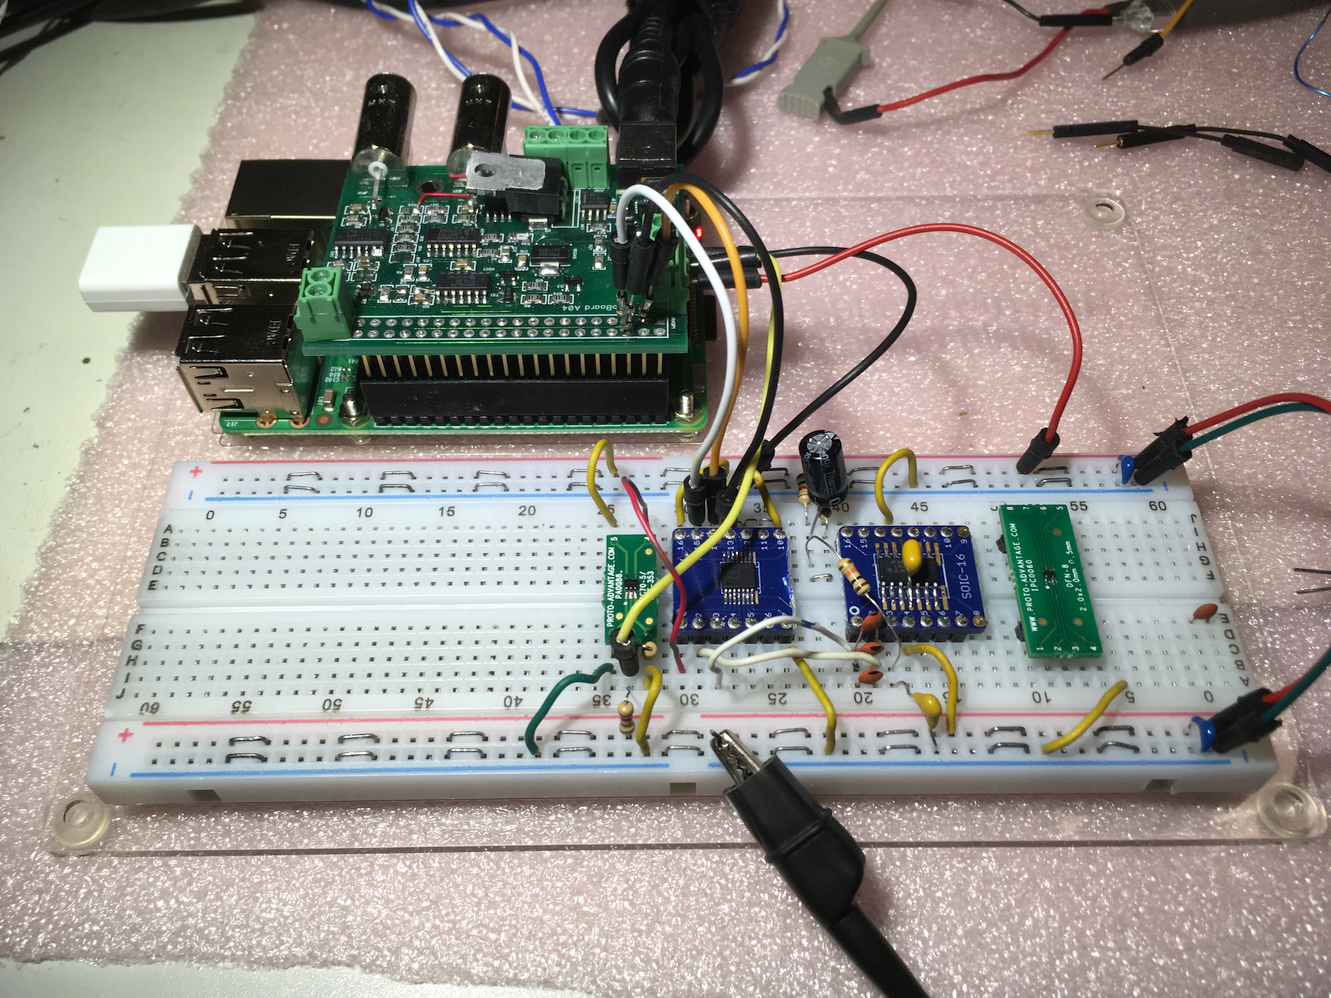
    As you can see below, I am breadboarding the new peak detector changes before committing to a new PC board.  One of the changes involves using a MAX5387 digital potentiometer to control the square wave amplitude and EC amplifier gain.  The new design uses the Raspberry PI to generate the square waves instead of an op amp square wave oscillator.  These updates allow you to have square waves with software programmable frequency and amplitude.  The op amp that was used as a square wave oscillator is instead used as a comparator to convert the 3.3V GPIO square wave into a full scale 5V square wave.  Half of the MAX5387 is used to attenuate the 5V square wave before driving the EC gain stage input.  The other half is used to control the EC amplifier gain.

    For very high conductivity solutions, you need a small amplitude square wave, because the small EC resistance causes a large amplifier gain.  For maximum accuracy, you want to make sure that the amplified square wave at the output of the EC amplifier does not get too close to the supply rails, so you minimize the square wave amplitude and EC amplifier gain to keep the output within range.  The EC amplifier gain depends on the feedback resistor and the EC resistance seen by the probe in the solution.

    After wiring up the test circuit and figuring out how to get programmable frequency square waves out of the RPI, I started testing the digital pot and ran into the anomalous glitch shown below.
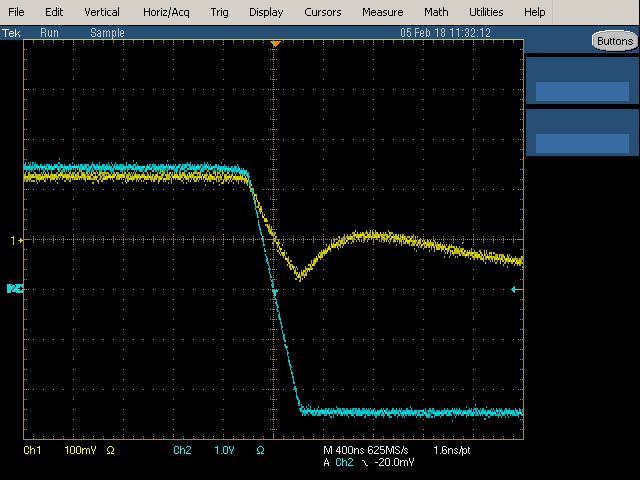
    The blue trace is the 5V 12V/uS edge rate square wave from the comparator op amp output.  It drives one end of the MAX5387 and the other end is connected to GND.  The yellow trace is the wiper output with the MAX5387 set to divide the 5V amplitude down to about 200mv  It took a while to figure out that the glitch is likely caused by capacitive feedthrough.  There must be a small end-to-wiper series capacitance that allows the square wave edge to feed through to the wiper output.  The wiper drives the input to the EC amplifier, so the feedthrough causes a glitch in the edges of the square wave at the output.  The output glitch causes an incorrect peak voltage measurement and thus an incorrect EC measurement.
    I haven't decided how to fix this yet.  One possibility is to slow down the input square wave edge so that it does not have enough high frequency content to feed through.  The other is to find a better digital pot.  I think I might go with a different digital pot, since I found the Analog Devices AD5258.  It has the unique feature that it is factory calibrated to 0.1%  and the calibration is stored in the on chip EEPROM.  The RPI can read the tolerance value and accurately calculate the full scale resistance of the pot.  Typical resistance values can vary +/-30%.  The stored tolerance allows the RPI to accurately determine the actual programmed feedback resistance.  The other advantage of the pot is that it has much higher bandwidth than other digital pots.  That may reduce feedthrough.  The only down sides are that it only has a single pot per package and it only has 64 taps.   It also comes in an MSOP package with 0.5mm spaced pins, which are a real pain to solder.  I will be ordering some to see if they can help get me out of a glitchy situation.

  • Peak Performance Revisited

    Chris Johnson01/22/2018 at 04:43 0 comments

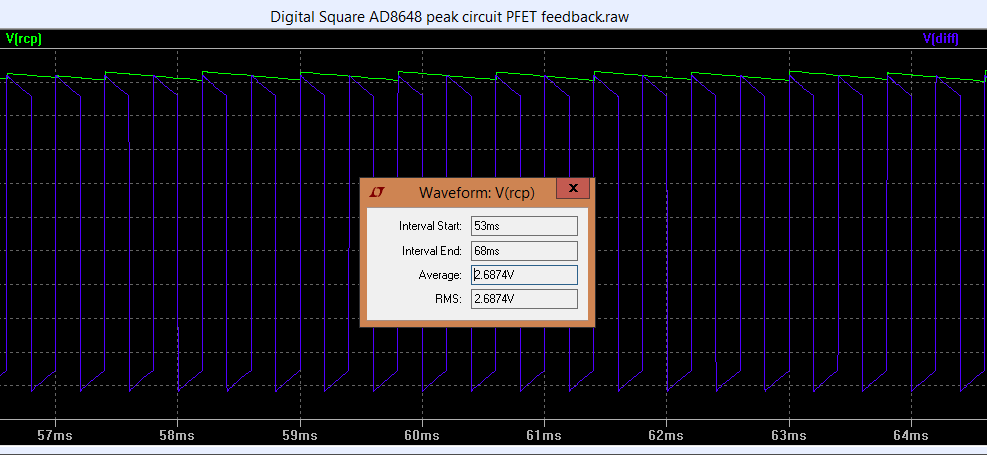
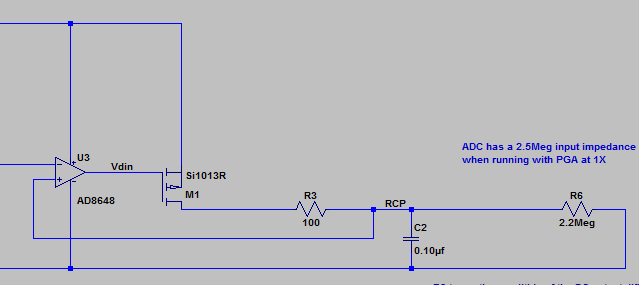
    I recently revisited the peak detect issues after a long break working on other projects.  I was still dissatisfied with the accuracy of the peak detect circuit.  I spent an evening playing around with LTSpice trying various tweaks to make it work more reliably and accurately.  The problem with using diodes in a peak detect circuit is that the voltage drop across them is current dependent.  I ran in to the issue that the diode in the op amp feedback loop had a larger voltage drop than the diode in the output path, so I was getting an offset is the measured peak amplitude.  I knew about the the technique of creating a "perfect diode" using MOSFETs and hit upon the idea of using a MOSFET in the output.  The resulting circuit is shown below.   In simulation, it works REALLY well.  The actual peak voltage is about 2.6878V and the peak detected average is 2.6874V, as shown in the plot below.  The ADC measures the average value, since it has a built in low pass filter with a cut off frequency far below the square wave frequency.

    The signal to be peak detected comes in on the negative input of the op amp.  When the negative input is below the RC low passed (RCP) voltage, the op amp output is driven to the 5V rail, the PFET is turned off, and the voltage on C2 slowly fades due to the 2.2M load from the ADC input.   When the negative input is above the RCP voltage, the op amp drives the PFET gate low which charges C2.  When the voltage at C2 exceeds the input voltage, the op amp drives the gate back high.  The net result is that the voltage at RCP tracks the positive peak of the input.  With a repetitive signal like the EC response to a square wave signal, the output is a very good approximation to the peak of the input square wave.

    Note that the accuracy of the result depends of the relationships between the speed of the op amp, the PFET, the RC time constants, and the ADC load.  A high speed op amp and PFET give better results, since the PFET turns off  more quickly when the peak voltage exceeds the input voltage.  A low threshold on the PFET also helps by reducing the turn on delay due to the op amp output slew rate.  The Si1013R PFET is low cost, low resistance, low threshold, and relatively fast.  I have some parts on order and hope to breadboard a test  circuit next weekend.

    Earlier in the development process, despite all of the searches that I did on peak detect circuits, all I came up with were diode based ones.  With this circuit, I thought that I had come up with something new.  Of course searching for "peak detect mosfet", you come up with a nice reference about MOSFET based peak detectors (Analog CMOS peak detect and hold circuits. Part 1. Analysis of the classical configuration).  Note the "classical configuration" description.  It seems that I reinvented the wheel.  But it's still a nice wheel.  Hopefully it rolls as well in real life as it does in simulation.

    By the way, if there is anyone actually reading these log entries, don't hesitate to post in the discussion area with any questions, comments, corrections, or even constructive criticism.  How's that for some amazing, astounding, awesome, astonishingly awful alliteration?


  • When the Chips Hit the Fan

    Chris Johnson03/14/2017 at 03:15 0 comments

    I received my AD8648 op amps from Digikey. For small orders weighing 13 oz or less (including packaging), you can't beat their price of their first class USPS shipping. I get my orders on the east cost within two or three days for only a few dollars. Replacement chips in hand, I removed and replaced the op amp, but the EC circuit still doesn't quite work. Because of the higher gain of the AD8648, there are now occasional oscillatory bursts at the peak circuit op amp output. These only occur when the op amp amplitude is relatively low, which happens at low EC values. The net result is that the peak circuit can not measure EC peaks that are lower than the noise burst, because it instead captures the noise burst. But, I still have other chips to fry.

    As a general rule, when debugging a board, until I am very sure that it is operating correctly, I power it with a current limited supply that has an output current and voltage display. This helps get an idea of the normal current draw for the board and protects from accidental short circuits. In this case, on one particular power up to continue looking at the oscillation problem, the power supply started current limiting at about 1.5V / 1.5A. Previously, it had hovered around 5V / 150ma, even with the Raspberry Pi running. Feeling the chips, the VCOM regulator (REG2V5 in the schematic) was hot. I measured the resistance between VCOM and GND and it was about 1 ohm. I lifted the VCOM pin on REG2V5 and VCOM was no longer shorted to 2.5V. So, I replaced REG2V5, powered up again, and the supply STILL current limited and the chip STILL got hot. Very depressing. After desoldering and lifting various pins on the +12V_IN net, I determined that the 12V input to REGA5 was shorted to the 5V output. Chips rarely die unless something actively kills them. I could not think of anything that I had done to cause this poor chip to short itself from input to output. It's only providing a few tens of milliamps of current to run the analog portions of the circuit.

    Through the years, I have found that keeping a good debug log is often helpful. Just the act of writing down your thoughts about what you know, what you think might be happening, what you think you changed, etc. can sometimes help you find a solution. In this case, the answer did not actually hit me until I was writing up this project log entry. As I typed the sentence above about checking the 12V net, it occurred to me take another look at the TPS73250 (REGD5) voltage regulator datasheet. Low and behold, I blew it. Literally. I blew up REGA5 by driving a 6V absolute max input with 12V. The valiant TPS73250 ran for weeks of testing, providing a nice regulated 5V output, until finally giving up the ghost and shorting from input to output. That of course put 12V on the input to the VCOM regulator (REG2V5), blowing it up as well. So, I need to figure out a way to limit the input to REGA5 to around 6V and to replace REGA5 and REG2V5 (again). Another debugging rule, always order a few spares. Ultimately, I will probably have to replace REGA5 with an LDO that supports 12V input ... and remember to read maximum input voltage specifications more closely. Once I get the power supply issues fixed, it will be back to solving the oscillation issue on the AD8648 peak detect circuit.

    An old Linear Systems professor of mine once said "Life is a series of transients waiting to die out". That was certainly the case for the poor LDO that gave its full measure in support of the Spiroboard debugging effort.

  • Peak Performance

    Chris Johnson03/08/2017 at 04:00 0 comments

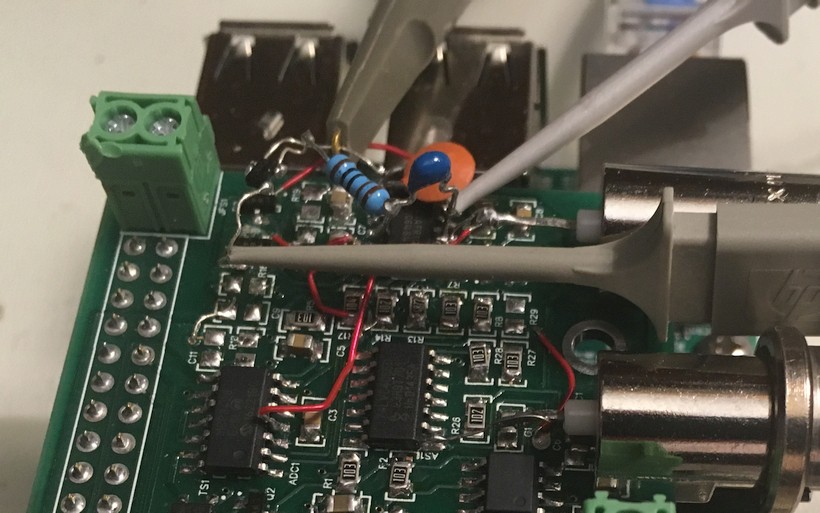
    Below is a picture of a patch that gates the input to the ADC so that it is only looking at the value from the EC probe at the end of the square wave pulse, after the initial transient has settled out. It works really well, dutifully recording the voltage at this point for each pulse and averaging the values together with an RC filter. Unfortunately, this does NOT provide the correct EC value. After a lot of Googling, head scratching, and teeth gnashing, I think have a better understanding of how to measure EC.

    To measure the correct value for the EC, instead of measuring the voltage at the end of the pulse, you need to measure the peak voltage at the start of the pulse. As shown below in a snippet from an LTSpice schematic, you can simulate the effect of a real EC probe by putting a capacitor (C11) in series with the simulated EC resistance (R4). In the plot to the right, the red trace is the DIFF output from the op amp and the green trace is the output of the subsequent peak detect stage. The average value of the peak detect is very close to the lower voltage peak of the DIFF output. The peak DIFF voltage is due to the current that initially flows through the solution as the ions begin to separate due to the voltage across the EC probe. As the solution "charges up", the current flow through R4 drops. Eventually the op amp behaves like a voltage follower, since R4 is essentially an open circuit. The DIFF level at the end of the pulse is thus the same as the 100mv square wave that drives the non-inverting input. Note that the peaking effect is most pronounced with high conductivity solutions.

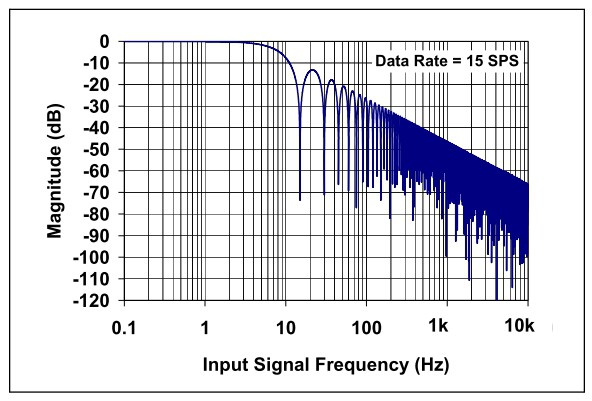
    In the above circuit, the pulses are running at about a 500 Hz rate. In the final circuit, in order to provide a more accurate peak detect function, the pulses will run at about 5 KHz. As you can see from the frequency response plot for the MCP3428 ADC, the low pass filter has about 60dB of attenuation at 5 KHz. As a result, the ADC will record the average value of the peak detect voltage without any additional external filtering.

    I made another patch to the board and verified the basic operation of the peak circuit. Using my home made EC probe, the ratio between the EC values measured for two test solutions is very close to the ratio measured using an off the shelf EC meter. During testing, I determined that the LMC6484A is not quite fast enough to accurately detect the peaks in all cases, so I am changing to an AD8648 op amp. It is pin compatible and has about 10 times the output slew rate. It also has a 1 Tera Ohm input impedance to support the pH probe. Once I change the op amp and make a few more tweaks, I hope to finally verify that the EC circuit works correctly. I will update and post a new schematic after testing is complete.

  • EC or not EC: that is the question

    Chris Johnson02/21/2017 at 15:05 0 comments

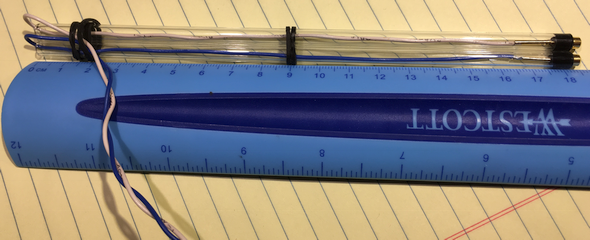
    For some reason, EC probes are relatively expensive. In most cases they are more expensive than pH probes, which to me seem a lot harder to make. So, I decided to make my own EC probe, as you can see below:

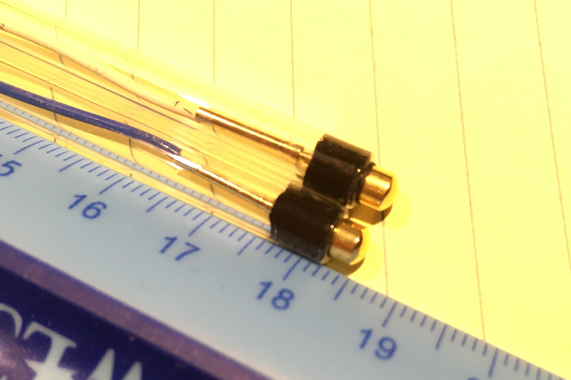
    The contacts are gold plated Studex ear piercing studs, which are made in the USA and only about $1 each. Gold is good for EC probes because it does not tarnish. The studs are pushed through a piece of 4mm O-Ring cord to waterproof the electrical contacts. The tubing is 6mm OD x 4mm ID flint glass, which is about $0.25/ft if you buy a 1 pound pack. It is very easy to snap to length. Here is a great video about how to cut and fire polish glass tubing. I would recommend a triangle diamond needle file for scribing. I got this set at Amazon and they worked fine. So, for less than $5 worth of parts (ignoring shipping, tools, and unused material), I was able to make an EC probe.

    I had previously verified that the Spiroboard EC circuit could correctly measure the calibration resistors that can be switched in to the circuit under control of the Raspberry PI. By doing a best fit line to the calibration resistors, the circuit could also measure a random resistor plugged onto the EC input to within about 0.5%. So, I though there would be no problem getting the circuit to measure the EC of a real solution.

    This is where the "not EC" part comes in. Every EC probe has a K constant that is based on the geometry of the probe contacts. For simple probe geometries it can be calculated. You can also work backwards from measuring several known conductivity solutions to calculate the K factor. This is what I attempted to do for my DIY EC probe, unsuccessfully.

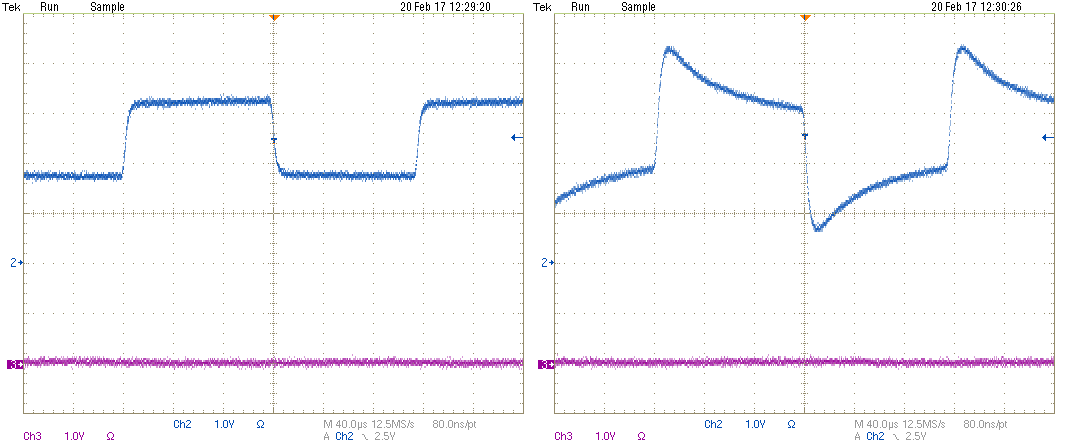
    After a lot of poking around and wiping up spilled calibration solutions, I found the problem. The scope screenshots below show the input to the AC-to-DC portion of the EC circuit when measuring a resistor (left) versus measuring an actual solution through the EC probe (right, but unfortunately wrong). The peaking is caused by the capacitance of the EC probe and the solution. The peaking breaks the linear relation between resistance and the output of the AC-to-DC circuit. The original circuit that I based this on used a sinusoidal oscillator. My assumption is that it does not have a similar problem because the relatively slow rise of the sine wave masks the peaking effect. Bottom line, the EC circuit as designed can not accurately measure the EC for real solutions.

    But, all is not lost. A solution (pun intended), is to dispense with the AC-to-DC circuit entirely and just directly measure the DC voltage after the peaking has settled out. I successfully Spice simulated a circuit modification and now need to figure out the best way to patch the board to support it. Since the ADC now directly measures the output of the EC amplifier, this method could potentially be more accurate than the AC-to-DC version.

  • pH and EC Circuits Tested

    Chris Johnson02/17/2017 at 22:47 0 comments

    I just got the pH portion of the circuit working. There actually wasn't anything wrong with the circuit. It turns out that the probe that I was initially was using was bad. I tried a different brand and it worked perfectly. The working probe is listed in the Components section of the project. It's quite reasonably priced.

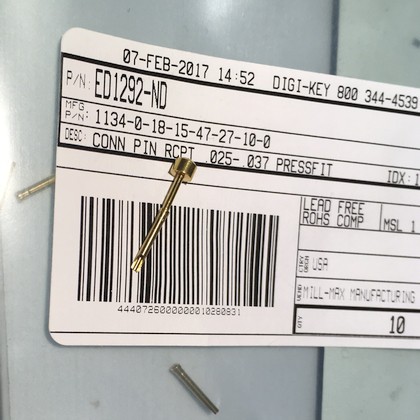
    I also verified the operation of the EC circuit using resistors in place of an EC probe. In order to test the conductivity of actual solutions, I am in the process of making a DIY EC probe using, believe it or not, ear piercing studs. They are gold plated stainless steel, only about $1 each, and have a pointed end that plugs very nicely into a gold plated Mill-Max machined pin contact (see image below). Correctly waterproofed, I should be able to make a cheap EC probe with replaceable contacts. Once I have it working, I will add a separate project on how to make your own EC probe. In the true MacGuyver spirit, perhaps I'll waterproof it with chewing gum.

View all 8 project logs

Enjoy this project?

Share

Discussions

colton.baldridge wrote 12/26/2022 at 15:49 point

Wow, I know I'm late to the party, but just wanted to see where this project is at. Do you have any updates on how well it works/worked? I'd be very interested in recreating this

  Are you sure? yes | no

Chris Johnson wrote 12/29/2022 at 18:51 point

The EC circuit works well, but there is too much leakage between the pH circuit and the EC electronics.  Since both circuits have a sensor in the water, the EC sensor can affect the pH measurement.  I haven't come up with a good solution for the pH issue yet, but I haven't been able to spend much time on it.

  Are you sure? yes | no

B wrote 10/24/2019 at 13:29 point

Hello,

I have found your project (btw congratulations!) after reading at your question on electronics.stackexchange.comconcerning the use of a square wave signal.

I also want to build an electrical conductivity sensor and I have the same question. Would a square wave instead of sinusoidal signal work ?

It seems you have chosen the square wave voltage, could you explain why you did this choice?

Many thanks

  Are you sure? yes | no

Chris Johnson wrote 11/21/2019 at 12:16 point

If you are referring to this: https://electronics.stackexchange.com/a/386103/159890 , the answer and the comments cover my thoughts.  I chose the square wave because it was both easier to generate and produces more accurate results.

  Are you sure? yes | no

Chris Johnson wrote 03/08/2019 at 14:30 point

It measures within a few percent of a commercial meter.  It has very good repeatability, typically measuring within 0.5% on successive measurements on calibration solutions.  So with calibration, it could be very accurate.  The sampling timing could also be tweaked to improve accuracy.  For now, it is more than accurate enough for my purposes.

  Are you sure? yes | no

rashidkazemi1993 wrote 03/08/2019 at 14:14 point

do you test your circuit? How accurate of the measurment of the device for conductivity?

  Are you sure? yes | no

Chris Johnson wrote 07/23/2018 at 04:21 point

S3 and S4 are controlled independently by ENINL_RC and ENOUTH_RC to sample the input and output voltage of the op amp in order to measure the gain.  The switches feed the same ADC channel to avoid the small gain differences between different ADC channels.  The switch enable edges are slowed down with RC time constants in order to minimize capacitive feed through from the switch control input to the switch output.

  Are you sure? yes | no

rashidkazemi1993 wrote 07/22/2018 at 10:16 point

Nice idea for conductivity meter circuit !!!

how does your sample and hold circuit work, because you connected both side of switch to pulse in schematic?

  Are you sure? yes | no

Similar Projects

Does this project spark your interest?

Become a member to follow this project and never miss any updates