Close
0%
0%

Energy Analytics Dashboard for Tapo / Kasa

Self-hosted Grafana-based energy analytics for TP-Link Tapo and Kasa devices, bundled into a lightweight Docker stack. Deploys in minutes.

Similar projects worth following
0 followers
Real-time and long-term energy monitoring dashboard using Grafana, InfluxDB, and Python. Fast and simple deployment using Docker Compose. Immediate data population and visibility.

Automatic discovery and and energy usage logging for supported TP-Link Tapo and Kasa energy monitoring smart plugs on your local network using python-kasa.

Key functions and features ⚡

  • Fully automated deployment using Docker Compose, real-time statistics visible immediately
  • Grafana dashboard pre-configured with the following real-time and long-term metrics:
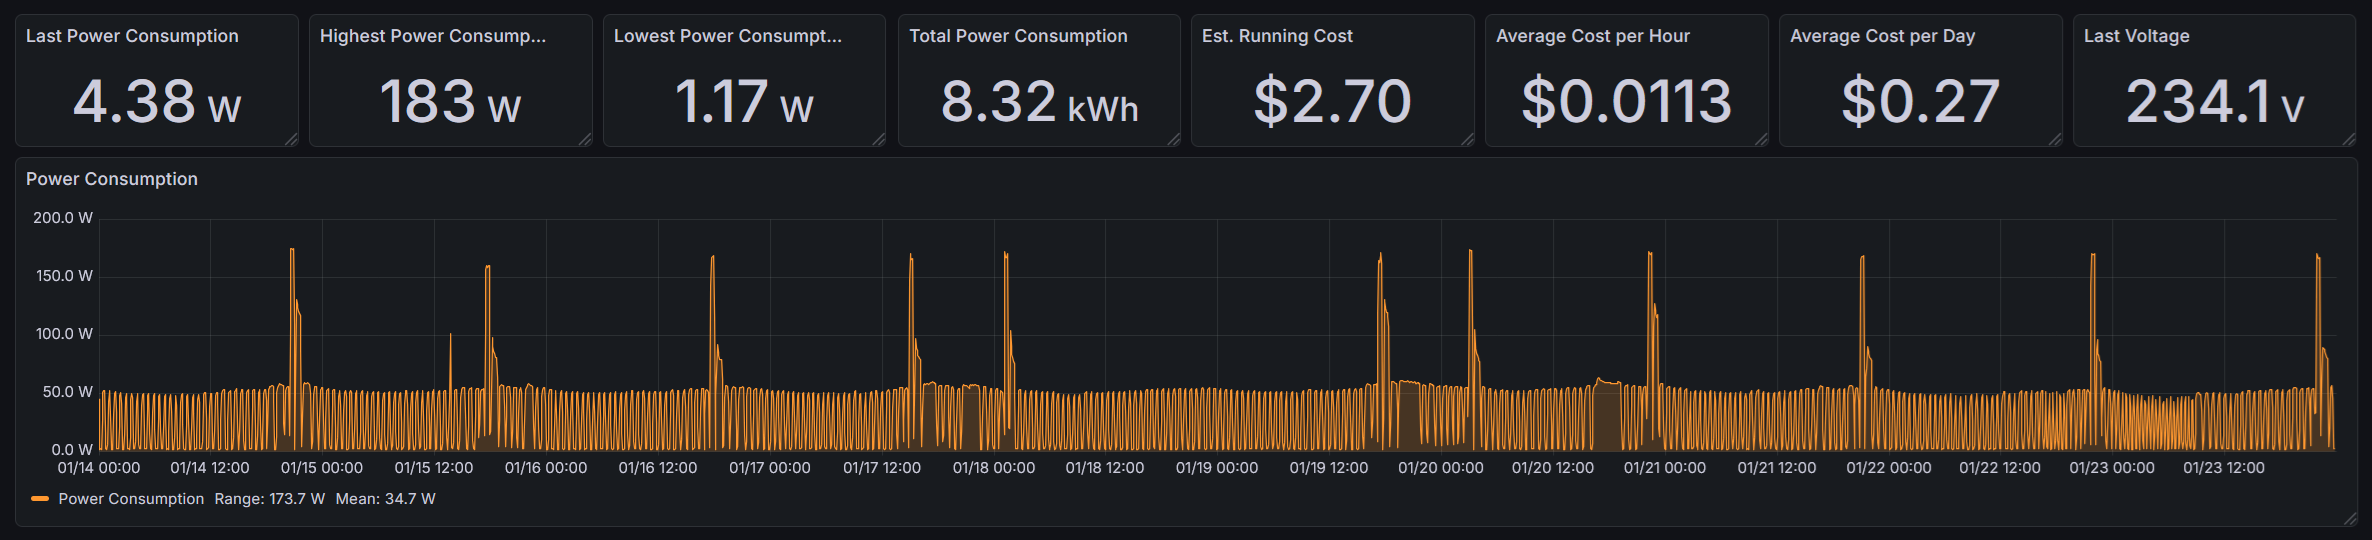
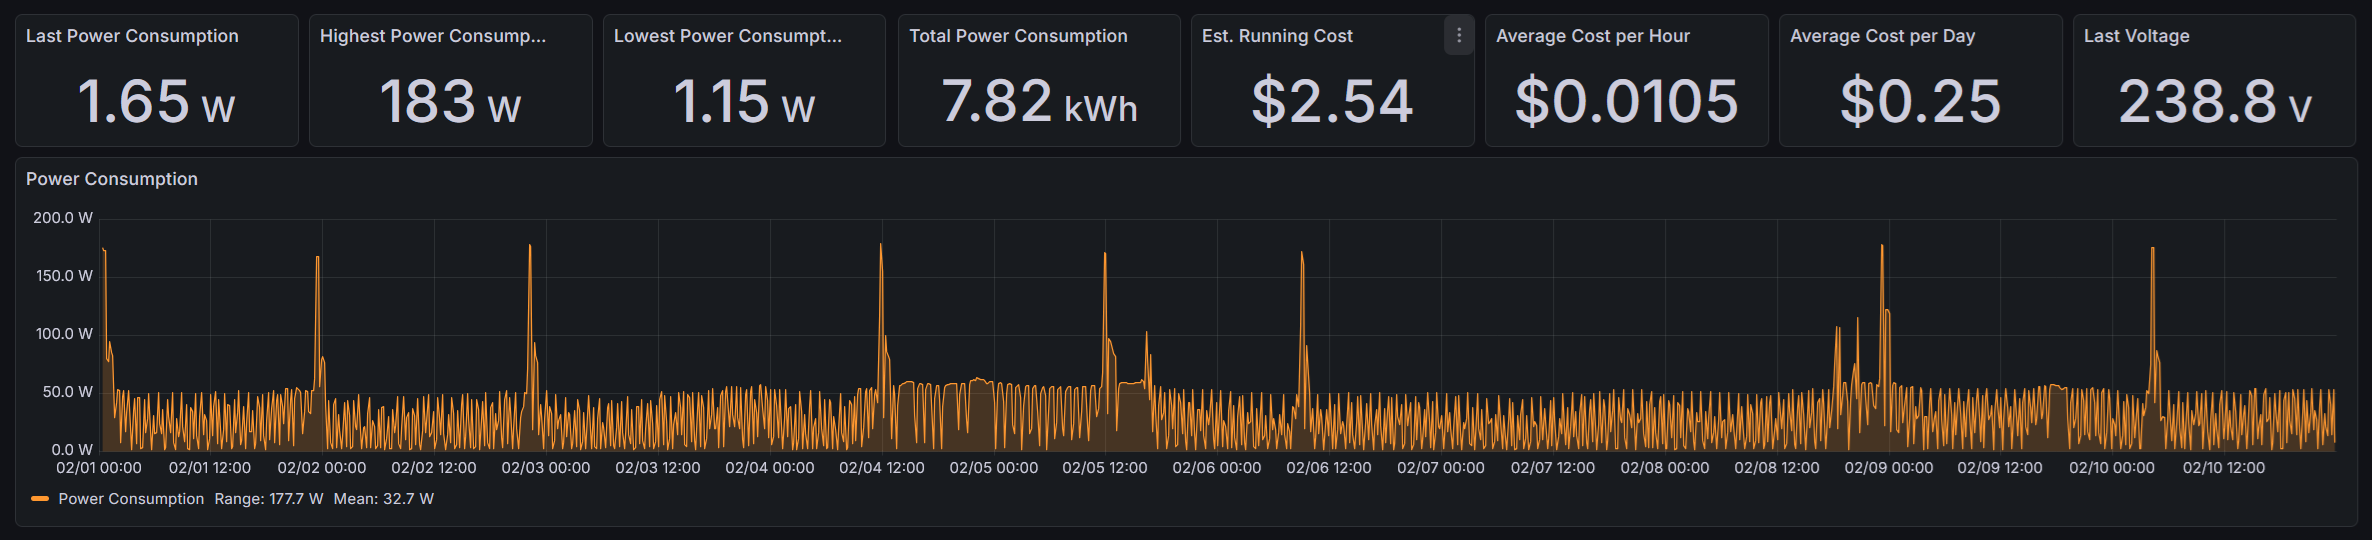
    • Power Usage (W):
      • Histogram plot
      • Numerical readouts for last, highest, lowest, range, mean and total usage
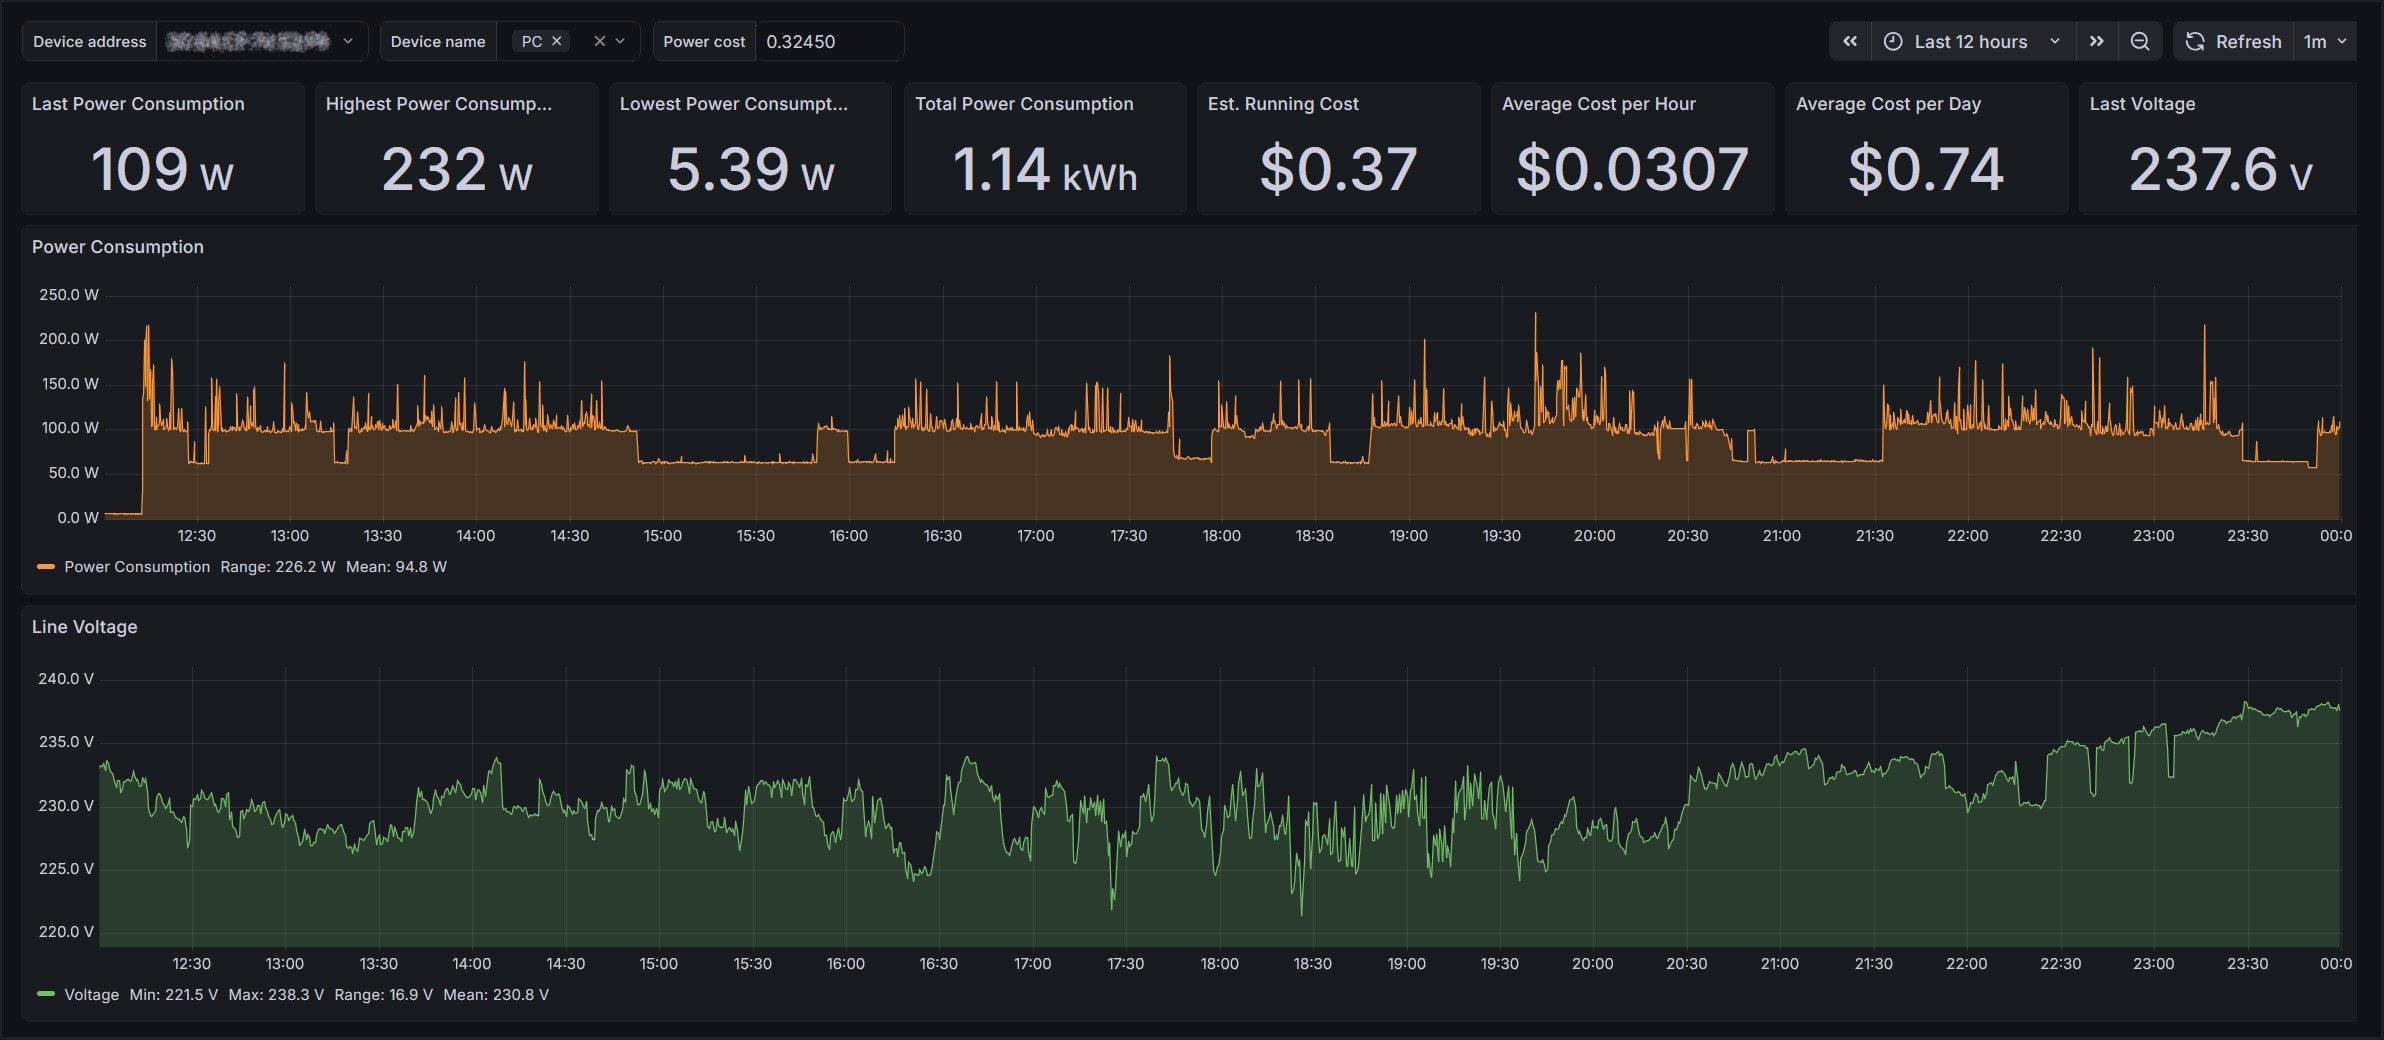
    • Voltage (V):
      • Histogram plot
      • Numerical readouts for last, highest, lowest, range, and mean voltage
    • Running Cost ($):
      • Average cost per hour/day, estimated total cost
  • Filter data by MAC and time window, and optionally device name (as configured in Tapo app)
  • Real-time and historic statistics with instant and projected costs based on trends of the selected time window
  • InfluxDB v2 back-end time-series optimised database providing hugely efficient storage and indexing; low storage requirements and SQL-like querying
  • Automatic device discovery, querying and logging using python-kasa and influxdb-client-python
  • Set and forget with new devices appearing automatically and years of data retention, even on limited storage
  • Low resource consumption means you can run it on super constrained hardware such as Raspberry Pi 3

Power profiling examples and use cases 📈

  • Observe and identify specific device power consumption trends over time
  • Understand duty cycles and determine efficient running modes
  • Identify inefficient appliances and quantify standby power usage
  • Track ongoing running costs of specific devices over short and long term
  • Extrapolate hourly and daily running cost estimates from selected time window
  • Monitor seasonal or time-of-day usage patterns

Requirements 🔧

  • Linux host (x86 or ARM): Including Raspberry Pi. Windows is not supported; python-kasa requires host networking mode for broadcast discovery, which isn't available under WSL.

  • Docker Engine: If not already installed, follow the platform-relevant install instructions here: https://docs.docker.com/engine/install/

  • Docker user permissions: Ensure your user is added to the docker group (log out/in for changes to take effect):

    sudo groupadd docker
    sudo usermod -aG docker $USER
    
  • Ssupported TP-Link smart plug(s): One or more Tapo P110 and/or Kasa HS110. Other energy-monitoring models may work but are untested.

  • Third-Party Compatibility enabled in Tapo app: In the Tapo app, open the account (“Me”) page, navigate to “Third-Party Services”, and ensure that “Third-Party Compatibility” is enabled

Read more »

  • What does the "eco" button on my fridge do?

    Ignorant of Thingsa day ago 0 comments

    My fridge has a mystery "eco" button on it.  When I press it, it plays a happy tune and a letter "e" shows on the display.  I'd like to think that I'm doing good by my fridge and the environment by pressing it.

    But I have no idea.  What does it do?  Is it more economical?  Or am I just being offered... cold comfort? ❄️


    To test, I ran the fridge in normal mode for a month, then in another month in eco mode.   I then had a look at weather data for the test period and made sure there were no excessively hot days to skew the results - it's summer at the moment and it reached 44 degrees C here at one point!  Using this data, I selected 10 consecutive days from each sample that were roughly comparable.

    Here's what those 10 days look like in full power mode:

    And here's the eco mode for the comparison period:

    Already, I can see a notably different duty cycle, and the numbers are in!  I'm saving an underwhelming 2c a day 💰 or around 50 watt-hours.  At least I won't die wondering, but with that said... we need to go (slightly) deeper.


    Zooming into an 8-hour section of each, the difference in cycles is apparent:

    The longer duty cycle is the normal mode, with the shorter/variable duty cycle being the economical mode.  The ramp up and down remains the same, as does the peak power (within a few W), which tells us that only the modulation of the compressor is changed, and it's not otherwise being driven any differently.

    The histogram suggests a narrower hysteresis band, giving shorter, more frequent cycles.  If the eco mode is a user setting, it implies some sort of tradeoff... with temperatures being set the same, it may just come down to compressor wear or noise preference 🤷

    So, I guess it can stay.  Adjusted for inflation and power price rises, I stand to save maybe $100 over the lifespan of the unit. 

View project log

  • 1
    Install Docker and create user permissions

    Docker Engine: If not already installed, follow the platform-relevant install instructions here: https://docs.docker.com/engine/install/

    Docker user permissions: Ensure your user is added to the docker group (log out/in for changes to take effect):

    sudo groupadd docker
    sudo usermod -aG docker $USER
    
  • 2
    Enable "Third-Party Compatibility" in the Tapo app (if not using Kasa)

     In the Tapo app, open the account (“Me”) page, navigate to “Third-Party Services”, and ensure that “Third-Party Compatibility” is enabled.

  • 3
    Clone the repository

    Clone the repository to your device:

    git clone https://github.com/cjastone/tplink-powerdash.git
    

View all 7 instructions

Enjoy this project?

Share

Discussions

Does this project spark your interest?

Become a member to follow this project and never miss any updates