 mircemk

An audio spectrum analyzer is a tool that shows the frequency content of sound in real time, helping visualize how loud different frequencies are within an audio signal. In one of my previous videos, I described how to build a Stereo VU meter on CrowPanel 3.5"-HMI ESP32 Displays. This time I will describe how to build a visually effective stereo Audio Spectrum Analyzer on these same display modules. I will even use the same housing design and audio input section.
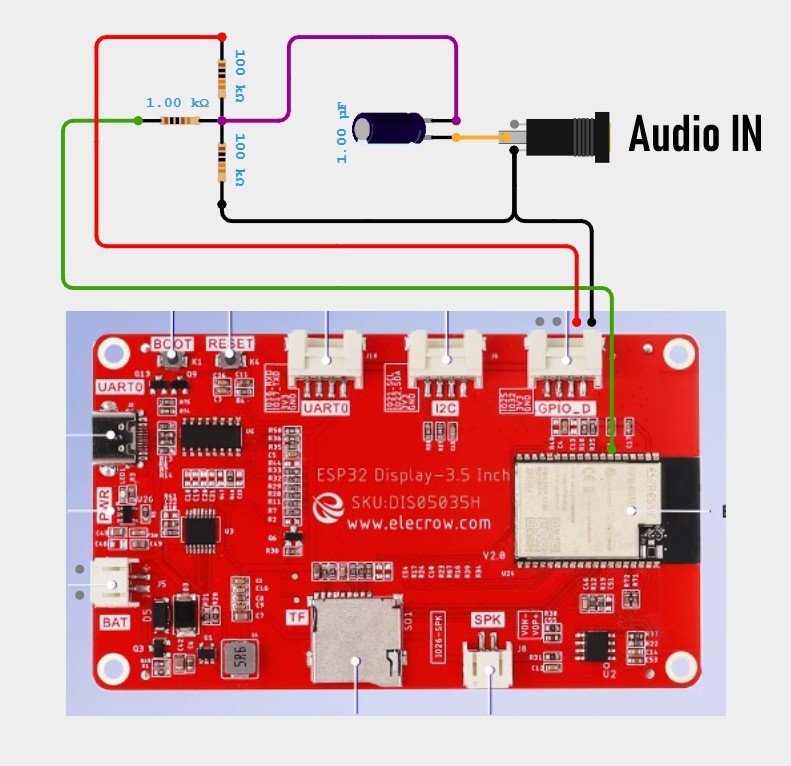
So the schematic is basically the same with the note that for the input signal I use the GPIO35 pin from which I have directly extracted a thin wire, for reasons that I explained in the above-mentioned VU meter project.
This project is sponsored by PCBWay. Don't forget to visit the PCBWay Open Source Community where you will find countless useful projects divided into different categories. Choose your area of interest where you will find many useful and free projects. You can here also download Gerber files or order ready-made PCBs for some of your future projects. PCBWayhas all the services you need to create your project at the best price.
The input AC signal is fed to the GPIO35 pin, to which a reference voltage of 1.6V has previously been applied through two 100K resistors. The positive and negative values of the input audio signal move around this voltage. The capacitor serves to block any possible DC component, and the 1K resistor to protect the input from inappropriate signals.
As for the code, it is made to be highly customizable and by changing the variables defined at the beginning, you can achieve any type of bar movement you want. All of these parameters affect the way and speed of movement of the Bars.
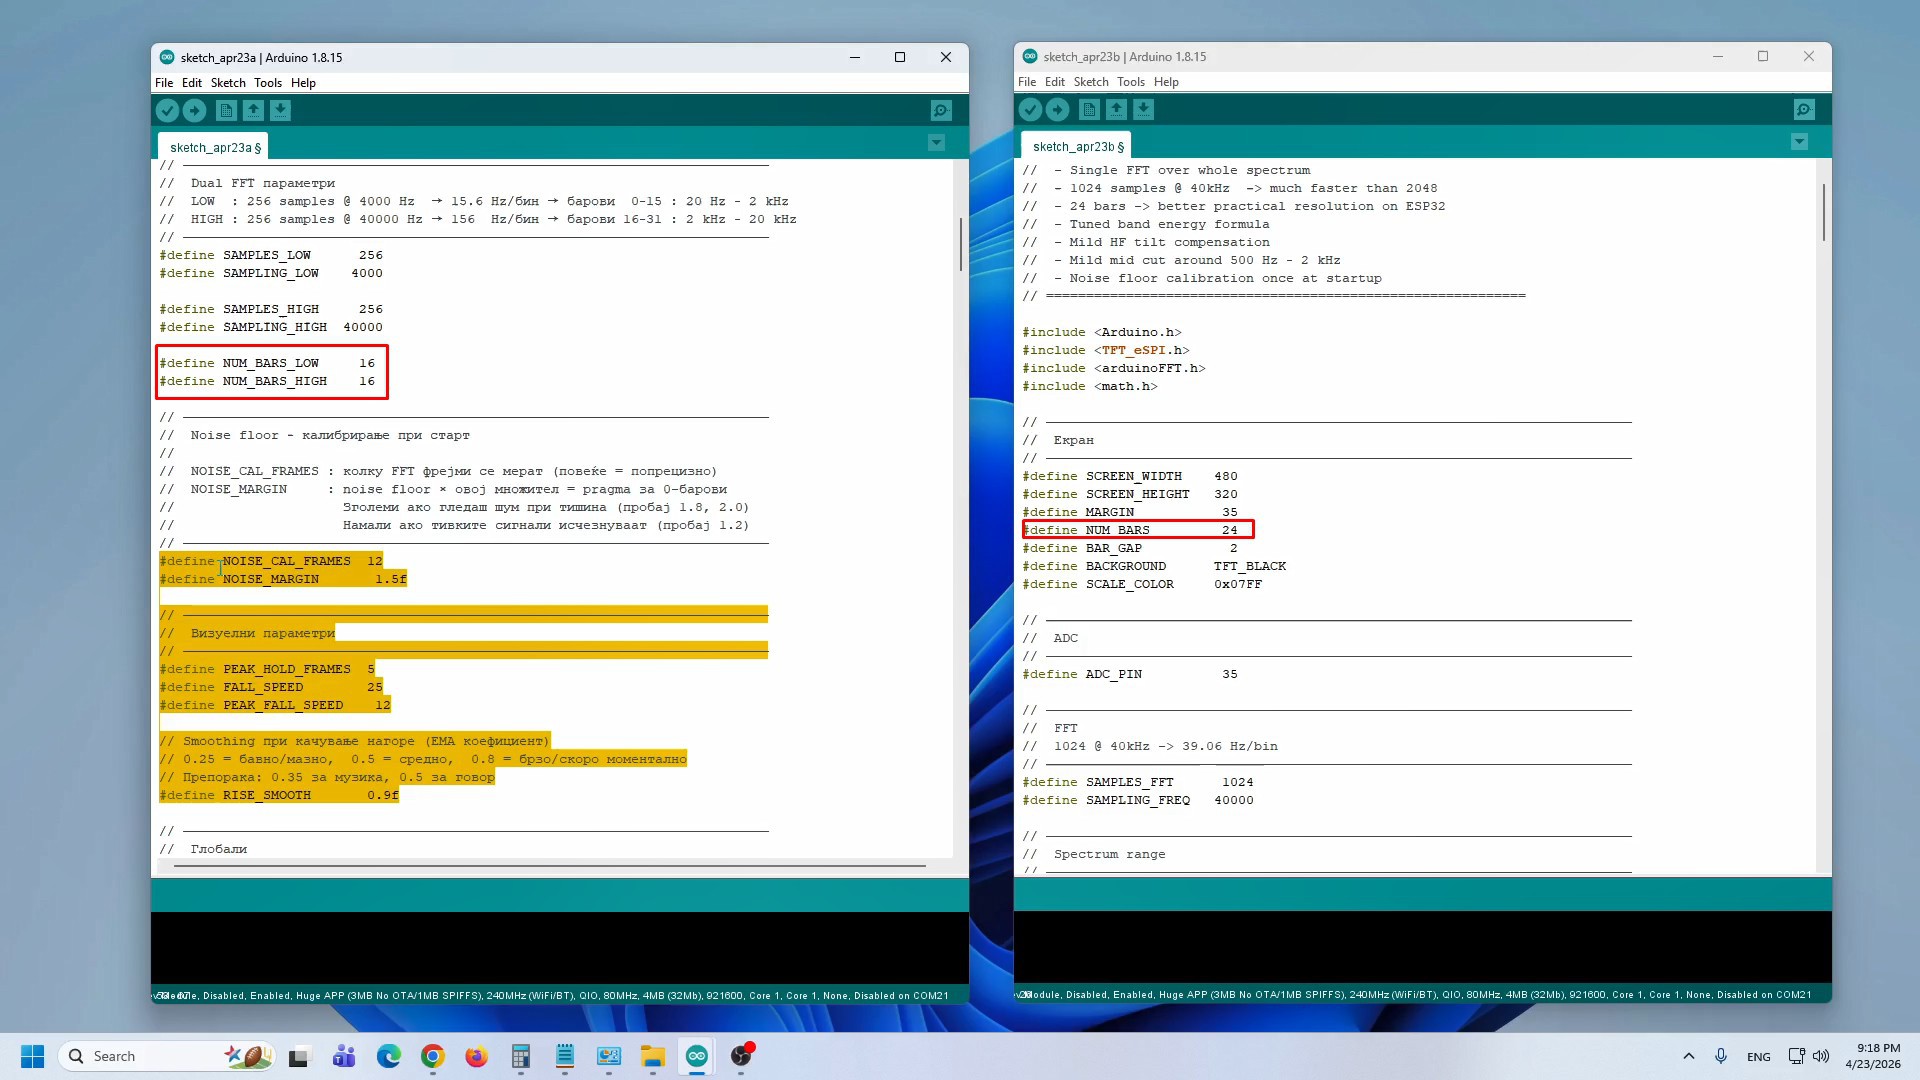
Two different codes are given, one with 32 bars and a specific way of processing frequencies (the range from 20Hz to 20kHz is divided into two parts and those two parts are processed separately), and the other, a standard code with 24 bars. To upload the code without errors, you need to select "ESP32 DEV Module" in the Board Manager and install the libraries given at the end of the text. I would like to mention that it is especially important to use the given TFT_eSPI library, since it is specifically set for this project.
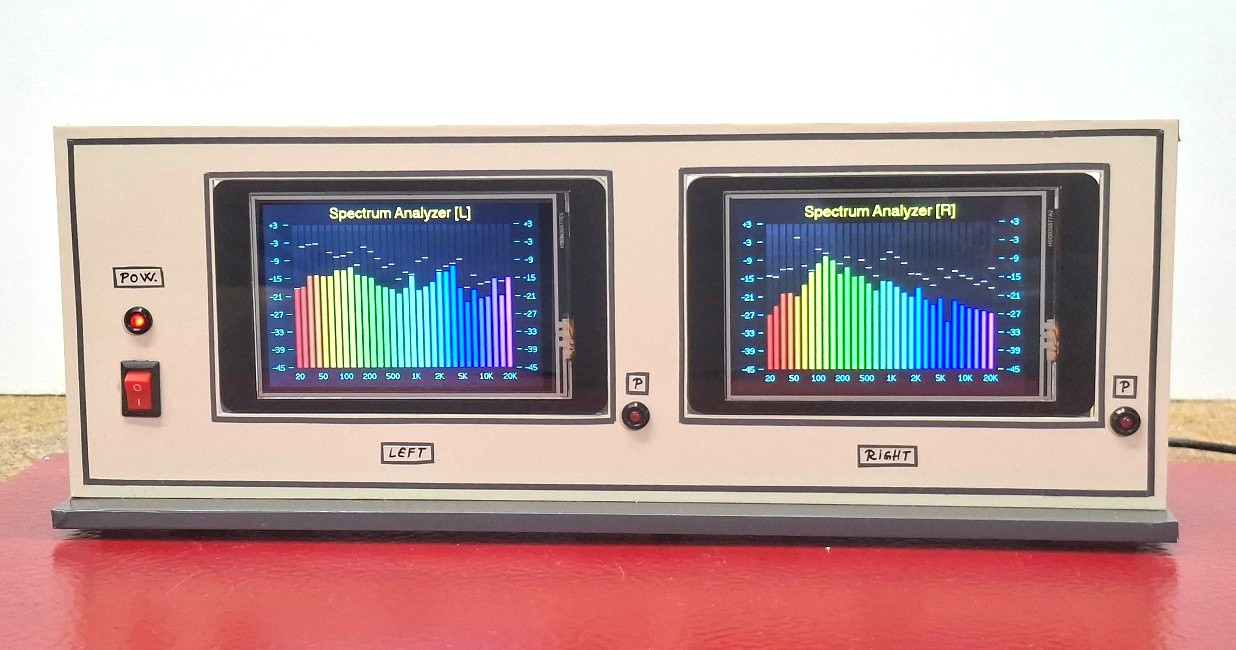
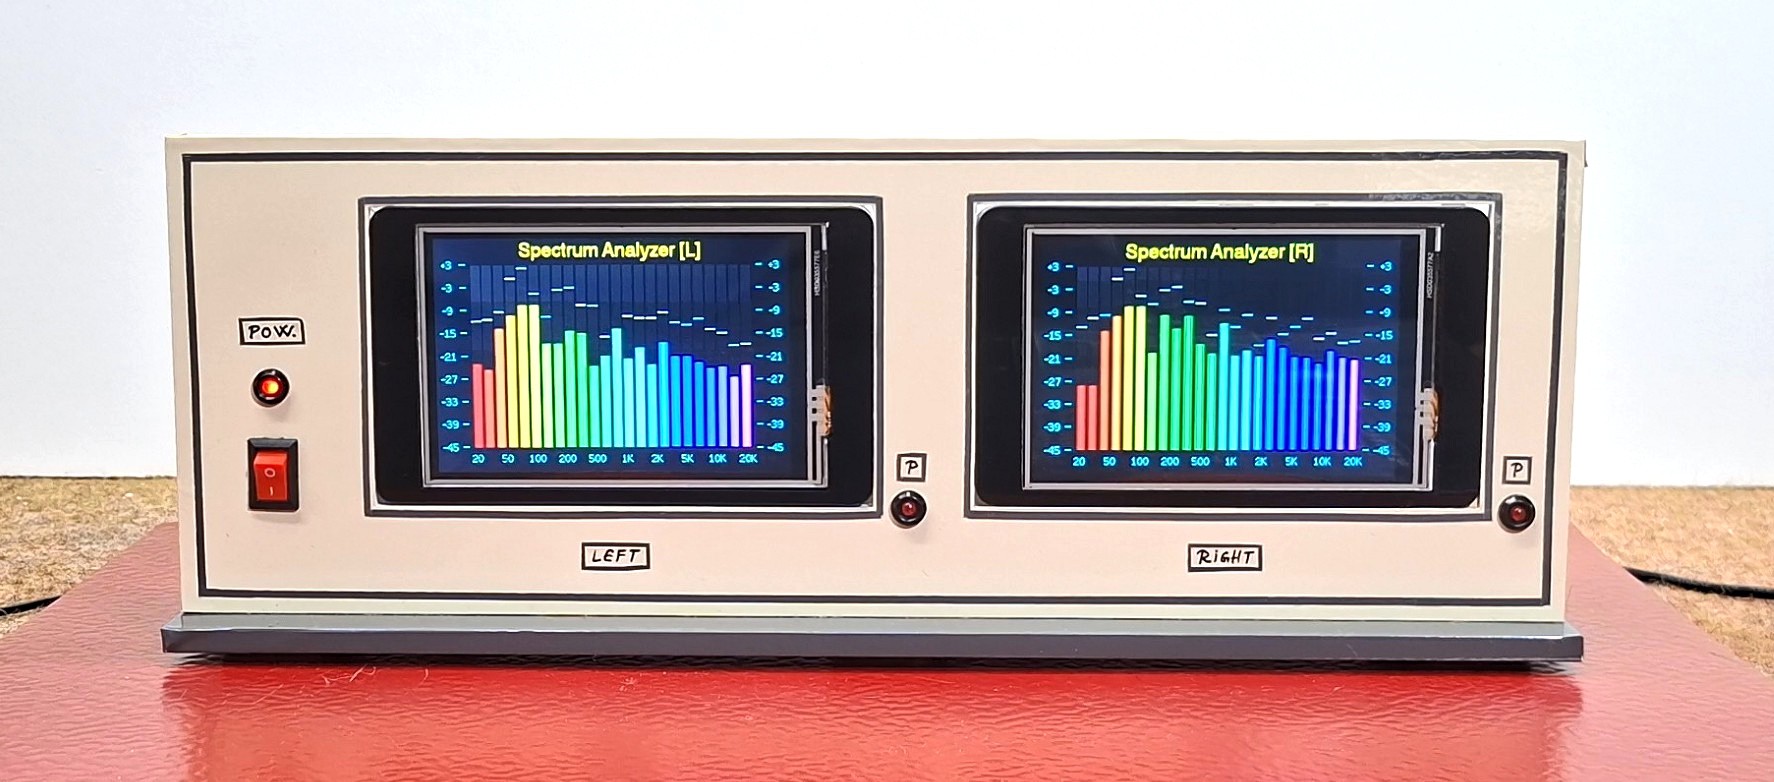
It is worth mentioning that this is not a precise audio instrument, but primarily an interesting visual addition to the audio system. In this project, the sound is processed in a way that the extremely low and high tones are amplified at the expense of the midrange band, which is naturally the most intense, and all this for a better visual impression. Also, in reality, the bars are 3D processed and look like thin tubes, which is not noticeable in the video.
Now let's see how the device behaves in real conditions with different input signals. When starting the device, the input signal must be at zero, because in the first few seconds is performed a noise floor calibration.
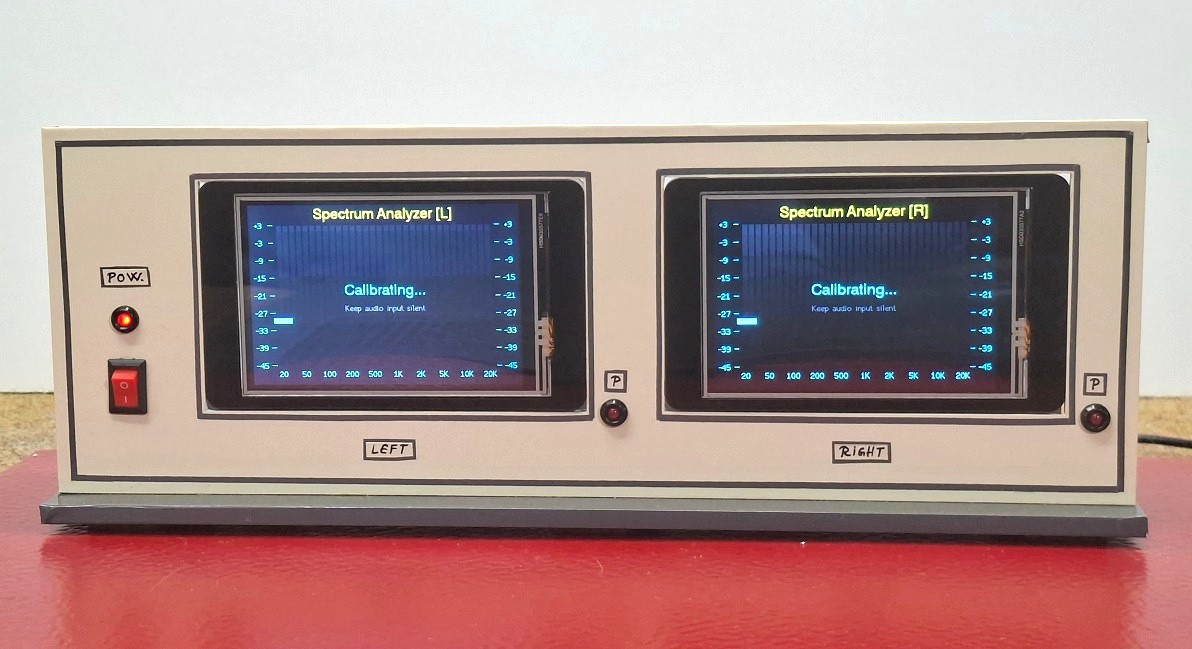
And finally a short conclusion. The CrowPanel 3.5" ESP32 proves to be an incredibly versatile platform for high-speed audio visualization. By combining custom FFT logic with the optimized TFT_eSPI library, I’ve created a audio analyzer with impressive visual effect.
 uELKO
uELKO
 Daphne