Samuel Wantman
-
2015 Update
08/28/2015 at 03:51 • 0 commentsWe've been hard at work on the next phase of this project. We've installed a capacitive moisture detector in the egg sensor, changed from 8 AA NiMH batteries to 3 AAAs, added a solar cell that keeps the batteries charged up until they totally die (about 10 years?), and changed the connection between the sensors and the communications tower to a single RG6 coax cable. The coax will power the sensors and also carry data. A single communications tower will be able to handle multiple sensors simultaneously (we're not sure how many yet, but it should be about a couple dozen). The coax should be much more reliable than the Cat5 cable we have been using, and make it easier and cheaper to build and maintain. A coax cable can be repaired in the field in about a minute. There will be lots of ways to extend the system using SPI, I2C, and analogue and digital connections. Software will be field updatable, and we've been working on server-side visualization of the data. For more information about our progress, please visit http://turtlesense.org.
The National Park Service has been using the system this summer with excellent results. One sensor failed, but every other nest has provided data that was used to accurately predict when baby sea turtles would emerge from their nests. Most of our predictions were about 4-5 days before emergence, and the prediction was usually correct within a day. We were able to spot nests that were infertile, and were only incorrect when we predicted an infertile nest, but in fact less than 10 percent of the eggs hatched. While we missed that handful of hatchlings, the NPS was able to rescue about 75 hatchlings from almost certain drowning because of our system. We knew that they had hatched, but they hadn't yet emerged. A storm and high tide threatened to drown the hatchlings who were trapped in the nest with a hard crust above it. Because the NPS knew from our system that there were hatchlings, they were able to rescue them just in time.
-
Unintended Consequences (mostly positive)
10/02/2014 at 14:23 • 0 commentsI just returned from nine days visiting our two test sites in North Carolina. While there, I got a chance to see baby sea turtles making their way to the ocean and to talk with wildlife managers and biologists. I learned quite a bit from the trip. We went out for several nights to visit a nest where I had predicted a boil using the data from our sensor. The turtles emerged two days later than expected, but that was not surprising considering that the temperature had been cooling down in the prior two weeks, and the previous nests had hatched during warmer periods. The boils often occur between sundown and about 10:00 PM, which is when we usually gave up and went home. This nest ended up boiling a little after midnight.
Nest sitters must wait for the boil in total darkness because lights can confuse any baby turtles that emerge. So there's nothing much to do except talk and enjoy watching and listening to the phosphorescent waves. This gave all of us many hours to talk about our progress so far and to discuss how the data correlates to what is happening underground. I spent much of the time talking with Britta Muiznieks, National Park Service (NPS) biologist and our host at the nest site. She Is the NPS liaison with our project.
The week before, I got a chance to meet staff from the Bald Head Island Conservancy at the southeast tip of North Carolina. While travelling from Bald Head Island to Cape Hatteras, we stopped to meet with Matthew Godfrey, who is the Sea Turtle Program Coordinator at the North Carolina Wildlife Resources Commission. I was very surprised to learn that there was little data about the timing of events in sea turtle nests before a boil. Part of the reason for this is that it is so difficult to study what is happening. Studying sea turtle nests risks invoking the Heisenberg Uncertainty Principle. If you look in the nest to observe what is going on, you might be having a major effect on what happens. So our apparatus is a welcome addition to tools that biologists can use to understand what is happening inside the nests.
All these biologists are also responsible for managing wildlife, and it was here that our discussions led to several ideas about how we can use our technology for the benefit of Sea Turtles.
At the Cape Hatteras National Seashore, the issue has been off-road vehicle management, but at Bald Head Island, like at many other beaches, there are no off-road vehicles on the beach. There the issues are twofold: monitoring the nests for events that could harm the turtles and managing volunteers.
Predators often attack the nests, and high tides and storms can cause overwashes that suffocate the nest. These harmful events are often discovered too long after the fact for wildlife managers to be able to intervene in any effective way. Fortunately, we are able to see these events in our data. Predation appears as a very sharp and intense spike of activity. Overwashes look like a sudden attenuation of the energy readings we get. It is likely that we can create an automated system to recognize these changes in the data and send out e-mail or text alerts to wildlife managers so that immediate action can be taken. For example, one of our nests was washed away by high tides a day or two before a boil was expected. We knew that the eggs had hatched from the activity we saw. What I learned was that turtles still have their yolk sacks attached after they hatch, and it takes a few days for them to fully absorb the remaining nutrients so they have enough energy to make the journey to the ocean and find their first meal. Wildlife managers, knowing that threatening high surf could drown the hatchlings, could have rescued them beforehand and released them later when they were ready. Similar intervention is possible if there is major predation.
Because boil times have been so difficult to predict, volunteer nest sitters could spend two weeks or more monitoring a nest waiting for it to boil. With our technology, we can probably reduce that time to one-to-three days. This means that a single volunteer would be able to monitor several nests during the same time they currently spend monitoring just one nest. So our technology is not only able to help biologists understand what is going on, but it also gives wildlife managers a tool that they can use to help increase the success rate of the nests.
The initial inspiration for our project came from a desire to create a win-win solution to the conflict between those who are responsible for managing wild life and those who want to maintain access to the beaches. We have made significant progress in creating a win-win solution to this problem by successfully predicting boils at almost all of the nests we have looked at, even without knowing exactly what the data means and with little or no previous data to back up our predictions. The chances of this being implemented on a large scale are looking very positive. But the most gratifying part of our journey was discovering so many ways that we might also be improving the survival rate of the baby sea turtles. Win-win-win.
-
User Interface
09/16/2014 at 03:15 • 0 commentsWe want to make Turtle Sense as simple to use as possible. So, at the most basic level, setting it up, you just plug the connector coming from the turtle egg Smart Sensor into the connector attached to the communications tower. The device, which has been asleep, wakes up and starts collecting data and sending out reports. When you unplug the devices, they go back to sleep until the next time.
But that is just the surface of how we plan to have users interact with the device. We made these units for use by the National Park Service, but the NPS is just the representative for a much bigger group of users: wildlife managers, researchers, eco-tourists, fisherman, and the general public.
Wildlife managers need to know where the nests are, when the eggs were laid, when they might hatch, etc. Turtle researchers will want to access the data from the devices and devise theories and models that account for the observations. Eco-tourists might want to know which nest is the most likely to boil and when. Fisherman might want to know if and when a section of the beach will be closed to vehicles because of an impending boil. For all these users, we have started work on a website that will give each group access to the information they want or need here.
Right now, the web site only provides a small amount of information. A map showing the active nests is provided, and the nest sites shown on the map are real, but the graphs that pop up are just designed to show that we can provide more information about each nest. That information that will be ultimately provided will be different for the three groups of users on whom we are focusing: wildlife managers, researchers, and the general public. For example, a graph won't mean anything to most people, but it might be very important to a wildlife manager.
Each group will also have pages that are designed to meet a specific need.
- Wildlife managers will have a place to enter information about each nest and record events that are significant, like surf over-wash, predation observations, etc.
- Researchers will have a portal to our mySQL database to make queries of the raw data. We will make the data open source as well.
- The general public will have a page with the prediction for the next boiling nest and information about how to go about watching for a boil. A map might show which areas of the beach are inaccessible due to impending boils and when those beach areas might open back up.
Another section of the website will allow all three groups to sign up for e-mail alerts about when a nest may be hatching. We're also considering offering text alerts, but because of the expense involved, this might not be possible without a fee of some kind.
-
Future options
09/16/2014 at 01:22 • 0 commentsThe 2014 Turtle season will be over in a couple of months. We will have collected data from more than a dozen nests, and have been fairly successful in accomplishing what we set out to do this season. But we still have a long way to go. We need to automate the process of predicting nests and create a fully functional web-site for managing the process that also lets the public and researchers see the results. At the same time we have to perfect our design so that it is as close to 100% reliable as we can make it. Here's our thinking about the next phase of the project.
As mentioned in a previous log, Phase Three will try and simplify the connection between the sensor and the communications tower. We're starting experiments to see if we can use coax cable to send power to the sensor along with carrying two-way RF communications. We're also looking into the possibility of replacing the battery pack with a small solar cell and supercapacitors. A small efficient cell glued to the PVC with an adhesive like E6000 could provide more than enough energy, even on an overcast day to run everything. The supercapacitors would only have to be large enough to power the unit overnight. Our rough calculations make us think that this would not be any more difficult to make, or cost more than our current system. But there would be big advantages to the people using them and maintaining them. The units would never have to be opened up. The batteries in the current design have to be recharged about once a year. In most devices changing a battery is no big deal, but we had to go to some lengths to protect the batteries from the elements and rough handling. The batteries are secured with nylon cable ties and wooden blocks and then wrapped with Parafilm and bubble-wrap. The batteries are stored in a separate compartment made from PVC pipe and connectors. Instead of permanently connecting the PVC components, the final component is attached with a lubricant and a set-screw. This makes a weather-proof seal, that is difficult, but not impossible to open. A solar powered device would not need the extra chamber or the yearly servicing.
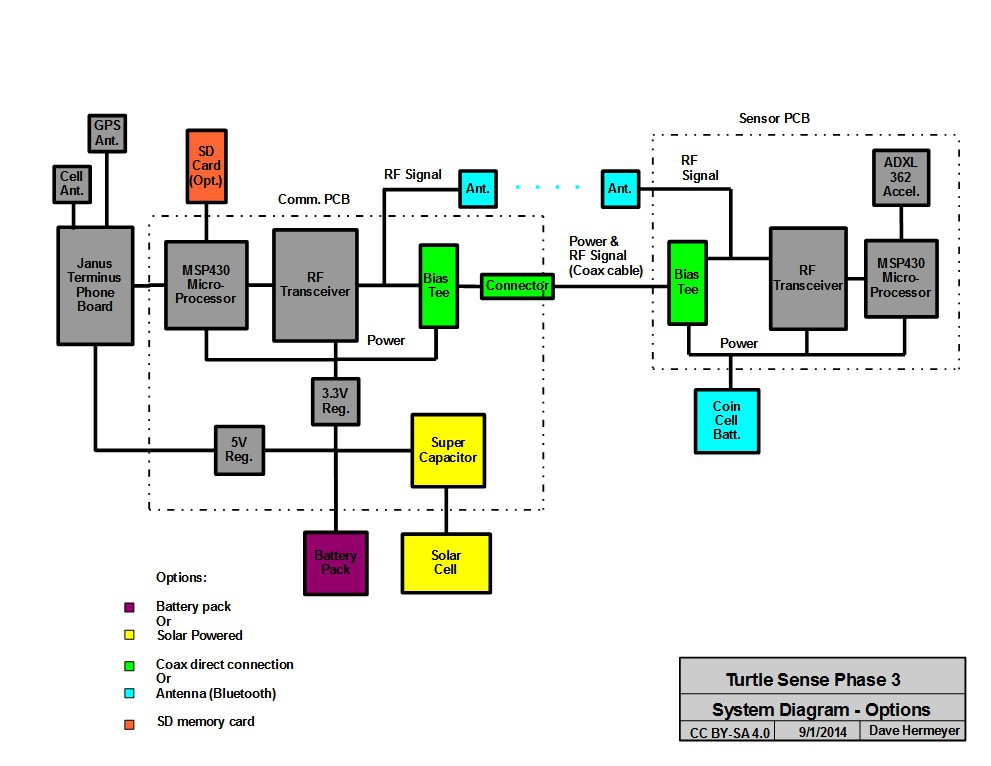
![]()
Each color represents a different option for future enhancement to the project. The grey blocks are almost the same as the Phase Two design, with the exception of an RF ttransceiver replacing an RS485 transceiver. This could be any low-powered RF device, but we are leaning towards Bluetooth LE because it would allow us to create a platform for interactions with passersby who want to know more about sea turtles and our technology.
Since we are considering using RF transmissions over coax, it would be possible to modify the design for wireless connections between the Smart Sensor and the communications unit. This is represented in the diagram by the cyan blocks. The most difficult part of this would be creating a power supply for the egg shaped smart sensors. A rechargeable battery could be embedded in the design with some way of charging it, or a coin cell battery could be used. Both of these options would not be easy to implement. Since the wireless solution will still need an antenna, it might be possible to have a short tether to a power source and antenna. This might be useful for monitoring the nests of some above ground birds and reptiles. It might be possible to put a solar cell in the egg sensors and cast them with clear acrylic instead of polyurethane. The devices need so little power to function, they could probably work with just a minimal exposure to light. This configuration might work well for monitoring bird nests.
Researchers have already asked us about the possibility of having our devices function as data recorders without the option of having the data phoned in. This option, to have data stored on an SD card (shown in orange), would not need the Janus phone boards and would require much, much less power as a result. We already added a provision in our design to be able to hook up auxiliary boards with UEXT connections made by Olimex, but we have not done any work with any of those peripheral devices yet. Olimex makes an SD card auxiliary board, and we'll make sure it will work with our next design. There are also display screens that could be plugged in.
The main reason we have not used any peripherals with the communications board we've already made is because we ran out of code space on the 16K MSP430 processor. Our Phase Three boards will have either a 64K or 128K version, both of which were recently released. The additional code and data space allows us to offer more options, peripherals and error handling along with enhanced data collection, processing and reporting possibilities.
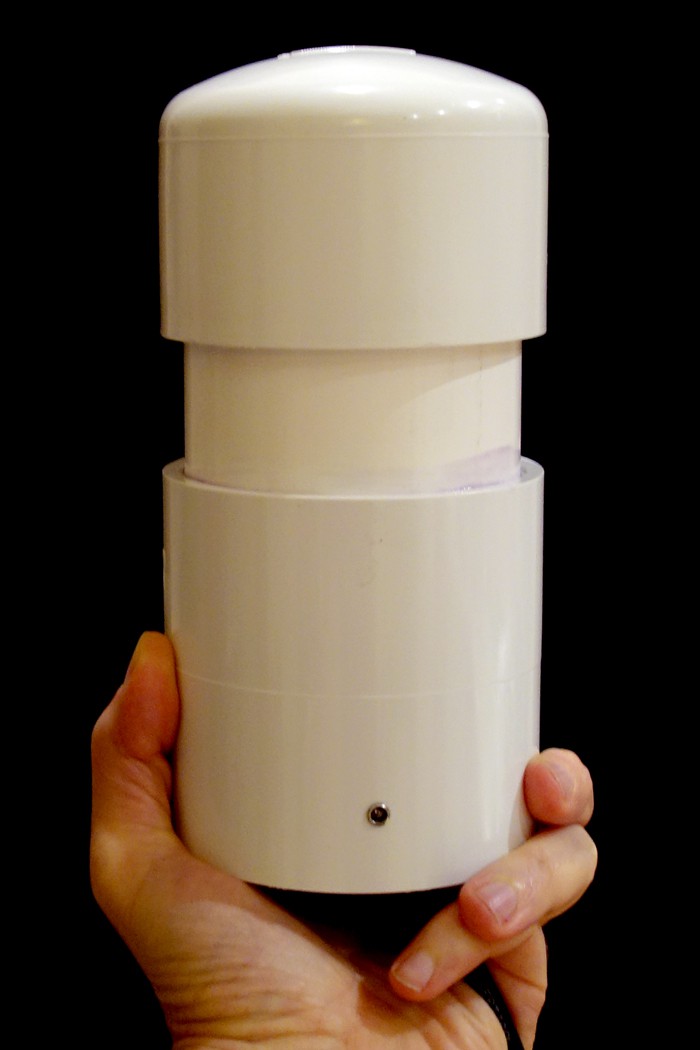
A mass produced version of Turtle Sense would look almost the same as our current version. If we can make it solar powered, the lower chamber that holds the battery would go away and it would look like this:
![]()
We'll look into getting a custom cap made to make the top clear or translucent so that a small solar cell could be sealed inside, if not we'd glue a small cell to the top pointing up.
-
Hatching or Ghost Crabs?
09/12/2014 at 08:45 • 0 commentsWe've completed the monitoring of five nests so far. One sensor failed in a nest (due to a bad connection). Eight nests are being monitored currently, and another four are awaiting a spare Communications Unit to become available. So, we should have data from about 17 nests to evaluate. Using our theory about hatching, which we are now calling the "popcorn" theory, we were able to predict several boils. The popcorn theory is that the turtle eggs are like popping corn in boiling oil. When the kernels heat up, they start to jiggle a little, and then they all start to pop at once. When you hear the popping quiet down, you know it is time to pour everything out of the pot. So, we theorize that the turtles are all programmed to listen for things to quiet down after hatching, and that way they know that it is time to leave the nest.
Popping (hatching) shows up in our data a few days (3-5) before the turtles pour (boil) out of the nest. The sensors are sending 240 records in each report, and each report is phoned in every 4 hours. So each record is a profile of what happened each minute of the day. We can see how many readings there were in about 25 ranges of acceleration from .001 G to about 4 G. We've arranged these ranges logarithmically because we did not know what values we'd be getting. We thought there would be a huge dynamic range between background noise and the motion of hatching turtles hitting the sensors. It turns out the dynamic range is not that large--about 4:1. In future versions, we can design our data collection to get more resolution in the ranges that we are recording.
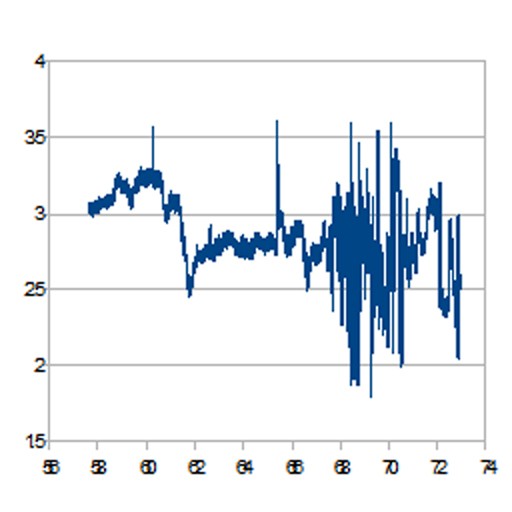
To graph the data, we integrate all the readings during each minute's report to get a single numerical value. This value corresponds roughly to the energy from the motions recorded. We can graph the data versus time to see what is happening. It looks like this:
![]()
Looking at the graph, you can see that things are really popping starting around day 68. Then everything gets really quiet for a few hours on day 72. That was just before the boil. So, when we see the graph look like an earthquake on a seismograph, we figure things are going to boil in about 4 days. This is a pretty good method of making a prediction.
Except for one thing. Do you see the spike around day 60 and again on day 65? We think these spikes are from ghost crabs. Ghost crabs are a main predator of sea turtle eggs. They make quite a commotion in the nest when they are feeding on sea turtle eggs. Some nests don't have them, so there are no spikes until the eggs are hatching. But some nests have lots of them. If the crabs find the nest early on, they return over and over. They probably bring their family and friends to feast on eggs.
So now we have to collect more data and learn how to distinguish between the hatching of sea turtles and an orgy of crabs feasting on sea turtles. One member of our team, Tom Zimmerman, is working on using machine learning techniques to do just that.
-
Real World Problems
08/30/2014 at 23:52 • 0 commentsWe now have about two dozen sensors in the field and about a dozen communicators. Early on, we made a test unit. That unit has been operating for weeks sitting on a counter here in San Francisco, and it has never skipped a beat, missed a report, or had a problem of any kind since we got everything working. The units in the field have not all been so reliable. Some of them have worked flawlessly for months, and some of them never powered up. Over all, they are working about 90 percent of the time. Testing electronics in the wet, salty sea environment tests your design in extreme ways.
We are building and programming more than 2500 miles from where the units are being deployed. We need them to run, unattended, for more than two months, enduring moisture, salt, wind, blowing sand, and who knows what else. When they stop working, we can't easily determine what went wrong, and that is a challenge. With two custom devices interconnected and running a third device talking to a server, there are lots of places where things can go wrong. This is where "hacking" turns into full-scale engineering.
It is one thing to get the basic functions of a device up and running. That part is fun--it requires innovation and creative design. But getting everything to work flawlessly in the field requires diligence, attention to detail, and lots of trouble shooting. That is much less sexy. For this project to be successful, we have to make units that are totally reliable. Ninety percent is not sufficient.
We've learned quite a bit about the ways things can go wrong. Boards can come loose, connections can break, moisture and salt can get into places they are not supposed to get into. Cell phone reception can be interrupted by lightning, and that can cause embedded code to hang.
We anticipated several processes that could fail and programmed the code to handle the problems as they happened. For everything else, there is a watchdog timer that resets the device. But it is difficult to test how things will behave when they fail, if you can't observe them failing. We don't get thunderstorms in San Francisco, and being in the middle of the city, the cell phone reception is excellent. This summer is teaching us about all the problems we will need to deal with.
There are two main things we have learned thus far. First, the watchdog timer works for most unanticipated problems, and the system recovers most of the time. But we need to handle recovering from resets better. Sometimes the system recovers and no data is lost, but sometimes we lose a few hours' or a day's worth of data. We knew this might happen, and we knew how to fix it, but unfortunately, we ran out of code space in the 16K devices we are using (TI's MSP430s) to implement the fixes. Just at the point when we ran out of code space, TI introduced new versions with up to 128K of memory. These new processors should be more than adequate for what we need. But making these fixes is out of the question for this year. The devices are in the field, and the turtle season is half over. So for now, we are accumulating more knowledge about the ways our devices can fail. We will incorporate recovering from those failures into the next version of the software.
Second, the connection between the Smart Sensor and the Communications Unit is the weak link in our design. We consulted with a few engineers about what connector to use, and we ended up choosing a 9 pin Molex connector with gold contacts. The first thing we discovered was that the cable connection to the connector was prone to failure because the outer cover of the cable was removed near the connectors. In the field, the cable bent easily during connecting and disconnecting. The thin wires in the Cat5e cable could easily break after a few uses. So we cast the ends of the connectors and the cables in quick-setting polyurethane to make it strong. It did make it strong, but the polyurethane wicked its way up into the connector and made some of the crimp connections unreliable. So, we started soldering the crimp connections after they were crimped. This seems to work much better. But the solution became very labor intensive to make and difficult to repair. Ultimately, we need a better, simpler, and cheaper way to connect these units. We are considering using a single coax cable for the next version. We would send RF signals in both directions over the coax line, and we could also use the coax line to send power to the sensor. Coax has a long history of being used outdoors, and there are a selection of waterproof connectors and tools to do quick repairs. We are also considering ways to make a wireless connection between the devices, but that might create more problems than it solves. The "power over coax" solution could be engineered so that device can easily be adapted for wireless use as well. This would be very good for applications that do not involve underground nests.
-
Results from the First Nest
08/11/2014 at 10:00 • 0 commentsWe had our first boil yesterday, August 10th, and I'm happy to report that the day before the boil, I sent an e-mail to the National Park Service saying that I thought something might be happening in the nest. Given this, it might actually be possible to predict when a nest will hatch!
After the boil, I spent a few hours looking at all the data to see what I could find, and the results were not quite what I had expected. In fact, I have a new hypothesis about how to predict when a boil is about to occur.
Previously, I had heard that the activity from the turtles moving around in their eggs and then from hatching stimulated the other turtles to hatch, and that somehow they coordinated the boil from all this motion. From looking at the data, I think what might be happening is that the motion ramps up gradually until they start hatching. Then, as they hatch, the motion becomes erratic. Finally, after they all have hatched and are waiting for the boil, everything quiets down. It is this quieting down that might be the clue to the turtles that all their siblings have hatched and it is time for a boil. It makes sense, since as each turtle hatches, there is no need for it to move any more. All it needs to do is wait for everyone else to finish their wiggling. If there is no wiggling, all the eggs have hatched, and it is time to go.
From looking at the orientation of the sensor, it appears to have rotated a little between 2 PM and 7 PM on August 7th, which appears to be the period when there were the largest jolts. This makes sense if this movement was from the collapse of the nest as the turtles hatched. The sensor would get lower, and its orientation would rotate about as much as can be seen in the data.It will be interesting to see what the data looks like from some more hatching nests and whether they all look similar. Who knows? Another nest might be boiling as I write this . . .
The data was also quite surprising in another respect. The boil itself is hardly noticeable. In fact, I'm not exactly sure what time it occurred from looking at the data. There were no dramatically large motions. I thought for sure that we would get very high readings when the baby turtles moved past the sensor egg. It looks like the sand might have absorbed much of the energy. It might also be that when the nest collapsed, the sensor did not sink with it as much, and very few of the turtles had any contact with the sensor. It will be useful to know the orientation of the sensor relative to the egg shells when nests are excavated.
-
Hurricane? Yes. Postal Service? No.
08/06/2014 at 07:04 • 0 commentsSo, we got through Hurricane Arthur without a problem, and we decided to send some more Communications Units into the field. We sent them out via the USPS Priority Mail. The units are housed in schedule 40 PVC pipe, which is really, really strong, so we thought that there wouldn't be a problem in the mail. We were wrong. It turns out that we planned for everything except for the abuse that the units would receive in transit.
Most everything in the device is soldered together, but there are a few connections that are not. The cell phone board is plugged into headers. There are several boards available from the manufacturer that work with different telecoms. The boards could be soldered in, but we wanted to be able to swap in a different board for different carriers if need be. With 49 pins holding it in, it takes quite a bit of effort and wiggling to get it out and seemed very, very secure. But not secure enough for the USPS! Similarly, the eight AA batteries are secured in a battery pack, and the pack can be unplugged with a standard 9 volt battery clip. These take quite a bit of force to put on and take off, but the trip cross country in the mail was enough to shake it loose. None of the units in our last shipment was working by the time they made it from California to North Carolina.
The repair for these problems is very simple, and in retrospect we might have anticipated this issue. To secure the board and the battery clip, we tightened cable ties around them. There is no way to get them loose without cutting the ties off.
So the moral of the story is, when you are designing a product, don't worry about making it hurricane proof. Make sure it can make it through the post office.
-
Summer 2014 Field Notes
08/06/2014 at 06:48 • 0 commentsWe currently have about a dozen sensors installed in nests, but only three of them are connected to communications devices. For the first month after a clutch of eggs is laid, there is little or no activity in the nest. Since this is the first testing of our devices in the field, we want to fix any bugs in the first devices before sending out lots more.
The first communicators were installed around the end of June, just in time to be tested by some very extreme conditions during Hurricane Arthur. We didn't know what to expect. Would the cement anchors on the PVC pipes that house the communicators be secure enough? Would water find a way into our hermetically sealed enclosures? Would the nests get washed away? We changed the parameters on the units so that they phoned in every two hours instead of once a day. We figured if the units failed, we'd get information right up until two hours before they failed. As we watched the hurricane forecasts, the storm track was pointing directly to where our first devices were installed.
The units made it through the Category 2 hurricane without any problems. So, now we know that they can handle severe weather. We also learned something very important from the storm. We had been worrying that environmental noises and disturbances might make it hard to tell the difference between those disturbances and hatching eggs. What we found from the data during the hurricane is that it is very quiet a foot or two feet below the beach. The noise level from crashing waves, blowing sand, and torrential rain was barely noticeable in our data. On our logarithmic scale, that means that the noise level during the storm is no more than about 40 percent above normal. Since our scale has about a 1:1,000,000 range, 40 percent is not significant. The noise level we are encountering in the nests is comparable to the noise level on the table in my empty kitchen when I was testing the sensors overnight.
So what does this mean about the motion we will record as the embryos start moving and later when the eggs start hatching? This is the big unknown. We'll find out soon.
-
Phase Two implementation (2014 Sea Turtle Season)
08/05/2014 at 20:28 • 0 commentsTest units started being installed in sea turtle nests in June of 2014. The plan is to monitor about 20 nests at the Cape Hatteras National Seashore and a few more at the Bald Head Island Conservancy, both in North Carolina.
The units constantly monitor and analyze motion to create a profile of its magnitude over time. The motion detector measures the change in acceleration (or "jolt") multiple times per second. The magnitude of the jolt is placed on a logarithmic scale divided into 25 different ranges. The ratio between the lower and higher limit of each range is the square root of 2. A counter for each of the different ranges is incremented whenever a jolt reading is in that range. You can think of each counter as a bin. If a magnitude is in range, it is thrown into the bin for that range. After 6 minutes the results are stored in a record along with a temperature and orientation reading, and a new set of bin counters is started. By looking at how many readings were in each bin, we can get an idea of what jolts occurred while the bins for that record were being filled. This allows us to compress several thousand readings into approximately 32 bytes of information. We lose precision (including the exact sequence) with all the readings, but we suspect that those details are not important. The 240 records created each day give us a very good idea of what is happening in the nest.
Research indicates that before emerging from the nest in a "boil," turtle hatchlings congregate underground near the top of the nest. It is thought that this motion stimulates the hatching of the turtles that haven't yet emerged. Our sensors, situated at the top of the nest, should record some large disturbances when the first turtles emerge. It is our hope that our readings will indicate these early hatchings so that we can predict that a boil is imminent.
The nests with first units installed should be hatching around mid-to-late August. We will be generating algorithms to predict hatching from our data, and we plan to refine those algorithms so that we can come up with a reliable process for predicting hatching a few days in advance.
Turtle Sense
Cell phones for Sea Turtles and beyond -- creating an extremely low powered remote data recorder and sensor for monitoring wildlife, etc...