Instructable, source code, eagle files can be found here: http://www.instructables.com/id/Hackgyver-weather-station/
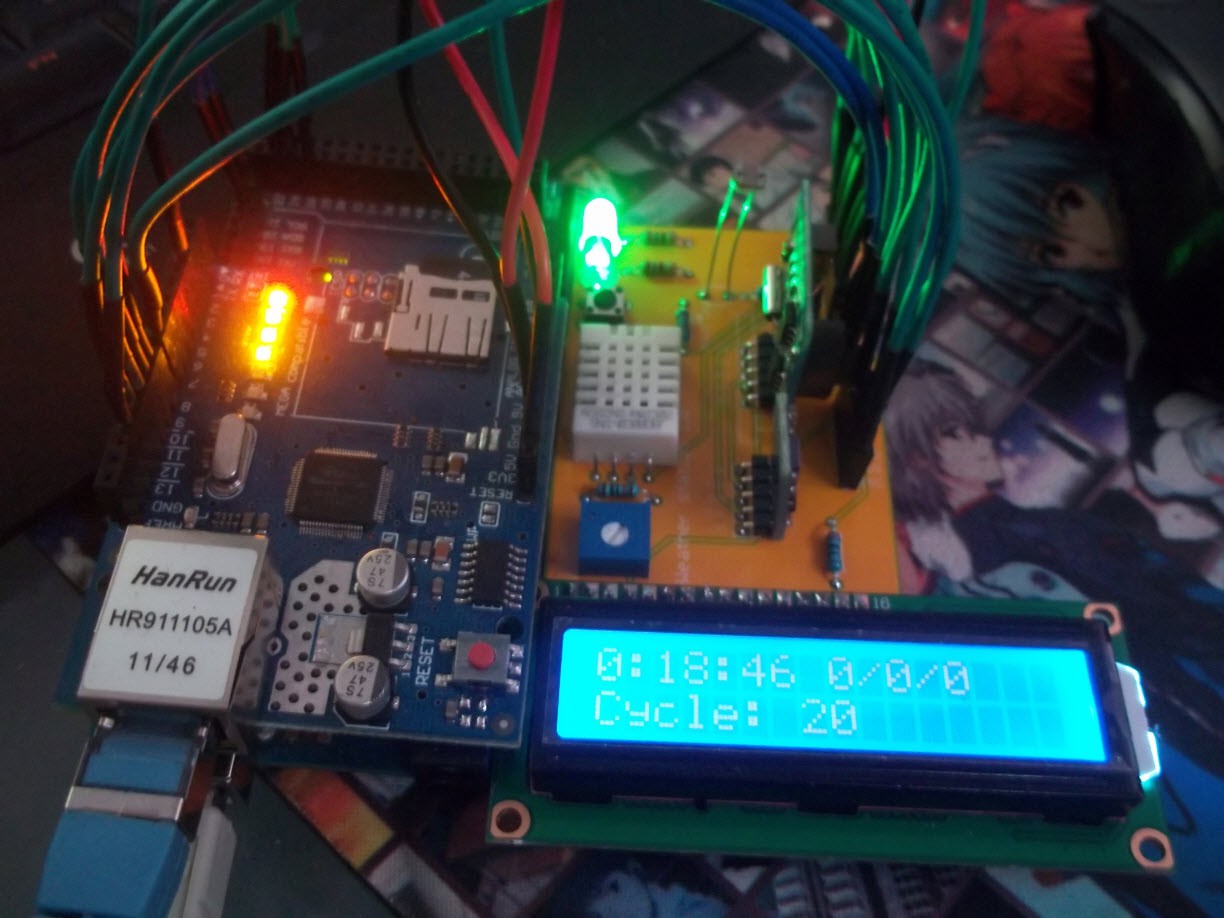
An LCD screen is used to display the circuit uptime and the number of cycles performed.
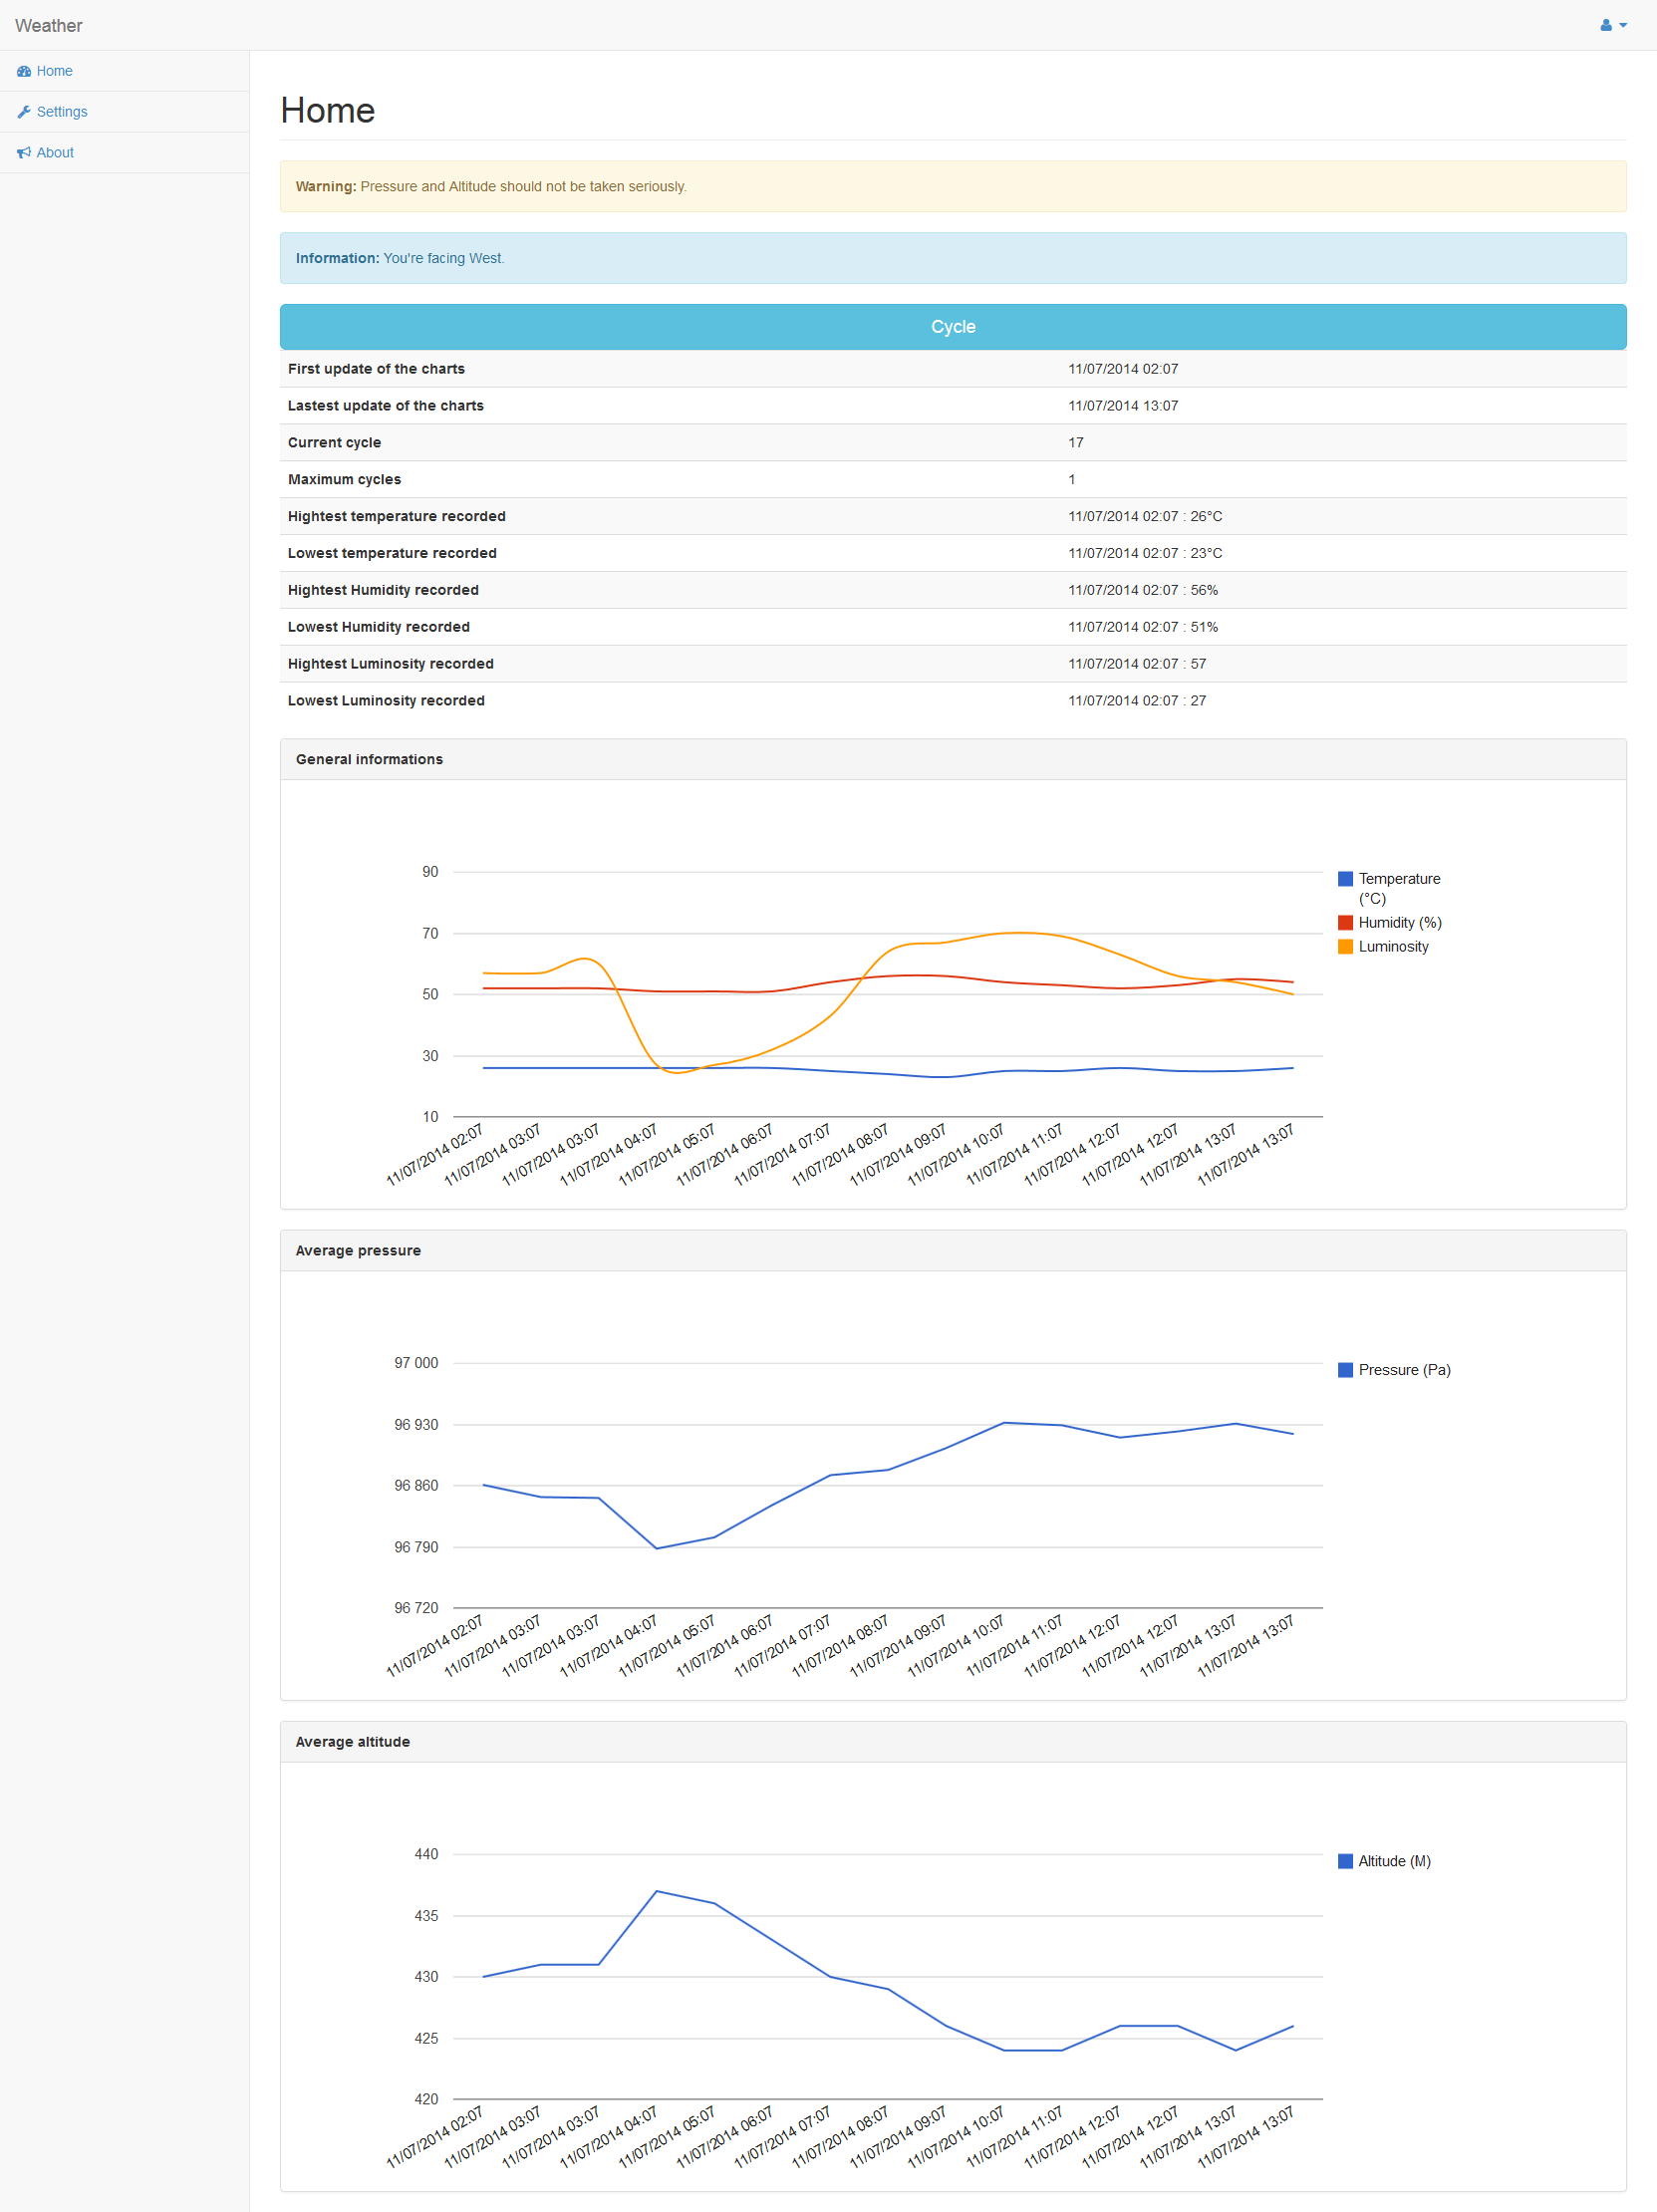
The circuit collect datas each hour.
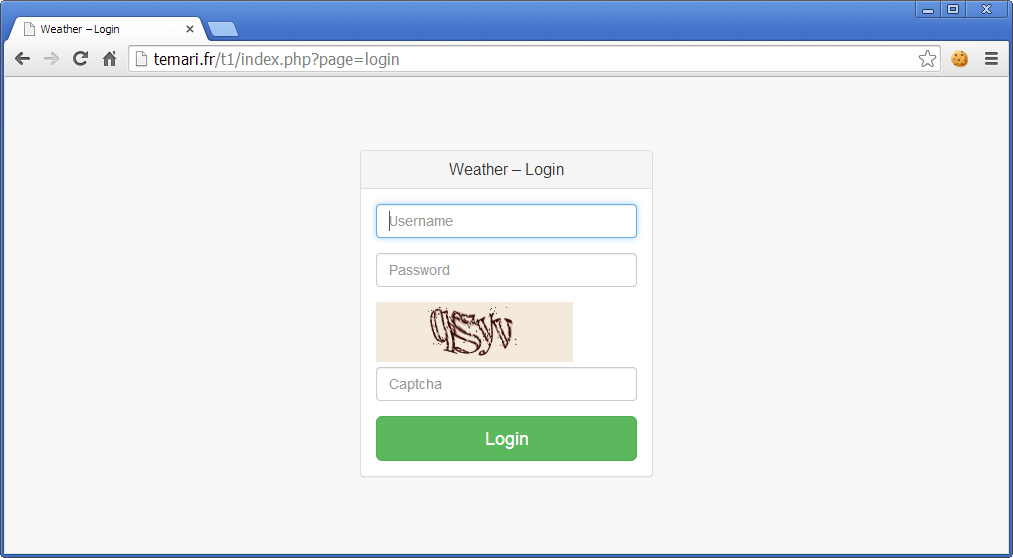
Datas are sent via HTTP request through an arduino ethernet shield.
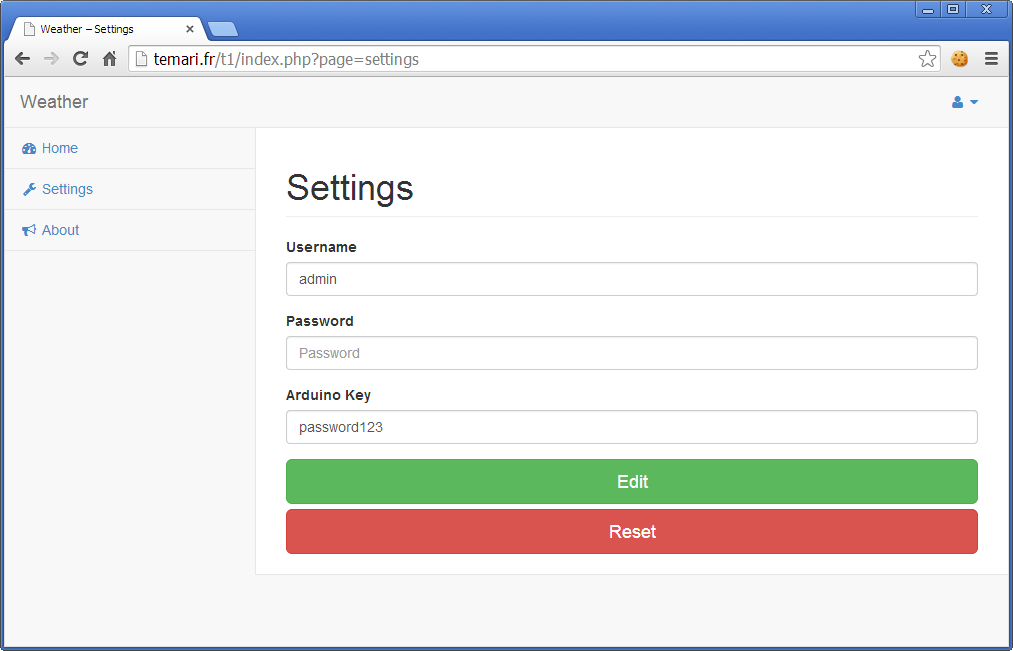
You can manually ask the circuit to collect datas through a button on the PCB or to press a button 'digitally' via the web interface.
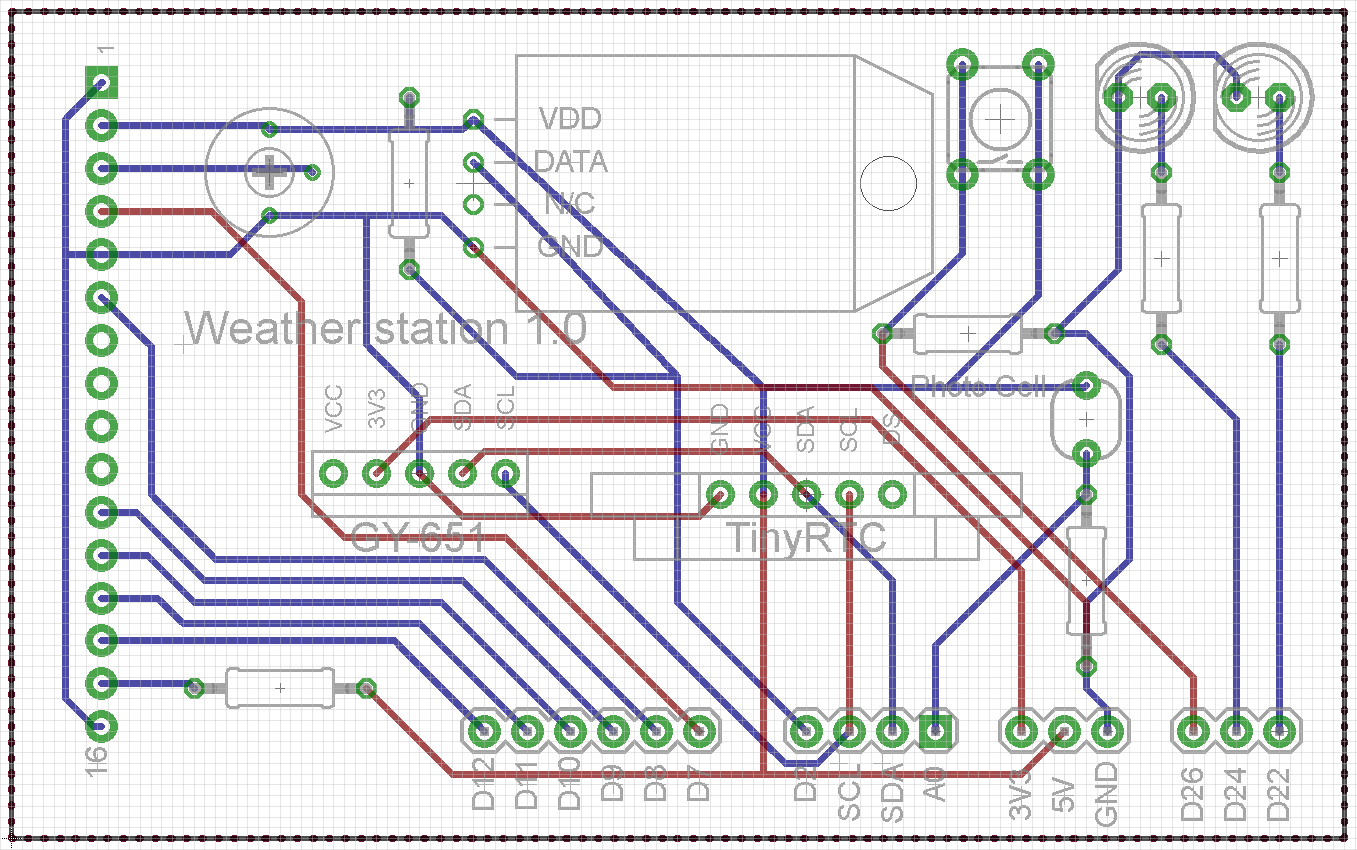
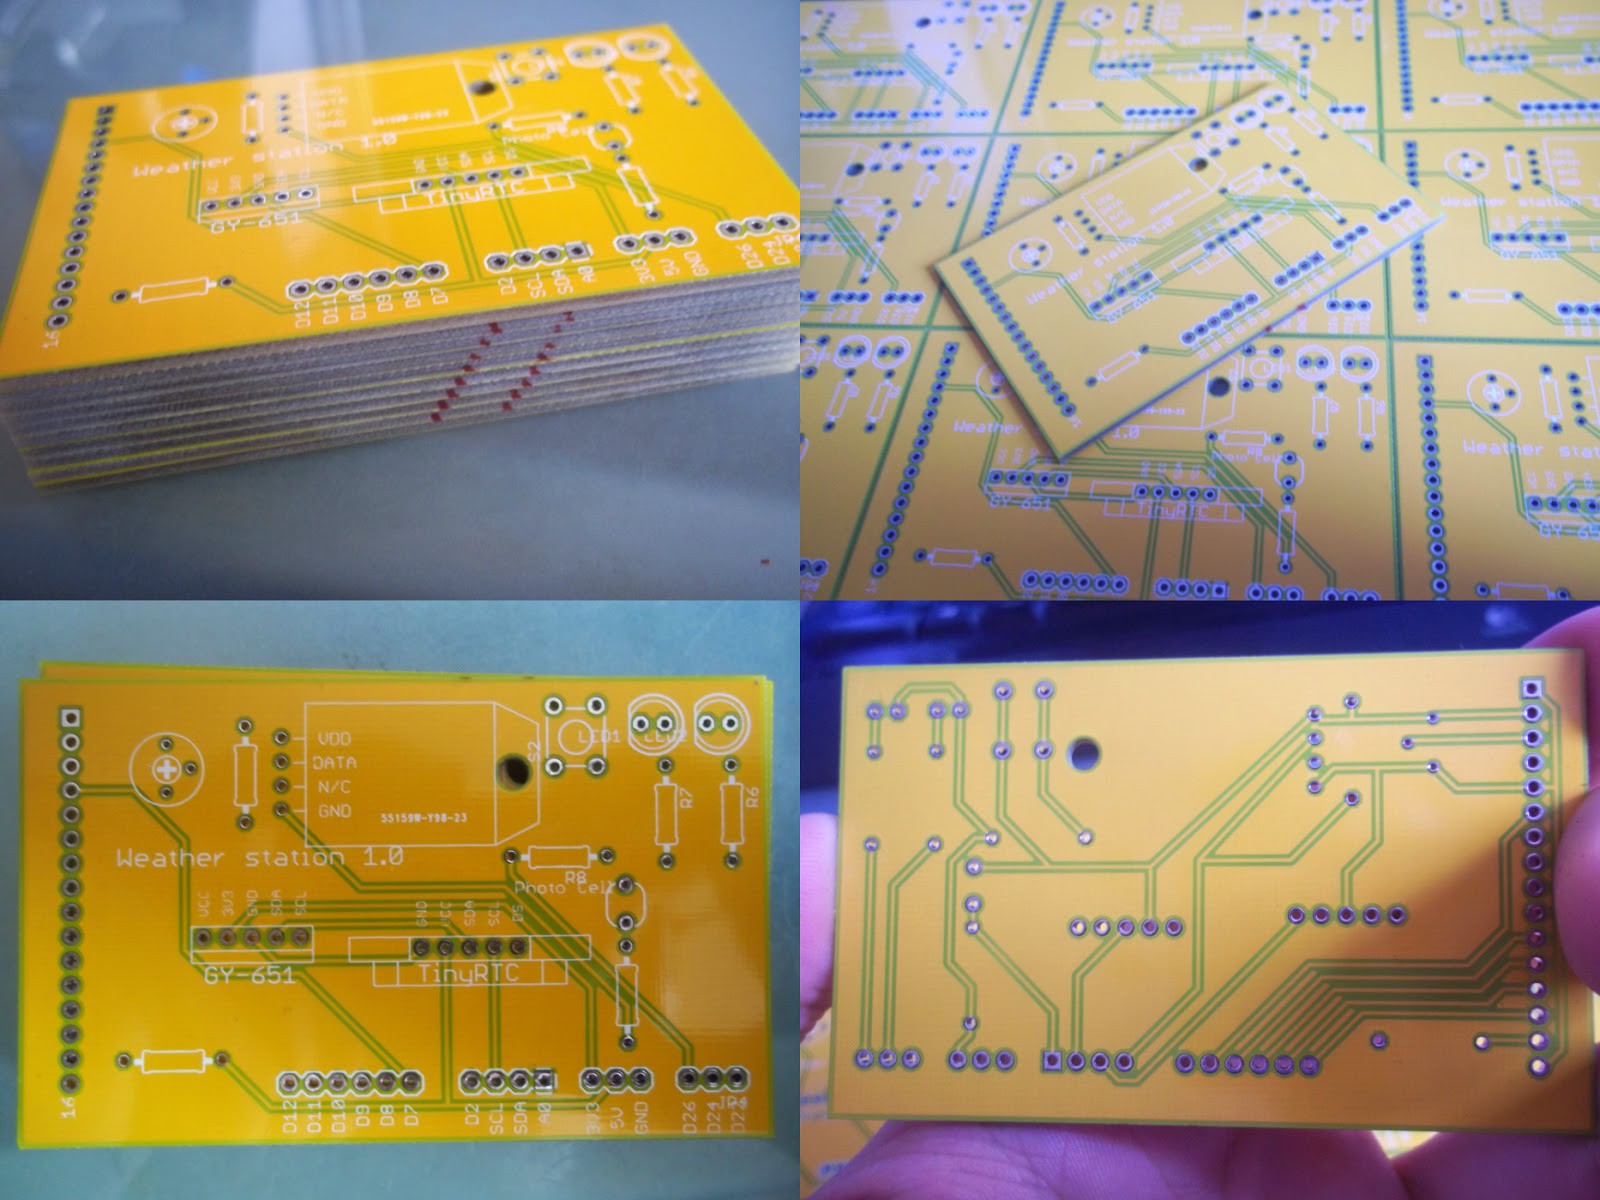
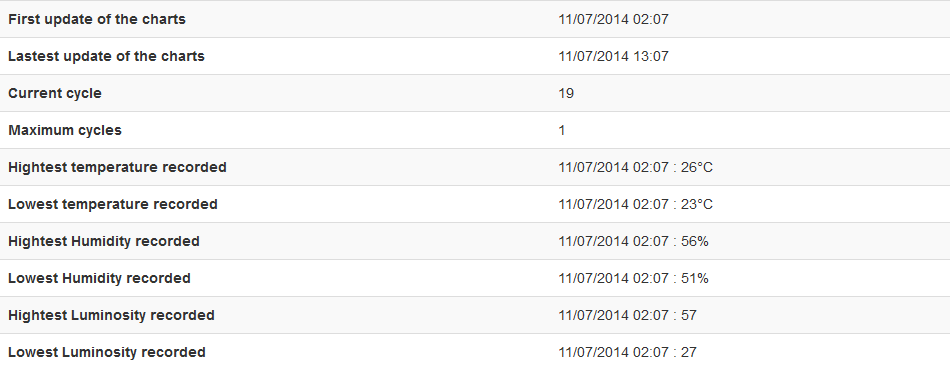
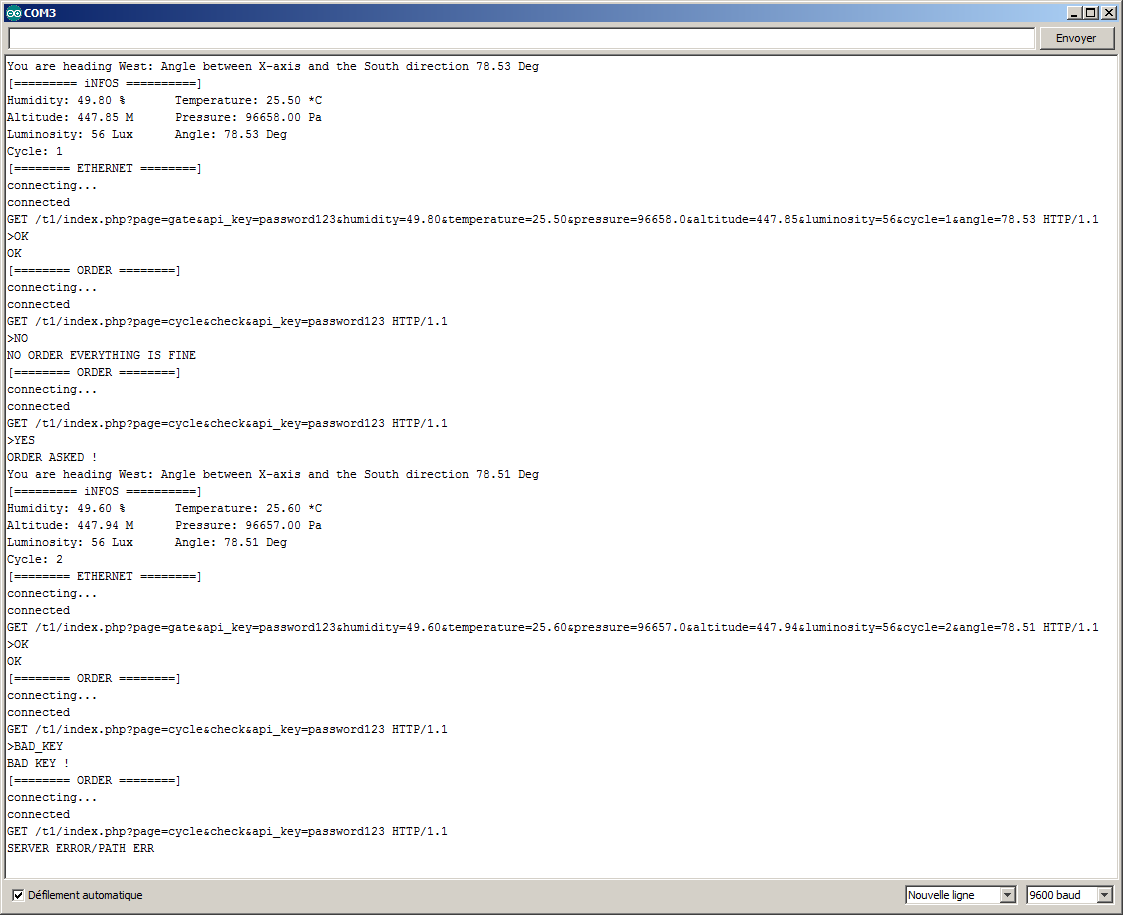
 The circuit will make a connection each 5 minutes to see if he have received an order to collect the datas, if no order is requested the circuit will continue to IDLE till he reach 1 hour and collect automatically the new datas.
A trimmer is used to control the LCD brightness.
The circuit operates with 5V.
--
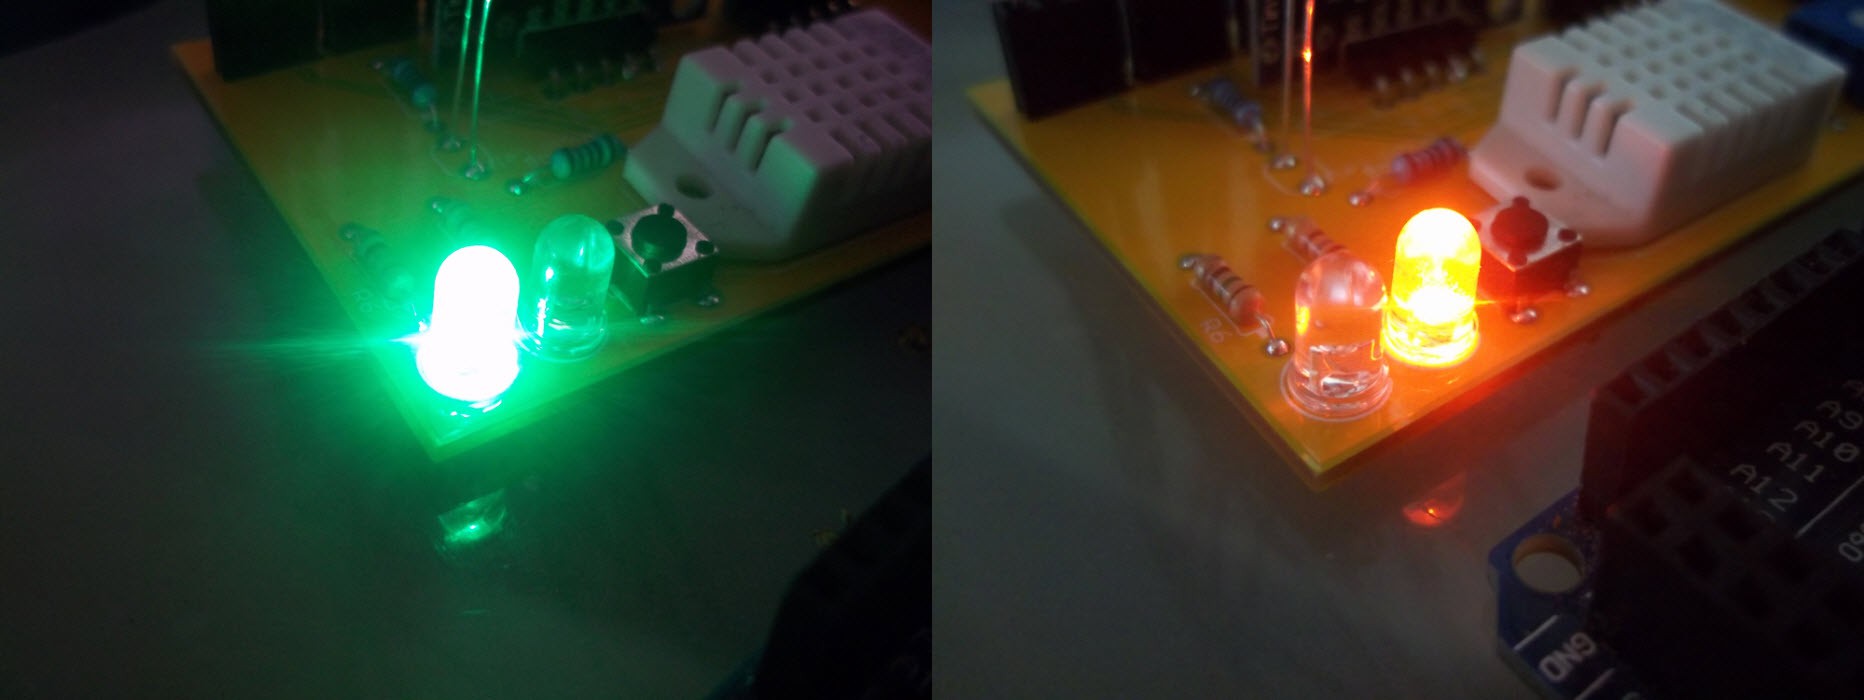
There is two LED who will indicate your circuit status:
Green led: everything is fine.
Red led: Something is wrong (can be a wirring problem, bad configuration of the board, or an internet problem)
 Xylitol
 A-A-W
A-A-W
 Silícios Lab