David H Haffner Sr
-
Experimenting With POF (plastic optical fiber) Part 2
02/27/2018 at 15:45 • 0 comments*note* I have to make a correction on my last log, I stated that our Sun is a class G5v star type, it is NOT, it is a class G2v type star, sorry if this confused anyone I hate to make mistakes but I correct them when I find them or when someone points them out :)
Ok, I am still learning how to use this wonderful Nikon camera and discovered I can control exposure time by adjusting the F-stop (the size of the aperture,) the larger the aperture the longer the exposure time, the smaller, the shorter exposure time is. So I put the camera in A-mode (aperture-priority-auto) which means I can choose the aperture size while the camera controls the shutter speed.
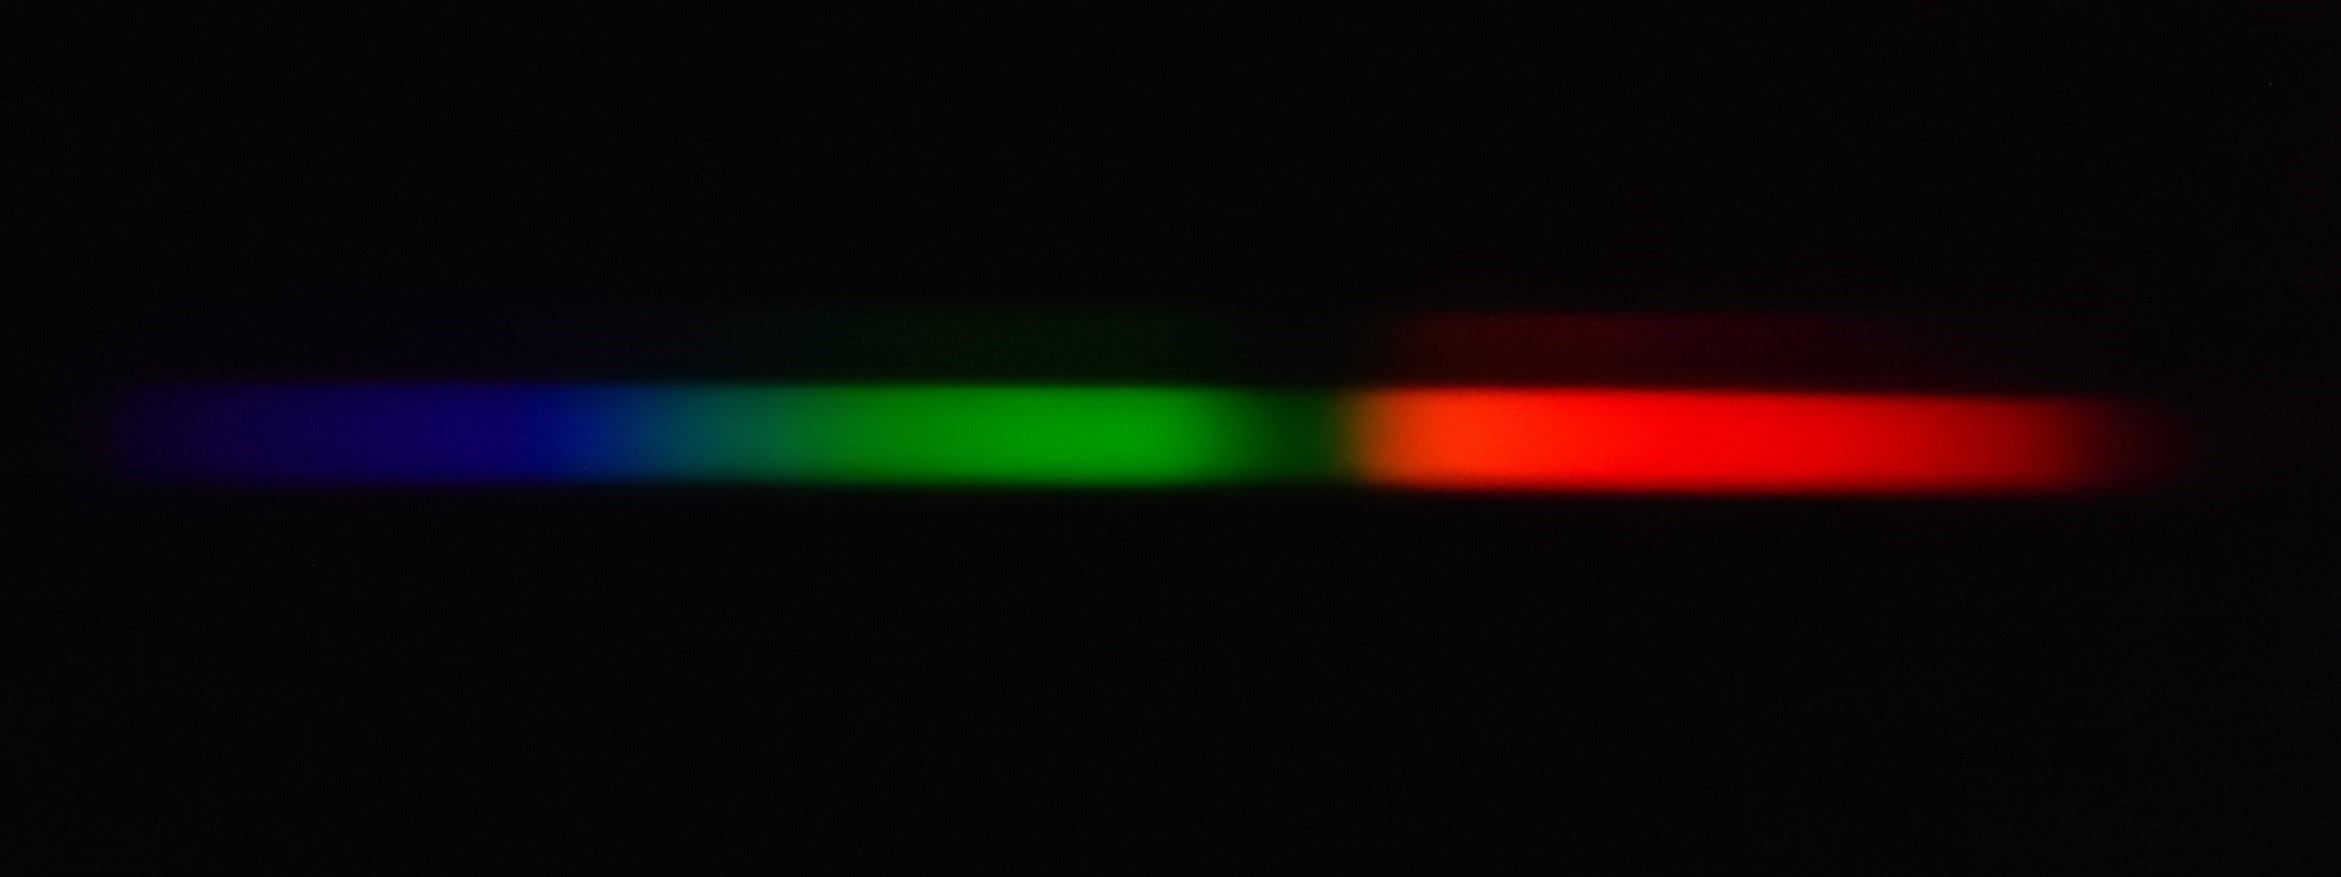
I'm glad I discovered this because I was wondering why there seemed to be "dead" spots in the spectrum(section with no light,) well it turned out there was nothing wrong with the diffraction grating like I had thought before, or the fiber, it was aperture size!
Once I adjusted it right, I got the perfect amount of exposure through and all those "dead" spots disappeared.
![]()
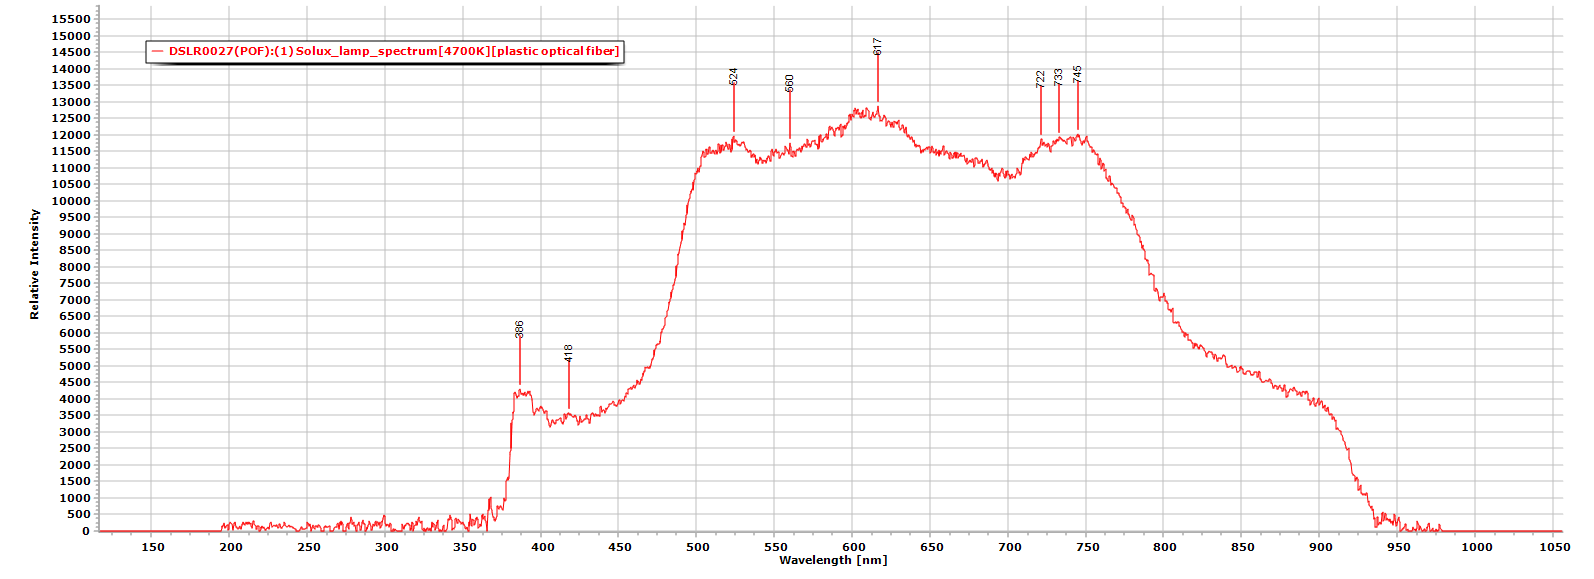
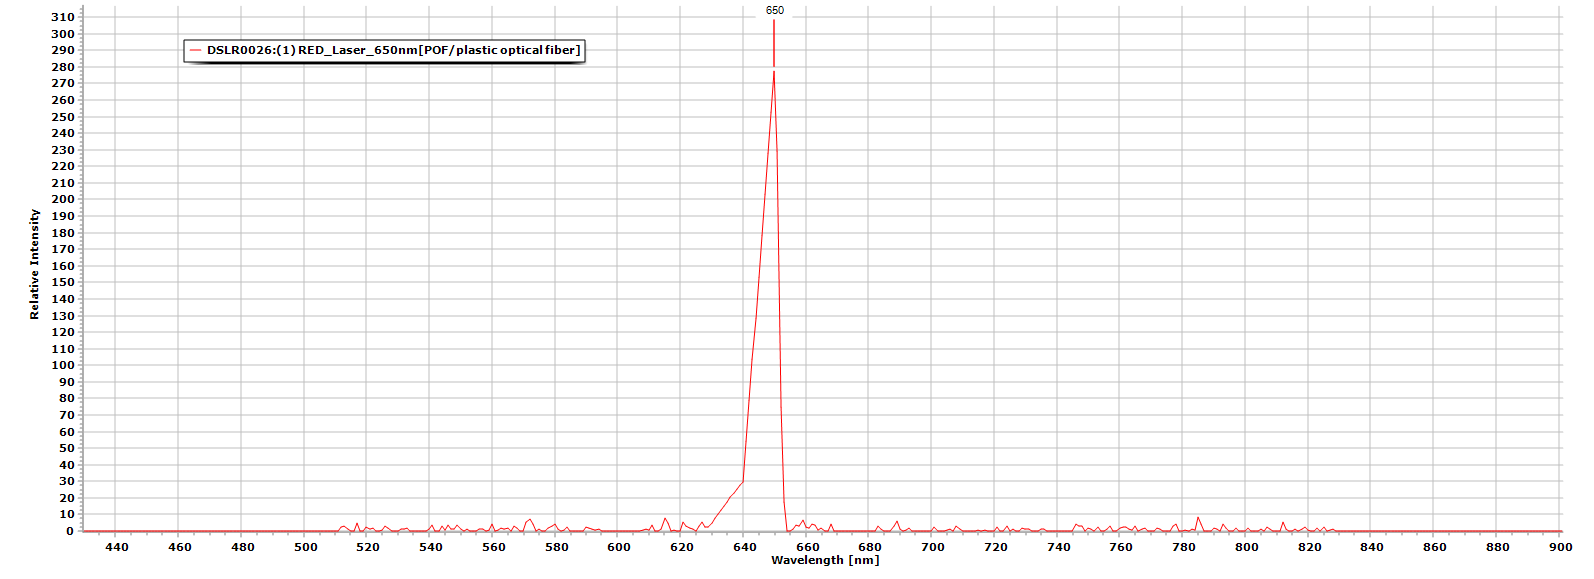
Notice how the wavelength range starts at around 368nm and starts dropping off at about 900nm, that's because of the plastic optical fiber, can't change that aspect, especially with a braodband light source, too many wavelengths, although at certain coherent wavelengths like 625-650nm (red) for some reason that wavelength comes through with little degradation.
![]()
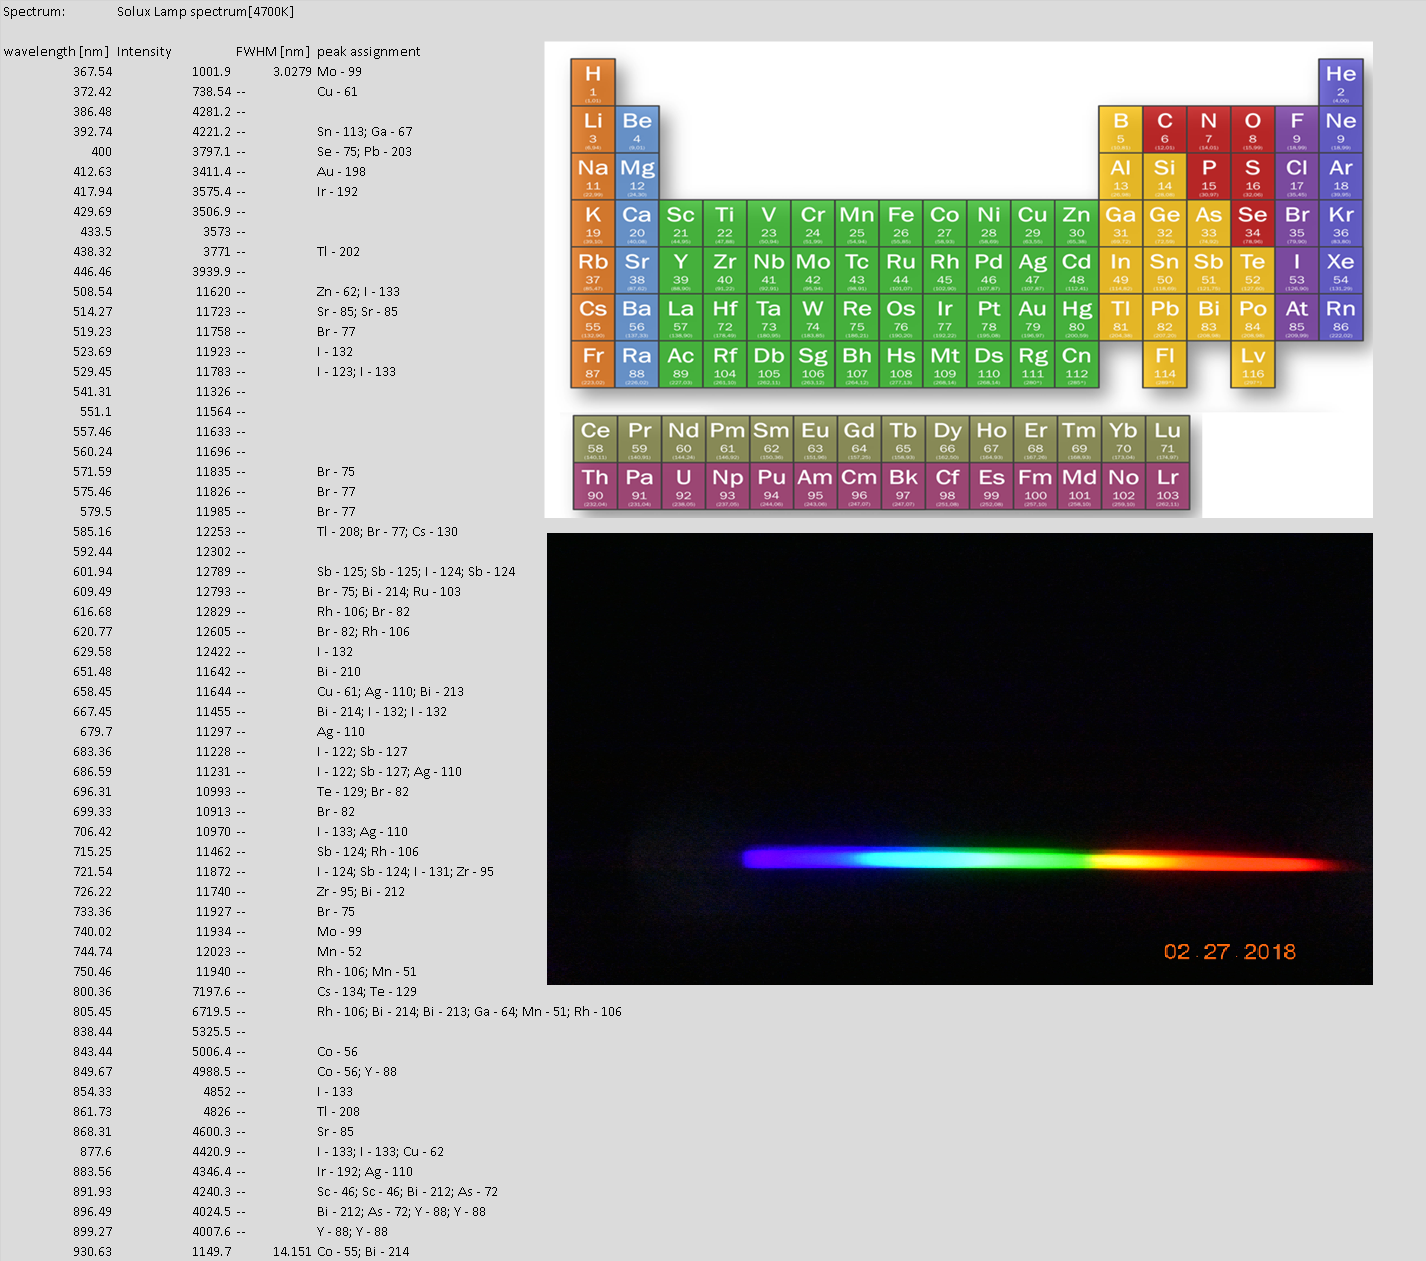
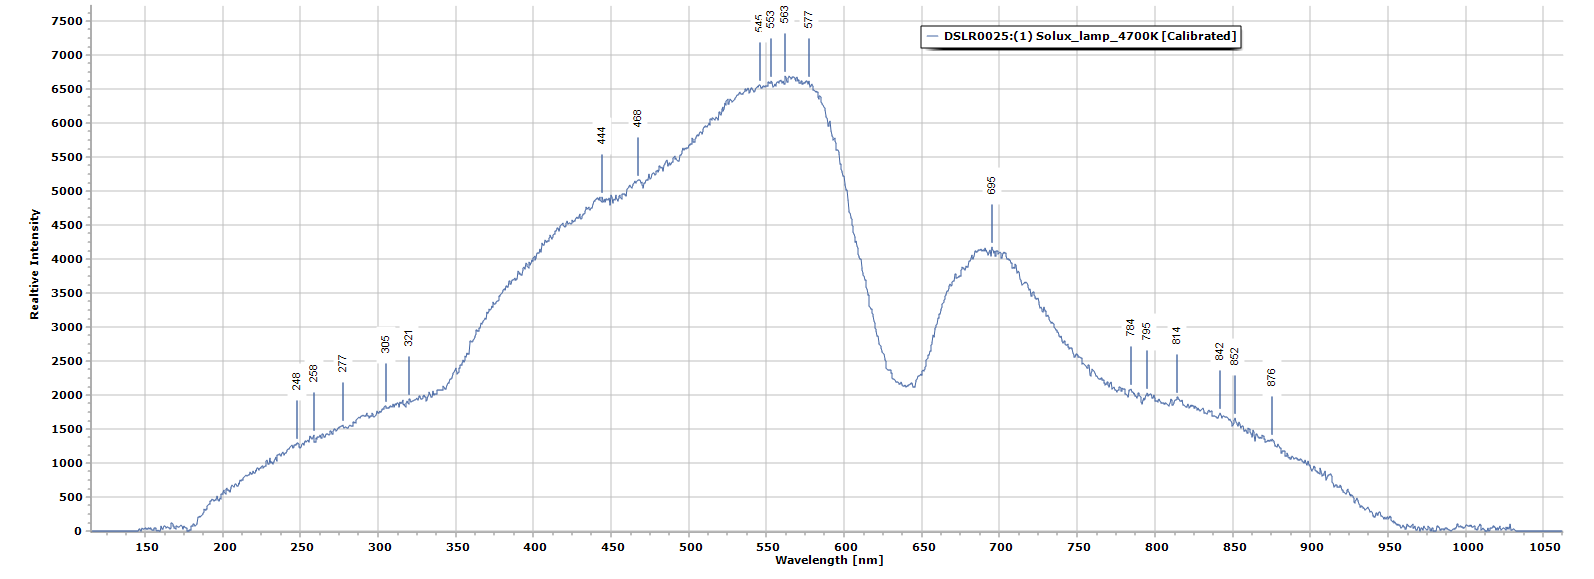
Here I think I did something kinda cool and educational, my spectroscopy processing software allows me to show the individual elements at their respective peaks on the spectrum, and since this camera allows for far greater detail and data resolution I was able to present some of the more pronounced peaks and their corresponding elements on the periodic table of elements.
The spectral image you see of my Solux lamp is only 2992 x 2000 pixels and still I was able to gleen an incredible amount of information that I would never had been able to using a web cam or even a machine vision cam.
-
Experimenting With POF (plastic optical fiber)
02/25/2018 at 23:32 • 2 comments*UPDATE* 2/26/2018
FWHM value: 7.18nm, not bad for plastic fiber and cleaved with an Exacto knife :)
![]()
![]()
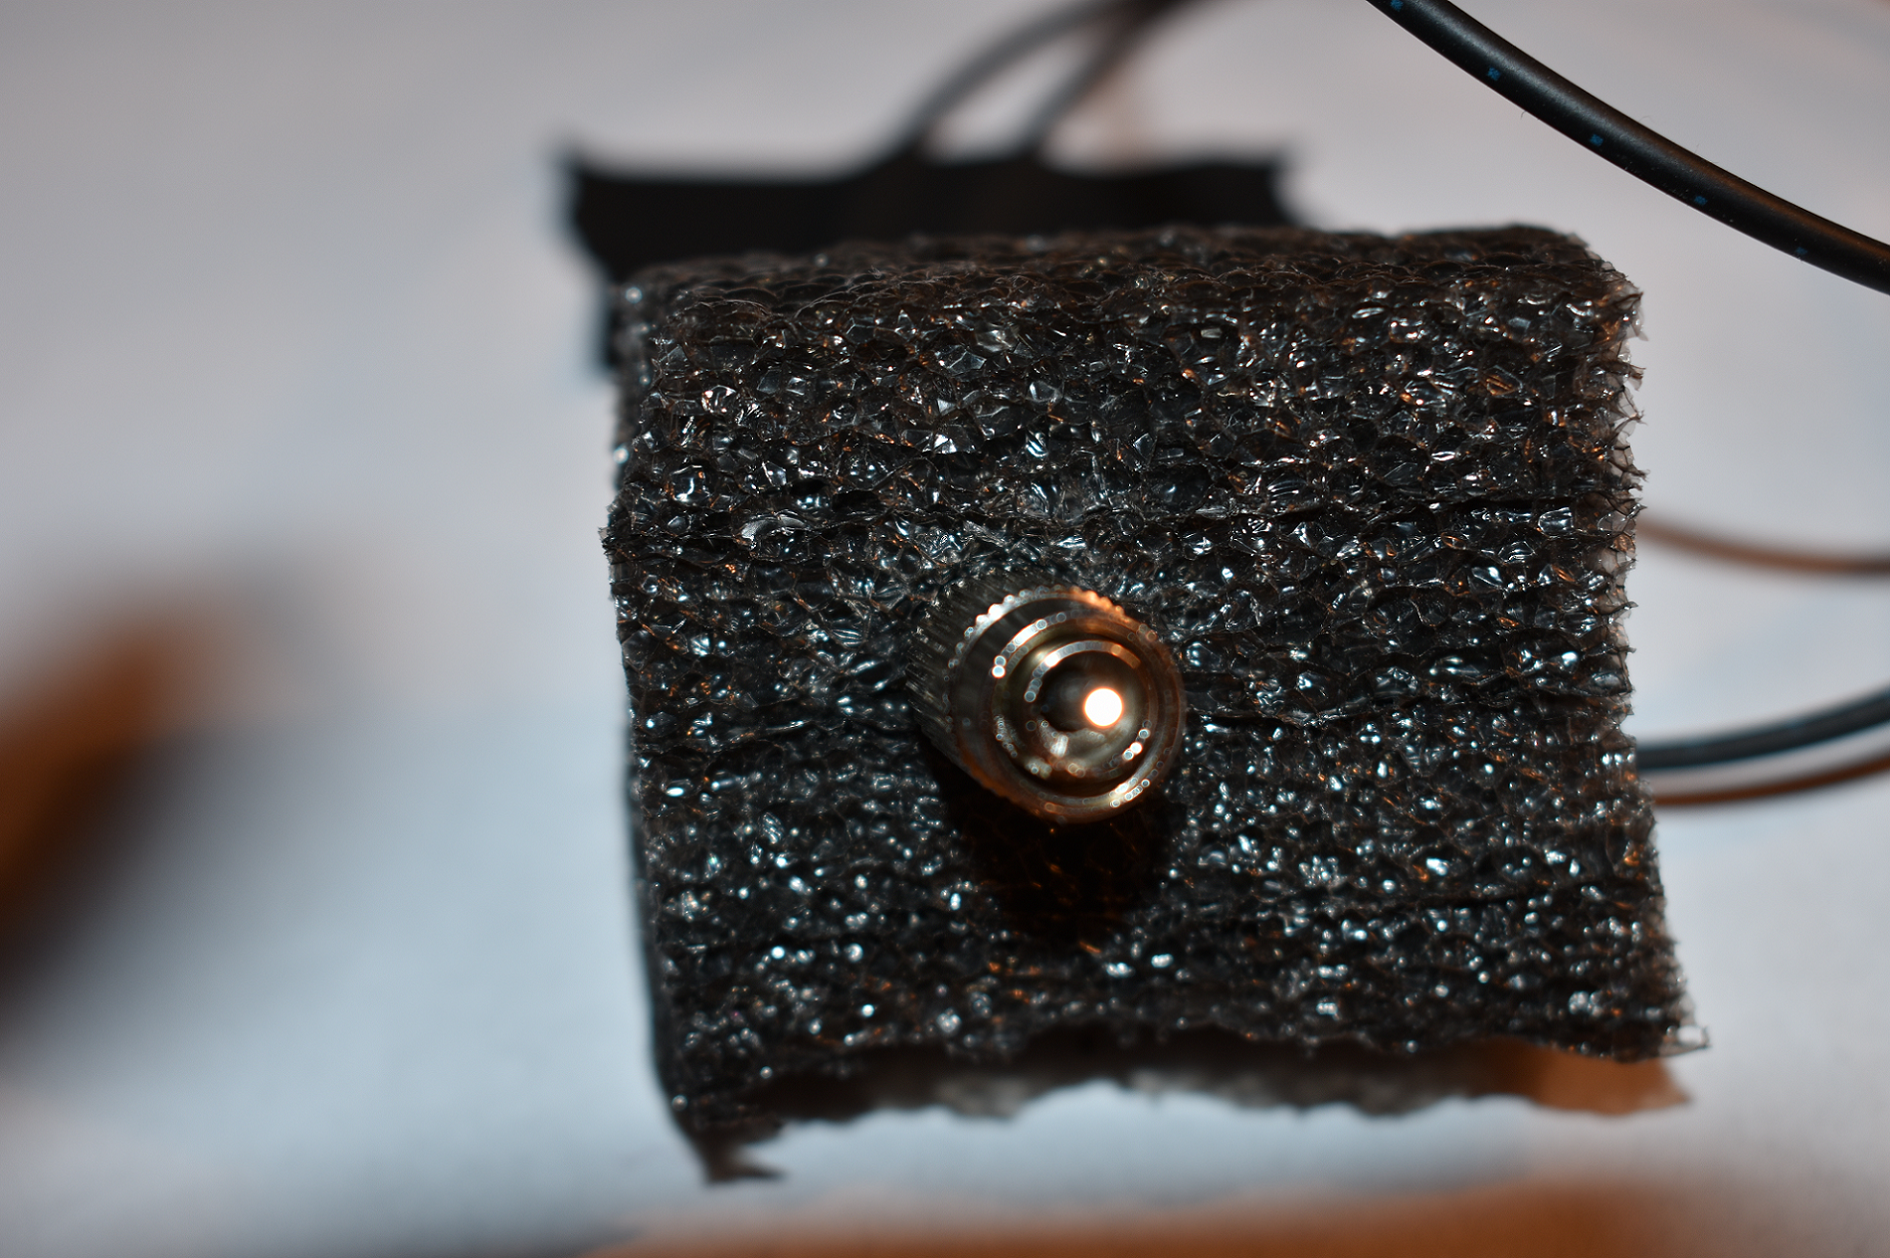
I had some POF lying around (really for about 10 years now,) and it was for a fiber optic project I was working on and just never got back to, well, I found it and decided to build a makeshift Endoscope type apparatus. The fiber itself is PMMA ( acrylic,) with a very thin cladding and 96% core, so a lot of light transfer and easy to work with and cleave.
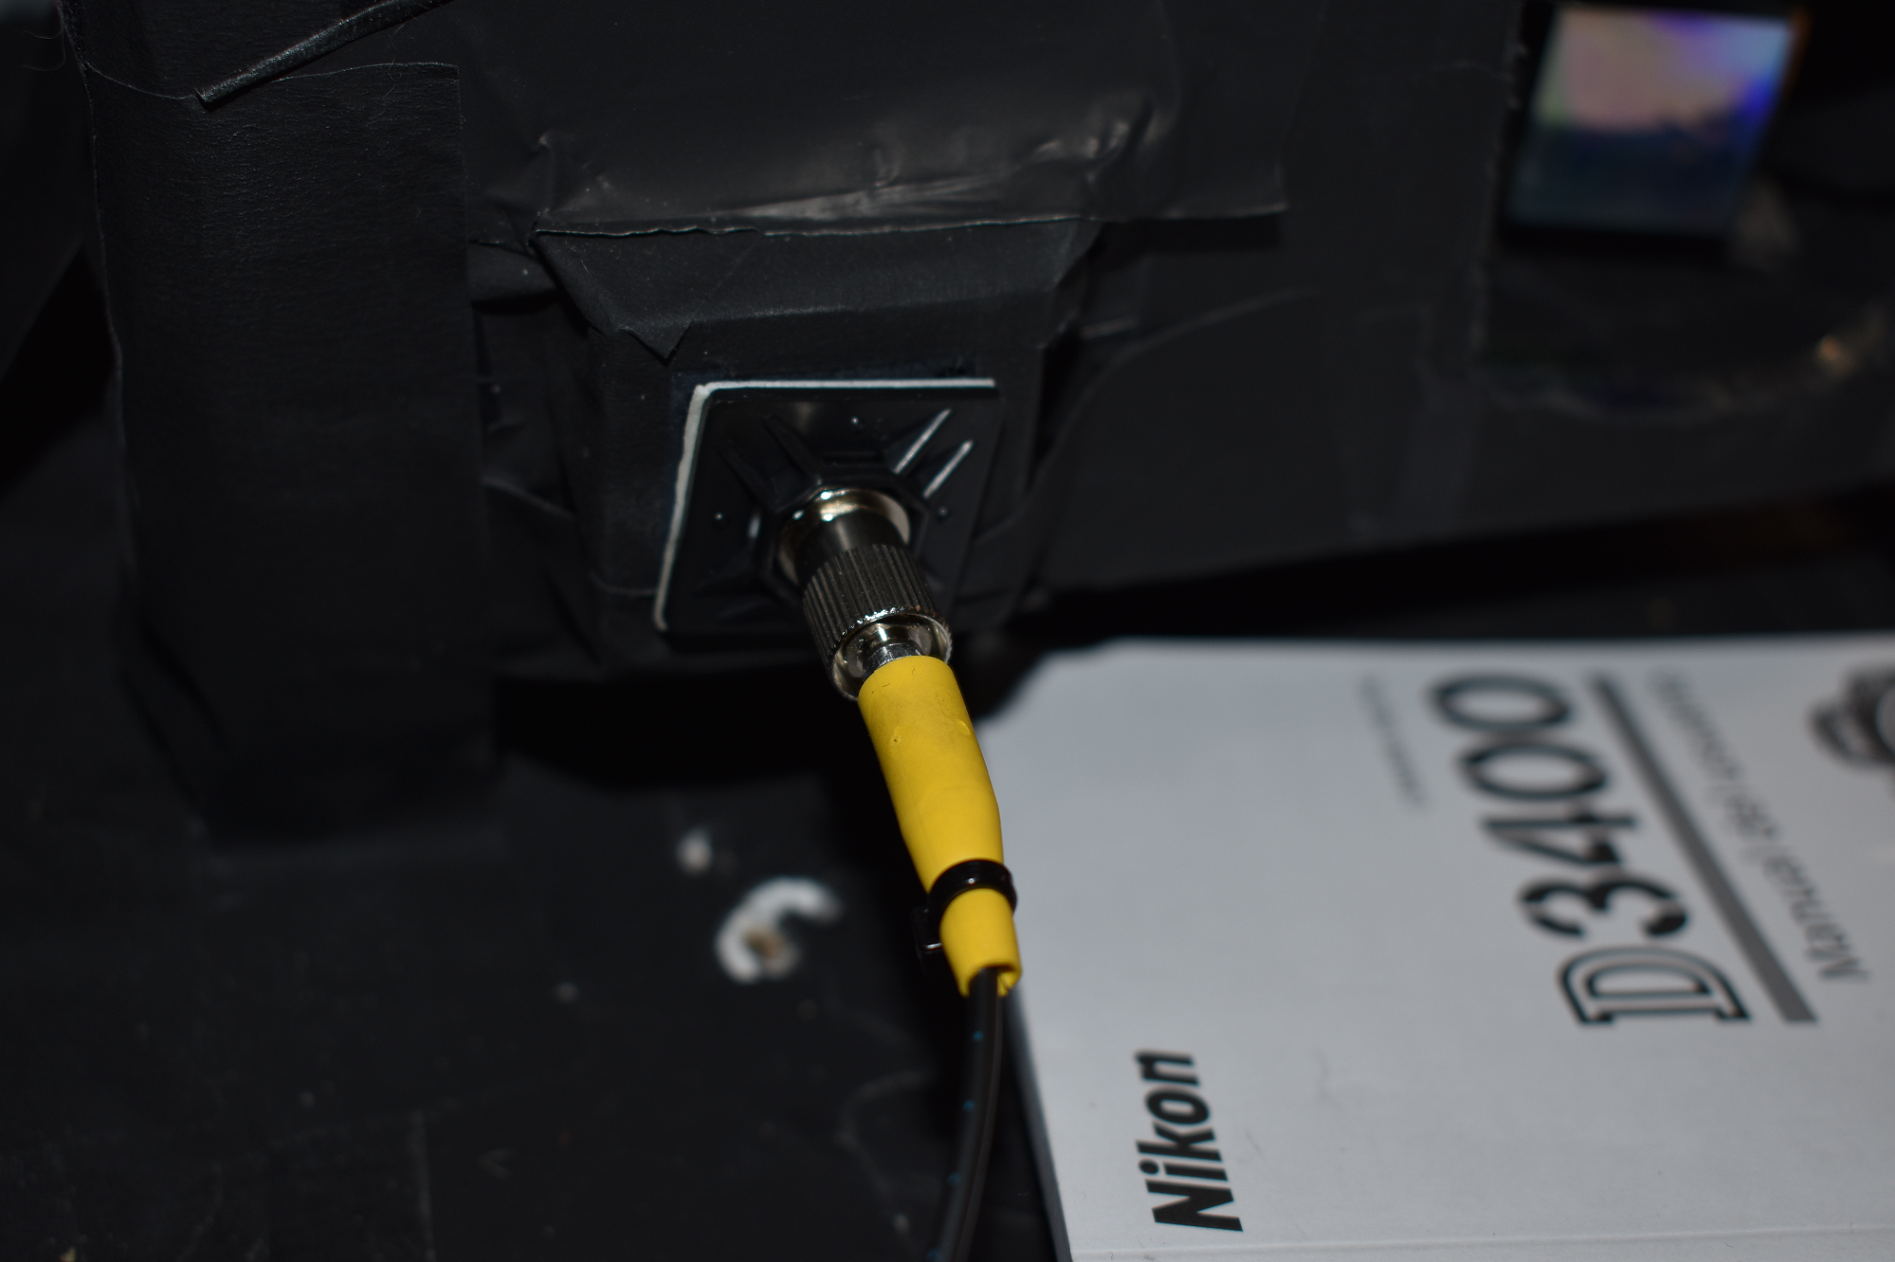
I set up my solux lamp as the light source and I'll let the pictures I took with my Nikon D3400 tell the rest of the story...
![]()
This is the Solux lamp spectral image ( 6000 x 4000 Pixels) NEF/NRW converted to JPEG, then PNG, in order to upload it to Hackaday.
![]()
I took an old fiber optic cable and cut the end off to get the coupler and drill it out so the plastic fiber end would slide through, I should have photographed the restraint in back to show how I cut it down the middle to remove it from the old cable and placed it on the new setup and crazy glued it in place and tie wrapped it and it is quite secure!
![]()
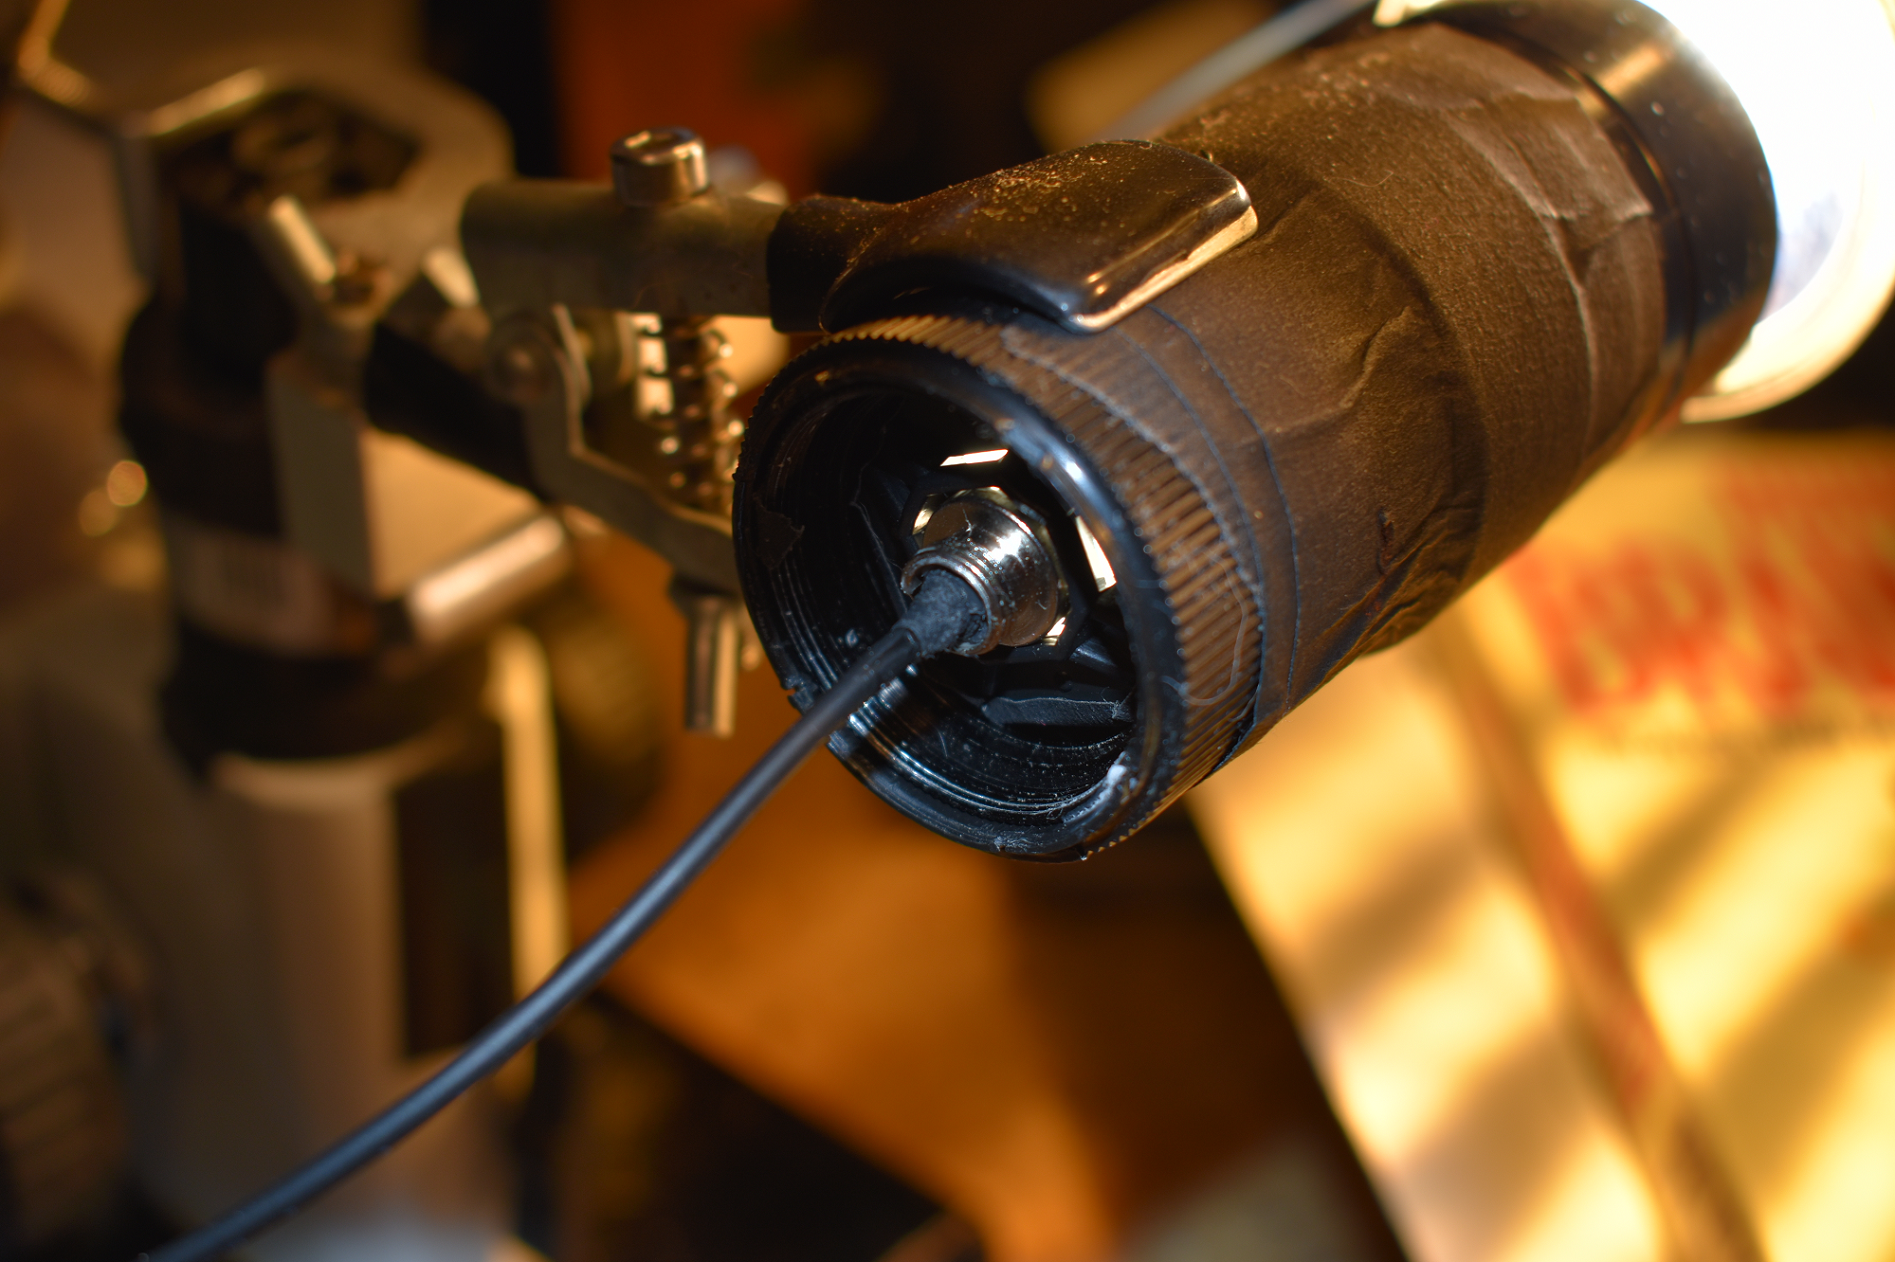
This is where the magic is happening, simple, a telescopic eyepiece, two 18mm dia. 10X objective lenses (placed 25mm from the fiber end and concentrically placed opposite of each other @ 5mm spaced apart.) This keeps the beam right side up and about 2mm in diameter before hitting the fiber optic end.
![]()
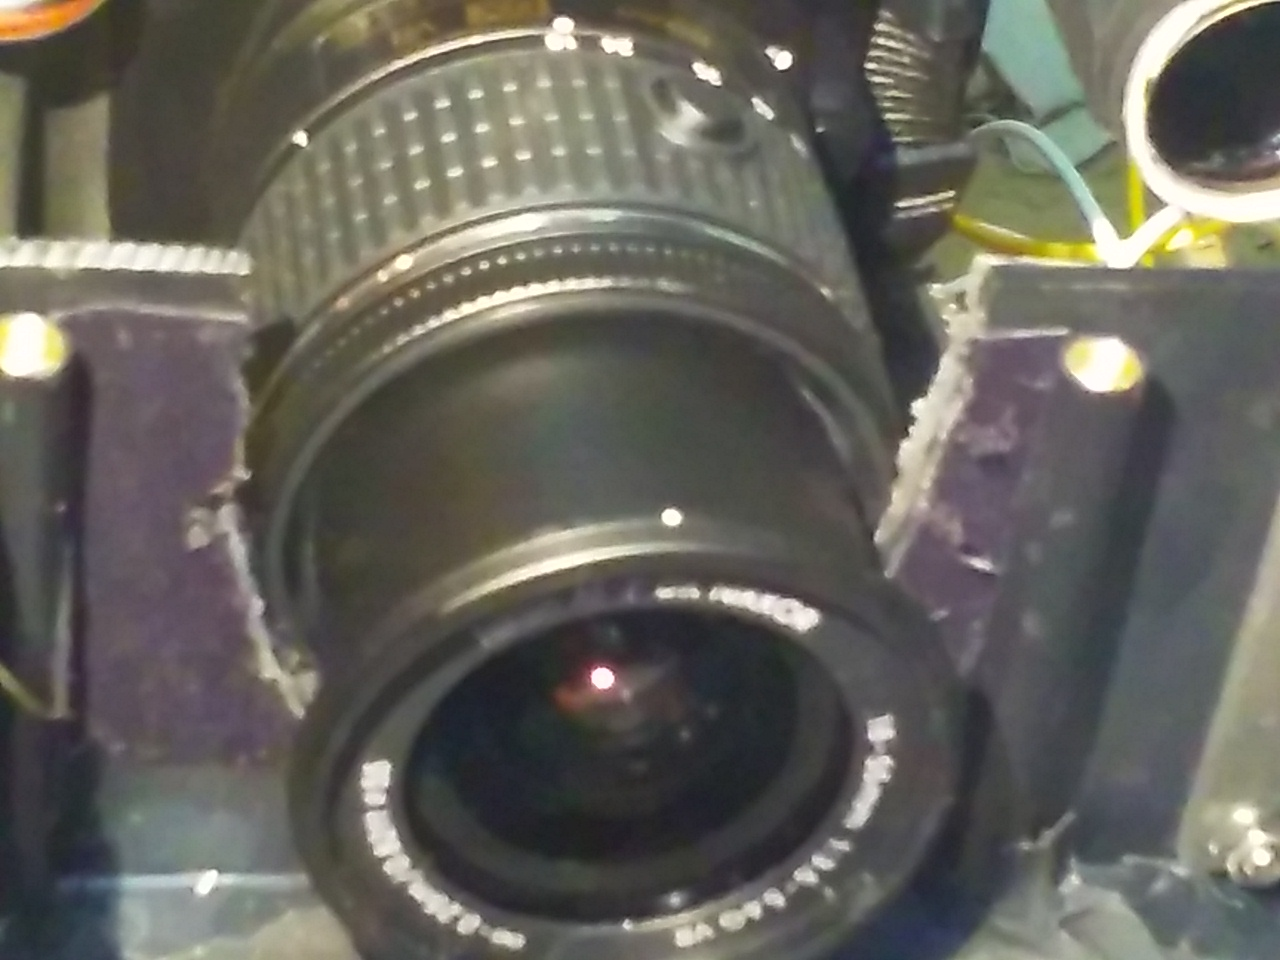
And of course this is my experimental prototype testing platform that I am using at the moment for the Raman probe project. Hey U know what? This is the pic of the restraint! Duh...
![]()
This is the raw spectral data form the camera, I had to take still shots as I discovered that the D3400 can only resolve @ 1080 pixels when in video mode, no matter what:(
So I take several individual stills and average them together to get the best image and data possible, which I should be doing anyway, since each image has a resolution factor of 6000 x 4000 pixels. Also here I am calibrating the spectrum to out Sun which is classified as a G-5v type dwarf
![]()
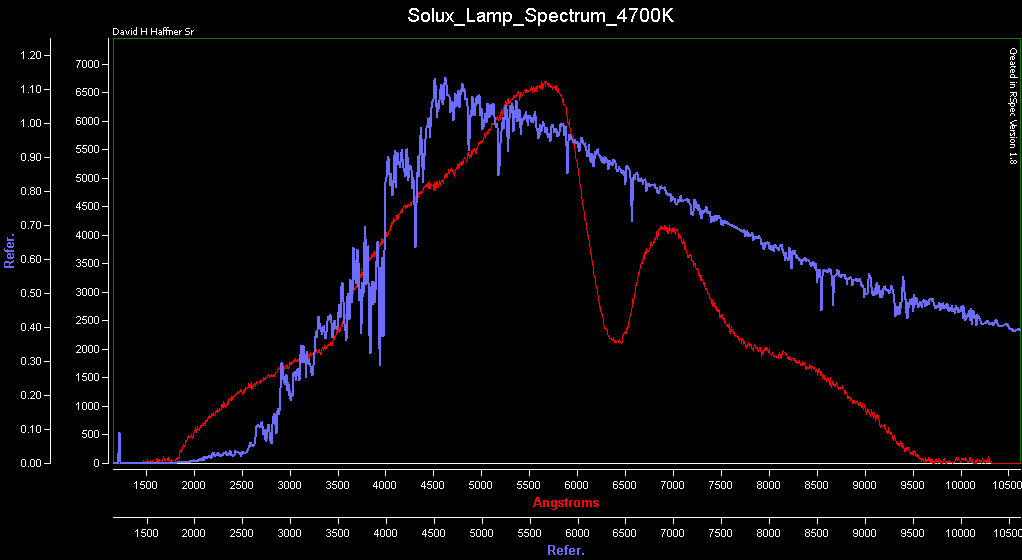
This is the spectral data all cleaned up and processed in Spectragyph processing software.
![]()
This is both the calibrated and un-calibrated Solux spectral data.
-
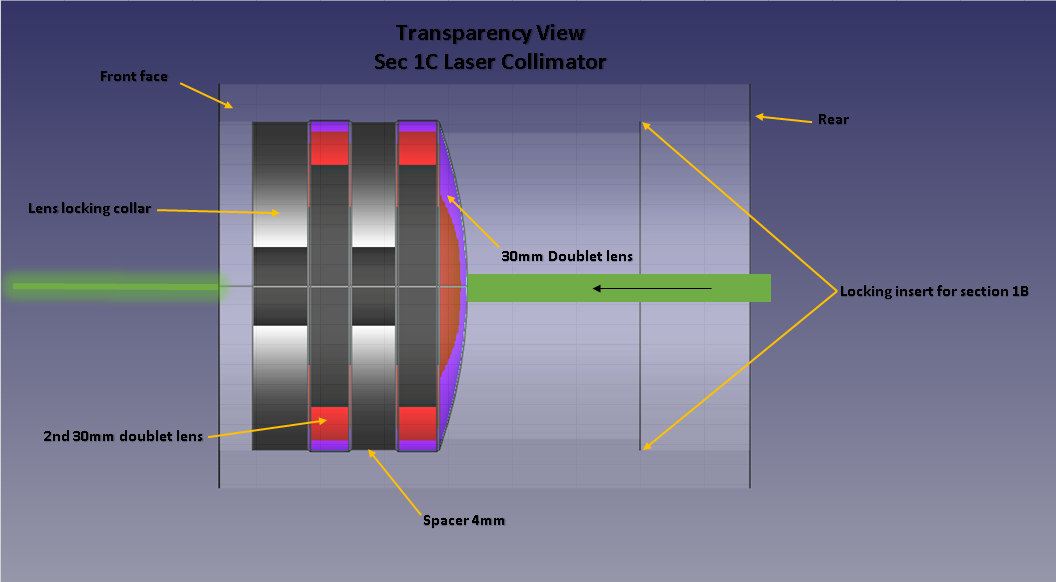
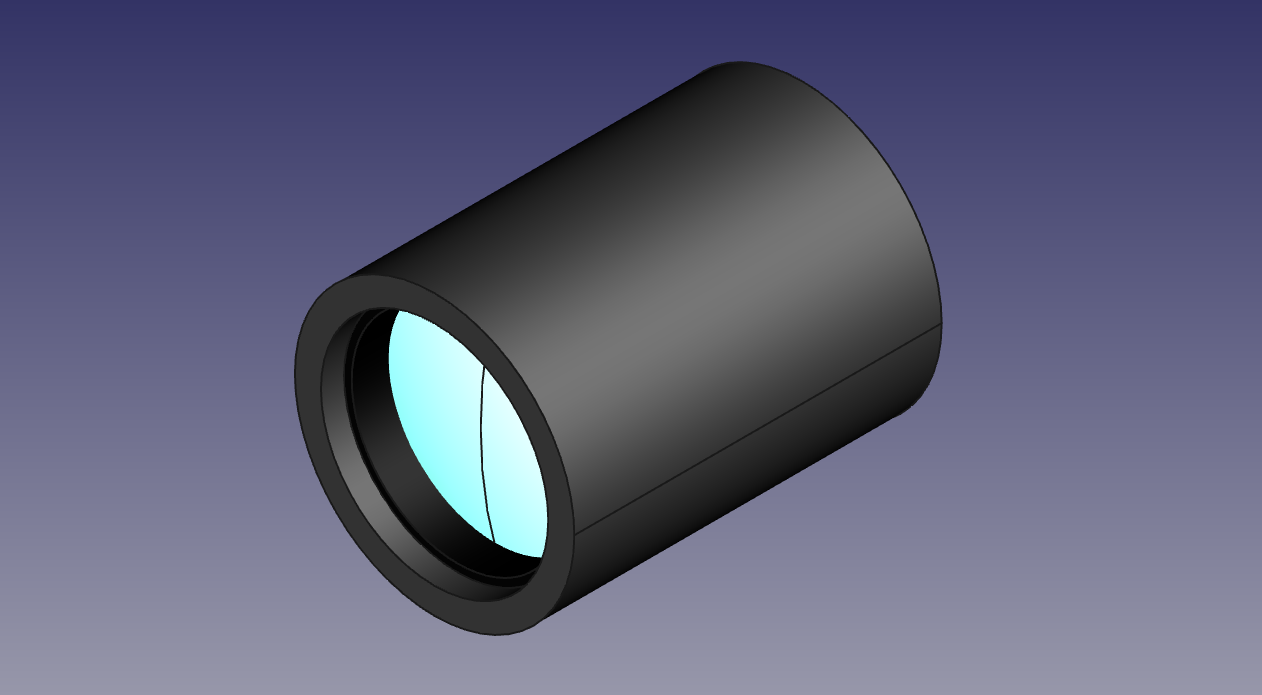
Modified Section 1C Laser Collimator
02/15/2018 at 13:05 • 0 commentsHere is the modified design change for section 1C of the laser collimator, now with a focal distance of 35mm @ [150mW]
![]()
![]()
-
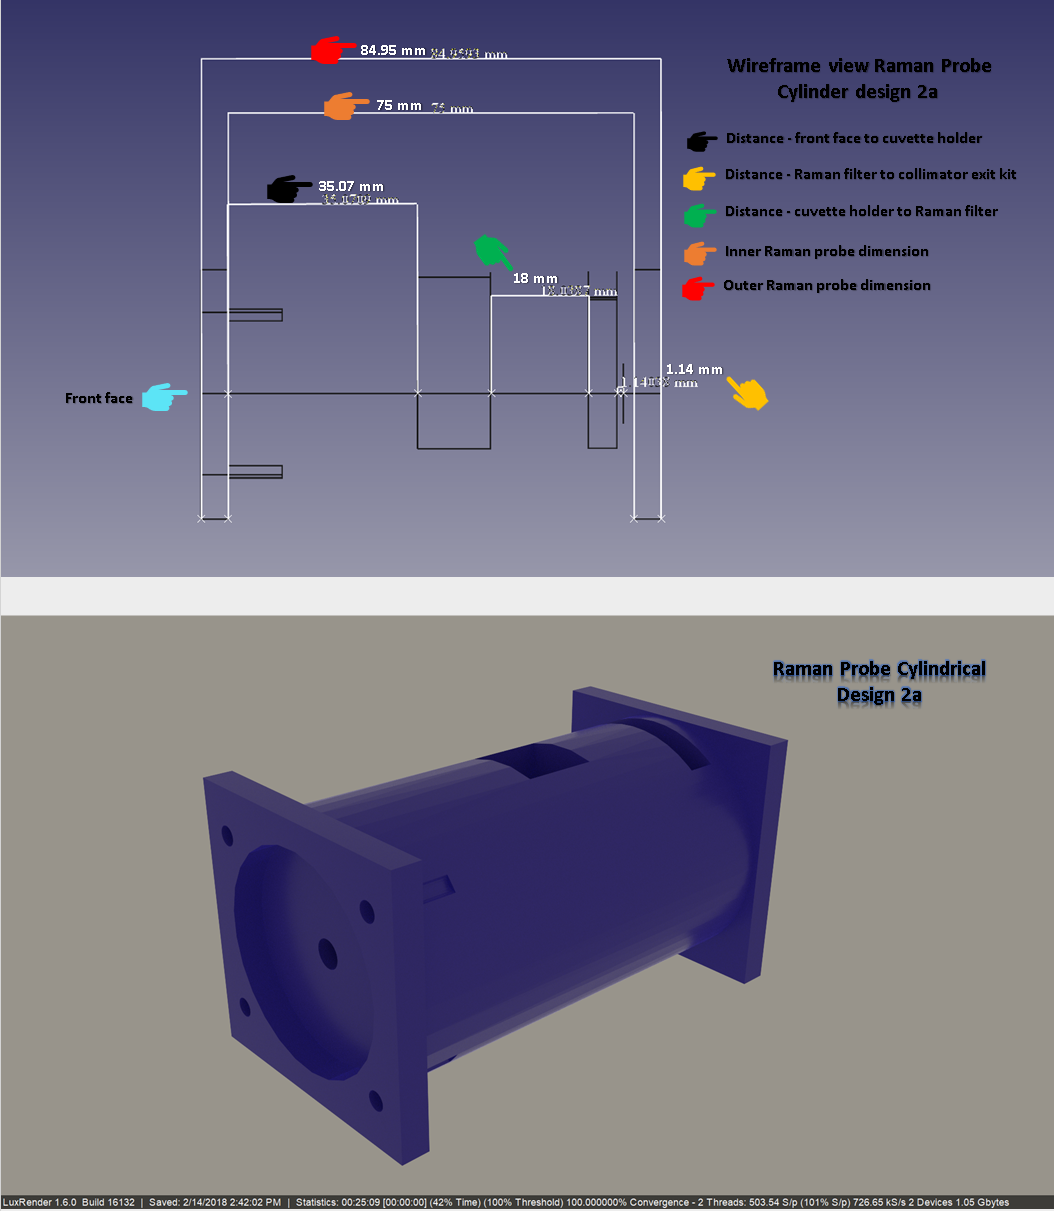
Wire frame View W/Dimensions and Distances
02/15/2018 at 07:53 • 0 commentsI had to tweak my probe design once again after some research, and readjusted the distances from the front fiber port to the cuvette holder and the Raman edge filter (or optional Notch filter,) this also forced me to modify section 1C of the laser collimator tube assembly which I will be uploading those specs soon.
![]()
![]()
-
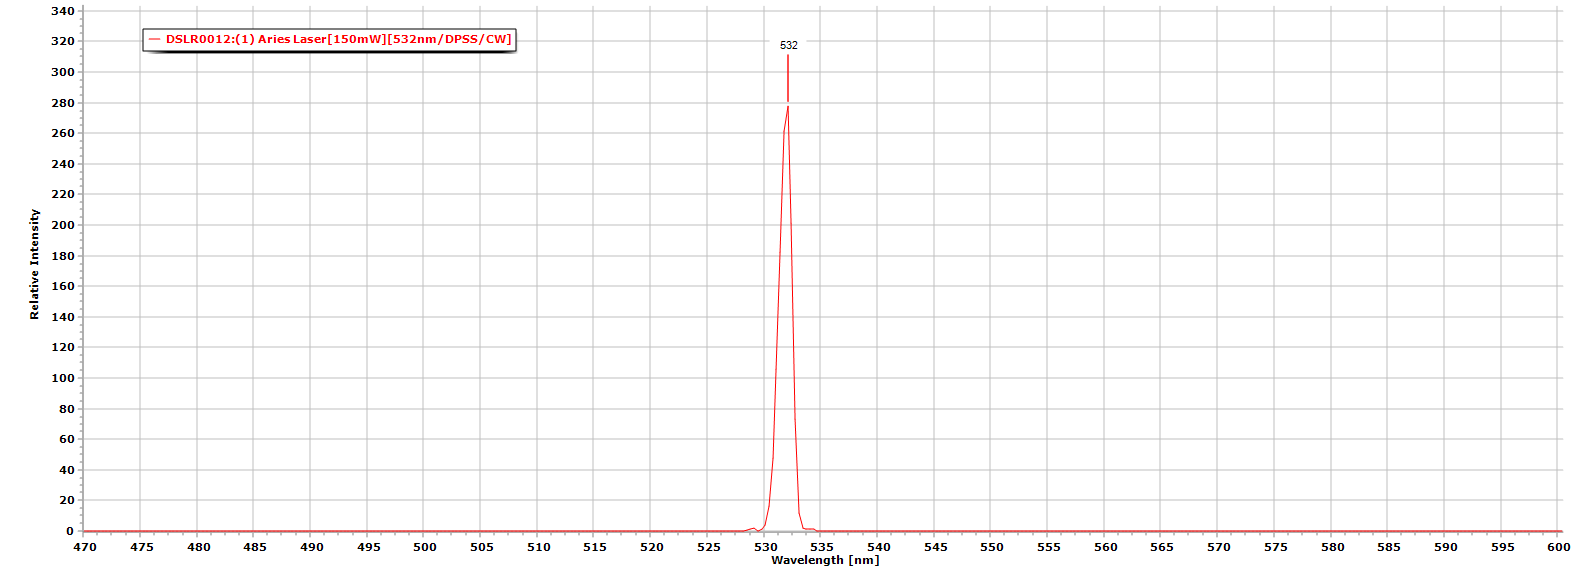
1.3 nm Resolution using Prototype Laser Collimation Tube Assembly
02/12/2018 at 15:34 • 0 commentsI have verified my measurements and focal distances using my mock prototype enclosure assembly and laser collimation tube assembly. I am presenting my data as my 1st official recorded test (DSLR0012[1a]). Below is the plot data and spectral image of the laser scan ( Aries 532nm green laser/150mW/DPSS/CW) and the FWHM data.
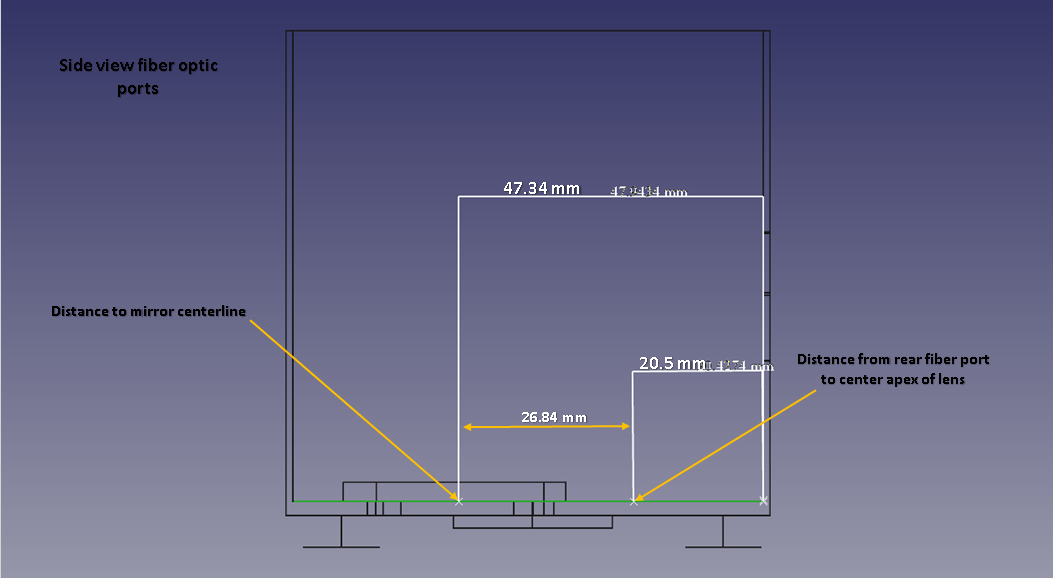
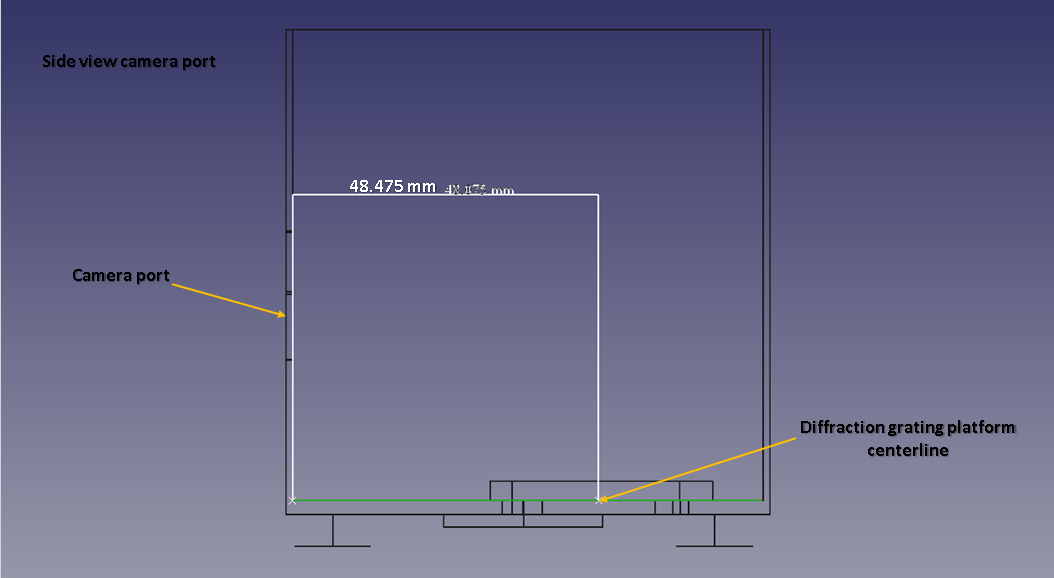
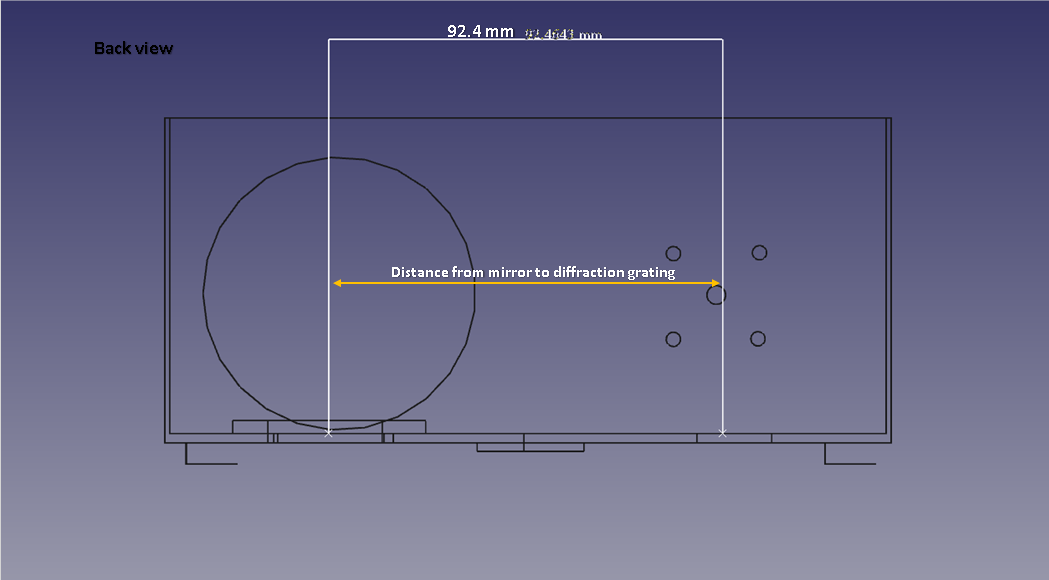
Also I am including the measurement drawings showing the exact placement and focal distances for the mirror and diffraction grating since these where not stated in the original quoted paper.
![]()
![]()
![]()
![]()
![]()
![]()
-
Solving 4 Mistakes from "A Homemade Cost Effective Raman Spectrometer with High Performance"
02/11/2018 at 13:38 • 0 commentsExcerpt from: “A Homemade Cost Effective Raman Spectrometer with High Performance”
Journal of Laboratory Chemical Education
2015; 3(4): 67-75
doi:10.5923/j.jlce.20150304.02
Author’s: Eduardo H. Montoya R.1, 2, Aurelio Arbildo L.3, Oscar R. Baltuano E.2, 4
“Beside this, it has to be noted that spectral resolution is not constant along the entire spectrum, being progressively worse towards the left and right sides of the focusing point. This undesired effect is connected with the fact of that it was not possible to keep the whole spectrum well focused.”
“The light travels through a 1.5 meters fused silica fiber optic with 200 micron working diameter, which illuminates a flat mirror. The light is reflected onto a 50 mm by 50 mm reflective holographic grating (1200 grooves/mm).”
“The sample is illuminated with the doubly filtered light of a bright inexpensive green laser pointer, with a nominal power indicated as “< 100 mW”.
In this presentation I want to focus on the 4 most prominent mistakes in this research paper that prevented the authors from resolving several Raman peaks and why. They are highlighted in Italics.
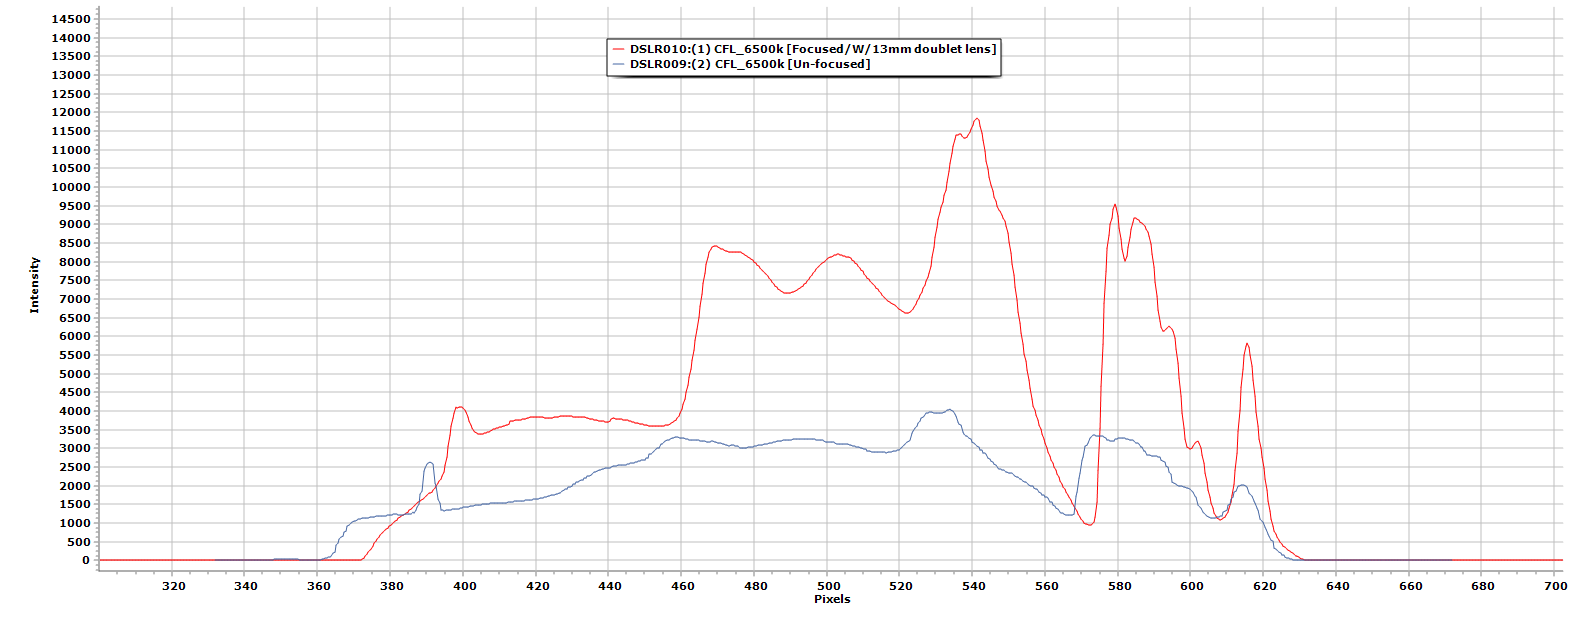
- The first is their spectral focusing problem, in figure 1 I show two spectral images of my CFL lamp (6500K,) the red plot shows sharp focused peaks and higher detail, while the blue plot is lacking in detail and has more subdued peaks. This was something either not covered in their presentation or just not bothered with.
![]()
- Two, they used a “flat mirror” as their reflective medium, big mistake, why? Because there is no way to collimate and focus the incoming light, using the flat mirror causes the image to spread in a linear fashion (un-focused and blurred.) So, when it gets to the diffraction grating half of the spectral image is lost and 40% is lost again because of the grating itself!
- Three, according to my research and experience, an 1800 mm/gr holographic grating works best for Raman spectroscopy under these circumstances and for the most part others as well. A 1200 mm/gr grating mainly resides in the UV/VIS range of the spectrum as far as spectral peak resolving is concerned.
- Four, and a very important factor I might add, is the type of laser used. Yes, one can use a laser pointer and it will work, the problem is, noise, yes lasers exhibit noise. So, the state they used a laser pointer of <100mW, but didn’t really state the exact value, I use an Aries 532nm 150mW Portable laser (DPSS/CW,) so it is of excellent quality.
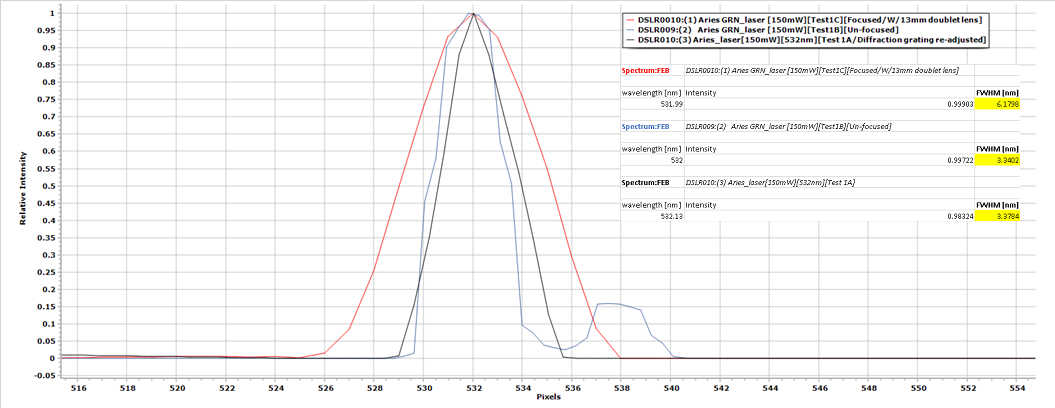
Now, in figure 2, I have three plots, using my Aries 150mW laser, 2 are focused and 1 is not. The focal lens I am using is the same one that I will be using in the rear fiber optic port (13mmachromatic coated doublet, F=50mm.) You can clearly see from looking at the blue plot (un-focused,) a very blurred and dirty image. The red, test1C is, focused, test 1A I had to re-align the diffraction grating.
This was all done with the proto type enclosure set up I constructed to simulate the actual Raman set up. I did this to ensure that I have all my focal distances correct and angles exact.
Another important point is the Focal distance of the entrance fiber port, which is 7.5mm, it is 47mm from the rear fiber port to the 1st mirror (centerline,) so, we calculate 7.5mm travel to the 13mm doublet lens, from the lens to the 1st mirror is 34mm, well within our focal range. the 1st mirror is our 50 x 6 x 50mm concave silver coated, with an F=100mm distance, so we are good there also, because distance between 1st mirror and diffraction grating centerline is 94mm.
![]()
I am presenting figure 3 because it represents all 3 laser scans as they appear without zooming in, its just an interesting note because often you cannot distinguish important details in spectra until you zoom in on their peaks or base.
![]()
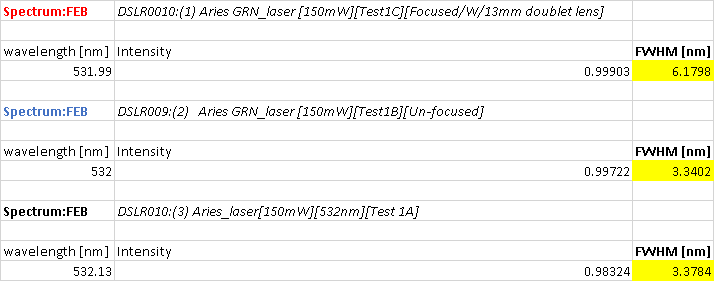
This is figure 4, the FWHM data for the laser scans:
![]()
In closing I want to point out also that, it is vitally important when presenting scientific papers, to include as much technical detail as needed, right or wrong when your peers review it, they won’t be left to wonder about how certain procedures were carried out or how did you arrive at a certain conclusion based on a technical aspect contained in your presentation or drawings.
Attention to detail, I can never stress this point enough, it may be the most boring part, but it will be the part that saves you the most time or embarrassment.
All in all, I am satisfied with the re-calculations I had to make and the re-working I had to do from their model, but it will work. I hope this short presentation of mine is helpful in the sense of getting a better grasp on this project, especially when working off someone else’s work, alas though, this is the beauty of science and engineering, building from each other’s work and vision, mistakes and successes!
1Facultad de Ciencias, Universidad Peruana Cayetano Heredia, Lima, Perú
2Dirección de Investigación y Desarrollo, Instituto Peruano de Energía Nuclear, Lima, Perú
3Instituto de Investigación Científica (IDIC) - Facultad de Ingeniería Industrial, Universidad de Lima, Lima, Perú
4Facultad de Física, Universidad Nacional Mayor de San Marcos, Lima, Perú
Correspondence to: Eduardo H. Montoya R., Facultad de Ciencias, Universidad Peruana Cayetano Heredia, Lima, Perú.
Copyright © 2015 Scientific & Academic Publishing. All Rights Reserved.
This work is licensed under the Creative Commons Attribution International License (CC BY). http://creativecommons.org/licenses/by/4.0/
![]()
-
Crude Mock-Up Raman Spectrometer/Probe Set-up
02/08/2018 at 20:51 • 0 comments*Update* This is for those who have asked what type of fiber optical core I am using:
Thorlabs' SM300 fiber consists of an undoped, pure silica core surrounded by a depressed, fluorine-doped cladding. Since these fibers do not contain germania (GeO2), which causes electronic defects and color centers associated with the Ge-O bond, the primary cause of photodarkening is greatly reduced. As a result, power handling in the blue region is increased from several milliwats to several watts. The transmission-limiting effects caused by other nonlinearities (e.g., stimulated scattering) or even thermal damage are also increased over those of a conventional silica fiber doped with germanium. In the UV region, the SM300 will still exhibit some photodarkening, but will have superior performance compared to conventional fibers. http://www.thorlabs.com/newgrouppage9.cfm?objectgroup_id=949
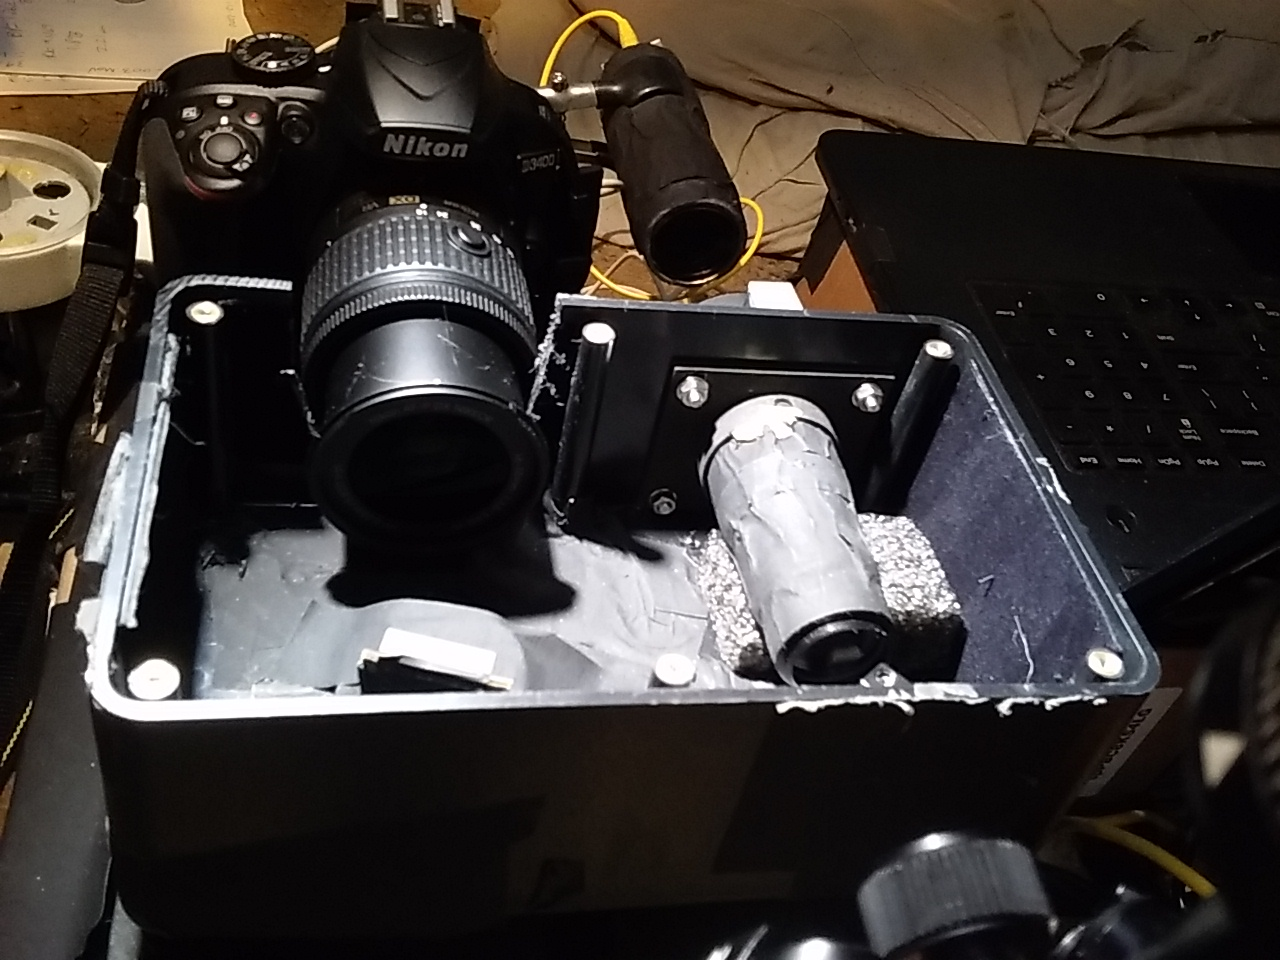
This is a very crude set-up but it simulates the concept and my design.
![]()
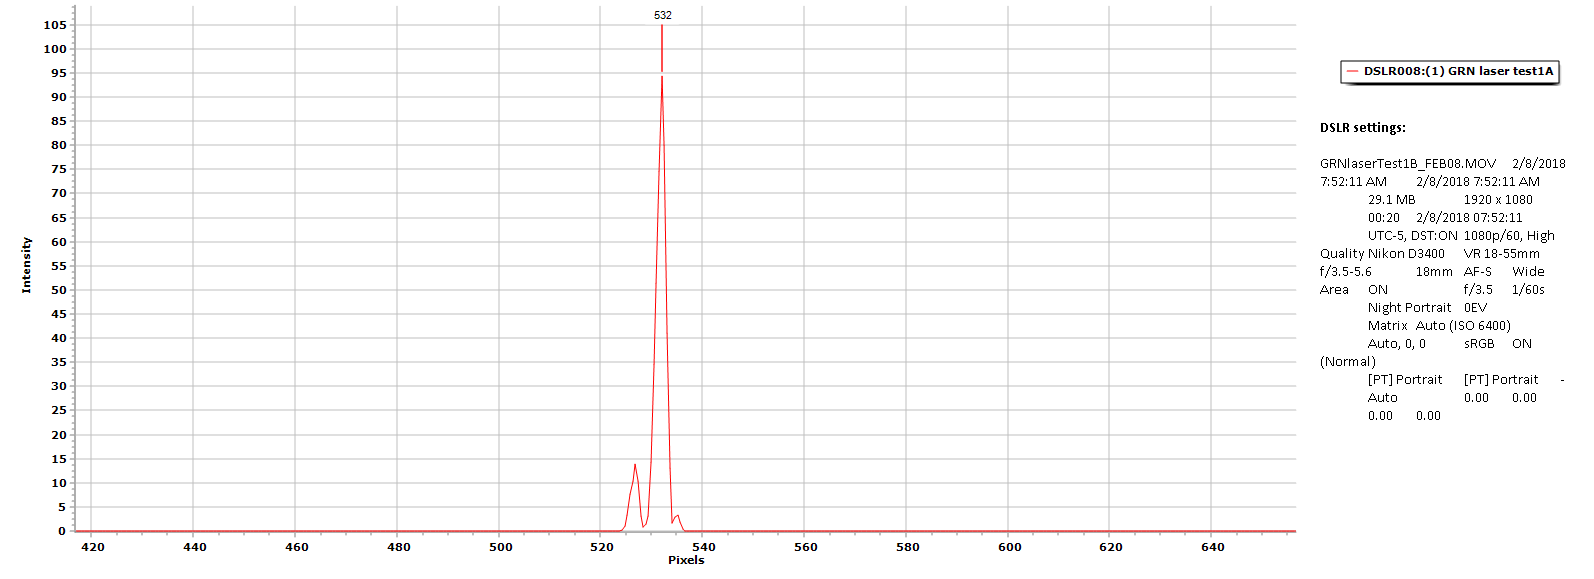
Right next to the camera U can see my laser tube collimation prototype, I used this to shoot through the slit to the 1st mirror (concave focusing mirror,) @ 45 deg. and 88 mm length to the diffraction grating, which I readjusted to about 27 deg. (I used a plastic protracting ruler). The DSLR camera settings are annotated on the plot below.
![]()
Success! The plot above illustrates the laser collimated beam (with just a little noise, I didn't do a thorough cleanup,) processed using RSpec, the peak is very sharp and FWHM is @ 2.1nm. My calculations predicted a resolution factor of 2.216nm for a 200um slit width and a 1200 mm/gr.
Below is the FWHM data from Spectragrpyh with the actual accurate data.
![]()
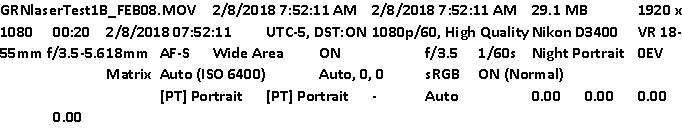
Below are the camera's settings at the time of spectral capture.
![]()
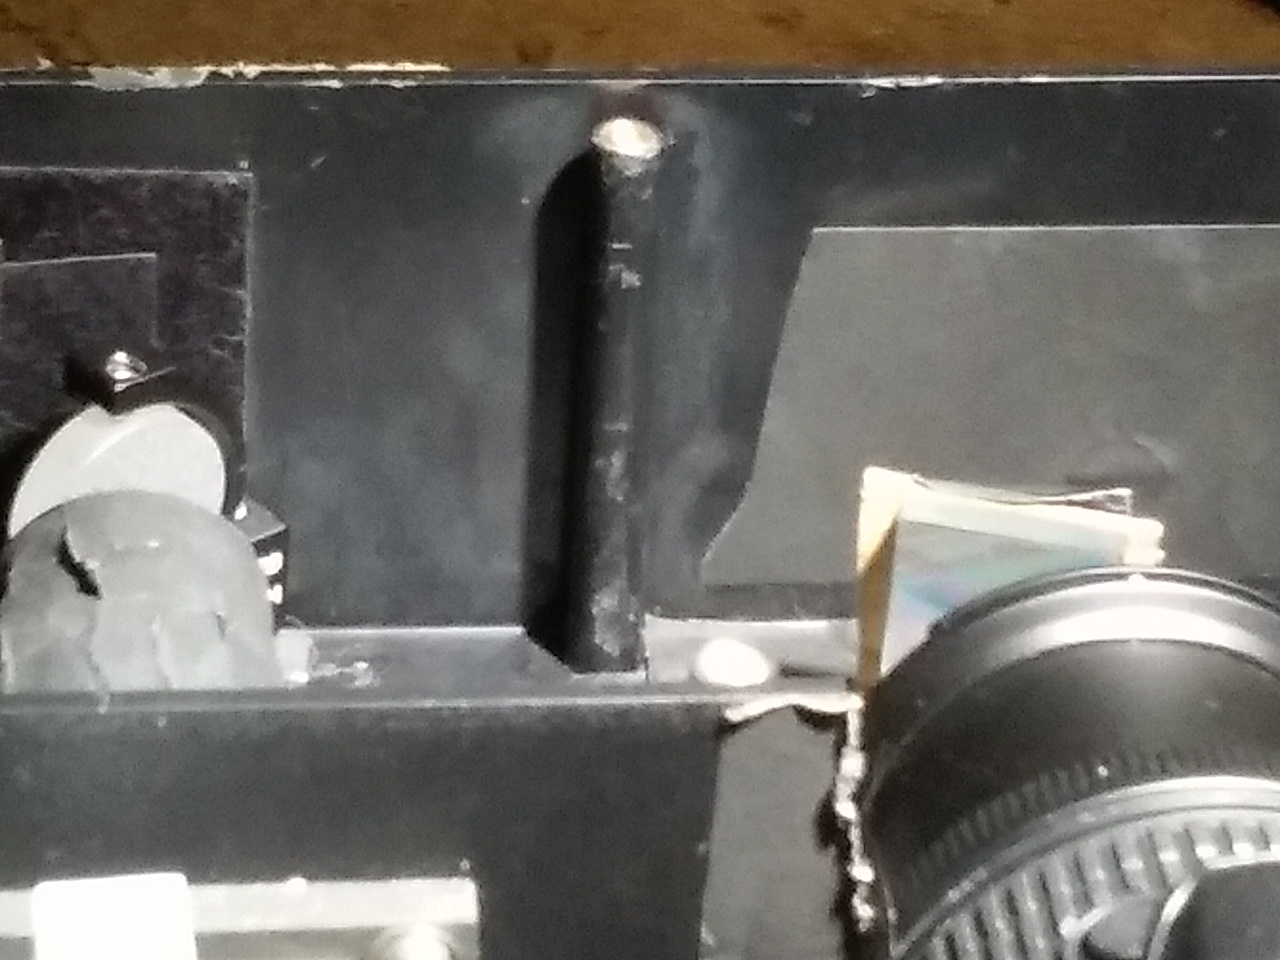
Close up view of collimation mirror as it relates to the diffraction grating.
![]()
Close up of camera focal lens sitting in the cut-out of enclosure. I used my Roto-Zip tool cutter to cut the section out properly.
![]()
-
My Research and The Science Of a Stroke
02/06/2018 at 13:18 • 0 comments![]()
I’m breaking a little protocol today and talking about my research over the past two years. I started this venture around the beginning of January of 2015, sounds benign enough but I had a very close friend, who had recently lost a relative to which they thought was under suspicious circumstances.
A situation that for all intents and purposes, might rise to a dime store mystery novel. (no joke!) if I was inclined with the skill to write such things, I probably really would, anyway, without getting into the personal of it all, there was a “white powdery” substance in a bottle that should not have been in there…yeah, getting it now? This friend asked me if there was any way to find out what it was and I said yeah you can take it and get it analyzed, it’ll cost some money but it can be done.
For whatever reason, that route was unacceptable and I wasn’t going to push it so, I said give some time and I’ll see what I can do. Having an engineering and chemistry background helps in matters of the scientific persuasion so, I figured I could maybe buy a spectrometer and do the job myself, ha ha ha, yeah right! I’m retired, not rich, turns out though, I came across a website called Public Lab where you can learn how to investigate environmental concerns and use inexpensive DIY spectrometer’s and techniques. So that’s where I bought my first spectrometer kit. Only problem was that, I didn’t realize the scope and magnitude that was about to unfold before me.
The adventure was on though and I was hook-line and sinkered in! Even with all my research, upgrades and intense experimentation, I could only at best (and only with 60 percent probability,) determine what the original “white powdery” substance was, which for privacy’s sake I will not disclose here, my friend though, was so very grateful that I did try, and I was glad I did also. What a grand learning experience that was and still is, and from that, is where the inspiration for the DAV5 V2.01 Raman spectrometer has come from.
Even as I’m writing this, I think of the times of frustration and disappointment, mainly at myself, wanting to just give it up, “man why am I doing all this?” 12 – 15-hour days, and for what? I keep forgetting procedures, the order of things, etc., why? well having a stroke several years earlier didn’t do me any favors. So, I developed a system of log books and these logs corresponded to files saved on my computer as a backup. I had to literally annotate just about every little thing I was doing, I have a short-term memory problem, but if I have a log of my previous actions I can recall it well.
In a lot of ways, my recovery was like an athlete sustaining a major injury rehabbing for 3 years to get back to a sense of normalcy. Still not all the way there yet!
I have now over 1000 pages of notes and research, each page has its own tab with a short description of that page, and it’s worked out very well, (this way I can refresh my memory on the details of each day,) So this is the adversity I must battle with daily, and I do it because I believe what I’m doing is significant on many levels, one being, the story I started at the beginning. I started to come to the realization just how expensive and far out of reach this technology really is, not just to your average citizen scientist or serious hobbyist, but to people I was encountering everyday over on Hackaday.com
I was interacting with brilliant individuals from Columbia, Slovakia, Chezania, and many others, all building incredible devices, with specific purposes in mind. Most of them out of sheer necessity, hey, when you are unable to afford a top of the line up to date piece of technology, your only choice is…to make it!
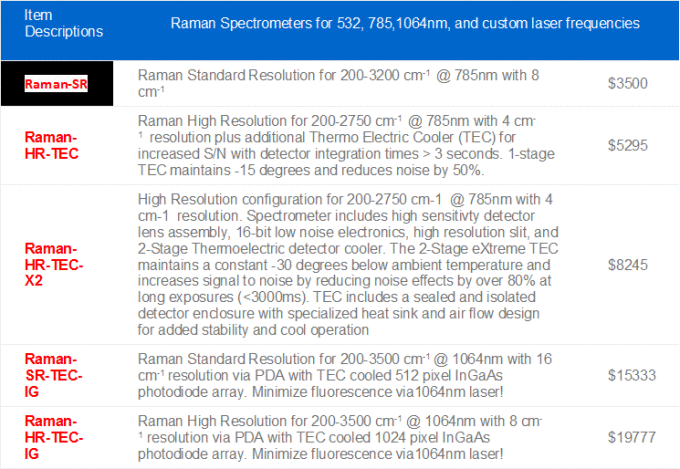
This is the “hook” the inner beauty of all this, yeah, I mix some philosophical connotation to all this but it’s the truth, at least as I am starting to understand it. Therefore, my project is not only important to me, but to many other’s as well, check this these stats out, they are the average cost of the “lower priced” Raman spectrometer’s that are available out there:
![]()
Ok let’s digest this a little, these are the “top” 5 lower priced Raman spectrometers (and if you can just bear with me, the next segment is why Raman spectroscopy is so vital in our everyday lives,) you see the price ranges no? Imagine my friend in Colombia wanting to do vital research in molecular biology or genetics, with an average monthly salary of $692 (47% of the worldwide average) ranked 54 out of 72 countries on the global pay scale, one position higher than Ukraine ($686) and one position lower than Bulgaria ($750).Apr 13, 2012.
Well I think you can start to get the idea here, now imagine my project and its benefits:
![]()
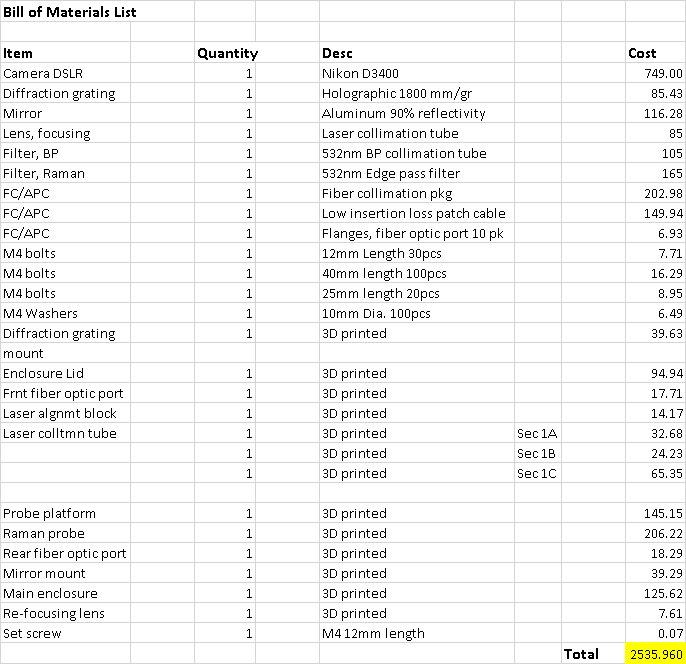
Even though this particular project is still in development, it's concept is sound and cost effective compared to what I have already shown.
As you can see my entire Raman probe set up complete, is only $2535.96 US.
Big difference huh? This is the core principle, the vision I have for this project, and the best part is, that it is becoming a reality, a testament I would say, at least me not giving up on it. This truly is my mission statement, I felt like I had to have one to stay focused and on point, it helped. Now I’m going to get into the details the why and how’s of all this and how this really impacts our lives without anyone ever thinking about it.
What Raman spectroscopy is, the measurement of the wavelength and intensity of inelastically (lacking flexibility,) of scattered light in molecules. Raman scattered light occurs at wavelengths that are shifted from the incident light by energies of molecular vibrations.
Important term #2 to remember, “molecular vibrations,” these vibrations have a specific and non-changing frequency, their strengths are characterized in terms of “degrees,” example;
- M, moderately strong
- M-S, moderate to strong
- M-VS, moderate to very strong
- S, strong
- VS, very strong
- VW, very weak
- W, weak
- W-M, weak to moderately strong
- W-VS, weak to very strong
The math behind these forces are;
R = < Xᵢ | a | Xⱼ >
(where Xᵢ and Xⱼ are the initial and final states, respectively, and a is the polarizability of the molecule:)
a = aₒ + (r-rₑ)(da/dr) + … higher terms
(where r is the distance between atoms and aₒ is the polarizability at the equilibrium bond length, rₑ. Polarizability can be defined as the ease of which an electron cloud can be distorted by an external electric field. Since aₒ is a constant and < Xᵢ | a | Xⱼ > = 0, R simplifies to;)
R = < Xᵢ | (r-rₑ)(da/dr) | Xⱼ >
The result is that there must be a change in polarizability during the vibration for that vibration to inelastically scatter radiation.
The poloarizability depends on how tightly the electrons are bound to the nuclei. In the symmetric stretch the strength of electron binding is different between the minimum and maximum internuclear distances. Therefore, the polarizability changes during the vibration and this vibrational mode scatters Raman light (the vibration is Raman active).
In asymmetric stretch the electrons are more easily polarized in the bond that expands but are less easily polarized in the bond that compresses. There is no overall change in polarizability and the asymmetric stretch is Raman inactive.
Raman line intensities are proportional to:
v∙ σ(v) ∙ |∙ exp(-Eᵢ|kT)∙C
(Where v is the frequency of the incident radiation. σ(v) is the Raman cross section, typically;)
10⁻²⁹ cm²
(I am the radiation intensity, exp(-Eᵢ|kT) is the The Boltzmann Factor for state i, and C is the analyte concentration.)
Whew, now that was cryptic wasn’t it! That is the techy “basic” principle of Raman spectroscopy, how can such a seemingly obscure discipline be so important in our everyday lives…
- It can be used to rapidly characterize the chemical composition and structure of a sample, whether solid, liquid, gas, gel, slurry or powder.
- Compound distribution in tablets
- Blend uniformity
- High throughput screening
- API (air pollution index) concentration
- Powder content and purity
- Raw material verification
- Polymorphic forms
- Crystallinity
- Contaminant identification
- Combinatorial chemistry
- In vivoanalysis and skin depth profiling
You see the potential? It’s like a ripple effect, propagating its way through all other disciplines of science. Another example, which in my opinion is the best, is what Raman is all about; The “finger print,” just like in a “CSI” weekly episode.
![]()
This should look familiar, a human fingerprint begin scanned apparently on a finger print reader.
Now this is the same print but analyzed under different protocols, and scientific techniques, the same premise applies to Raman, everything no matter if it is liquid, gas or a solid has a unique inner molecular signature that can be characterized and quantified.
![]()
Abstract “Cancers are often impossible to visually distinguish from normal tissue. This is critical for brain cancer where residual invasive cancer cells frequently remain after surgery, leading to disease recurrence and a negative impact on overall survival. No preoperative or intraoperative technology exists to identify all cancer cells that have invaded normal brain. To address this problem, we developed a handheld contact Raman spectroscopy probe technique for live, local detection of cancer cells in the human brain. Using this probe intraoperatively, we could accurately differentiate normal brain from dense cancer and normal brain invaded by cancer cells, with a sensitivity of 93% and a specificity of 91%. This Raman-based probe enabled detection of the previously undetectable diffusely invasive brain cancer cells at cellular resolution in patients with grade 2 to 4 gliomas. This intraoperative technology may therefore be able to classify cell populations in real time, making it an ideal guide for surgical resection and decision-making.”
This came from an article @ Science Translation Medicine 1 Feb 2015.
The advancements just keep on coming, see where this is all leading? The final 2 examples are going to tie up my points very nicely and then we will discuss the conclusions arrived at by all this:
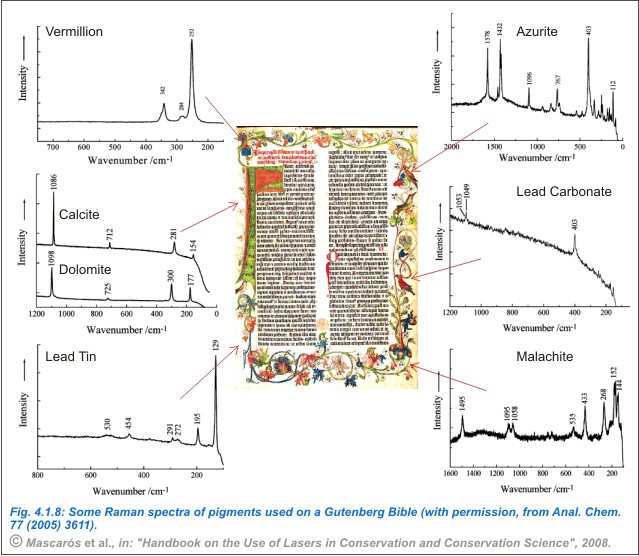
This is a page from the Gutenberg Bible (original one at that!) This was accomplished using a variation of ATR (Attenuated Total Reflection,) is a sampling technique used in conjunction with infrared spectroscopy which enables samples to be examined directly in the solid or liquid state without further preparation.
![]()
Characterization of Mummified Tissues
![]()
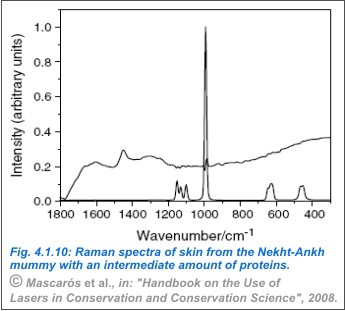
In this work, the authors examined whether NIR-FT-Raman spectroscopy could be employed to determine to what extent human remains have been preserved, which have been subjected to artificial mummification. In addition, the purpose was to shed light on the methods and complex mummification techniques used by ancient Egyptians. Raman microscopic studies of human skin from the XIIth dynasty mummy, Nekht-Ankh, ca. 2100 BC, from the ‘Tomb of the Two Brothers’ (Khnum-Nakht and Nekht-Ankh) from Rifeh in Middle Egypt (Fig. 4.1.9), excavated from a hot desert environment, was carried out. The mummies were embalmed by natron, which absorbs water and is also mildly antiseptic, in the way used by ancient Egyptians.
Kind of eerie huh? Just look at the data below:
![]()
The amide I and III protein Raman bands were used to monitor the presence of proteins and to give an idea about the secondary protein structure. The lipids and proteins seemed well preserved, although different degrees of protein deterioration were observed. In some spots, protein degradation was extensive. Some sites showed very well-preserved protein secondary structures with both helical and sheet contents, associated protein modes at 1660, 1450, and 1240 cm-1 (Fig. 4.1.10) indicating that the artificial mummification process had a positive effect although no embalming chemicals were left in those spots. Of significant interest is that the presence of residual chemicals in the skin tissues (Na2SO4 from the NATRON desiccant used in the mummification process), is correlated with the presence of the most degraded organic tissue and hence the most poorly preserved skin structure (Figs. 4.1.11, 4.1.10 and 4.1.11 with permission of J. Raman Spectrosc. 34 (2003) 375).
So, to bring us back around home, yes, these techniques are very precise and require an extensive working knowledge, I learned it in two years, and I had never done this before, just having the aptitude and desire helped me achieve my results so far.
The prevailing goal of this project is in removing the mysteries surrounding this type of science and sciences akin to it, providing an easier and more accessible gateway for developing counties to continue along a path of greater technological progress. This can certainly be achieved through free educational pathways like my website and this project's ideals, yeah sounds lofty I know, but I’m doing it, I’m making the connections, the interpersonal ones that matter, like the examples I talked about in the beginning of this article.
It’s now just a matter of putting the pieces of this project together, testing and calibrating and then releasing all my data, it’s beautiful to me, and I do it all for free. I took it upon myself to just do it, I was going to do one thing in my life that made a difference, big or small, but it was going to make that difference.
This was an original article I wrote at my blog website on 7/20/2017 and thought it more appropriately suited to this project...Kinda like destiny.
My Research and The Science of a Stroke
**Note: I am on log book # 4 now :)
-
Design Change: Replaced Flat mirror W/ 01" Concave Focusing Mirror
02/05/2018 at 08:14 • 0 commentsUpdated 02/05/2018 3:16:AM
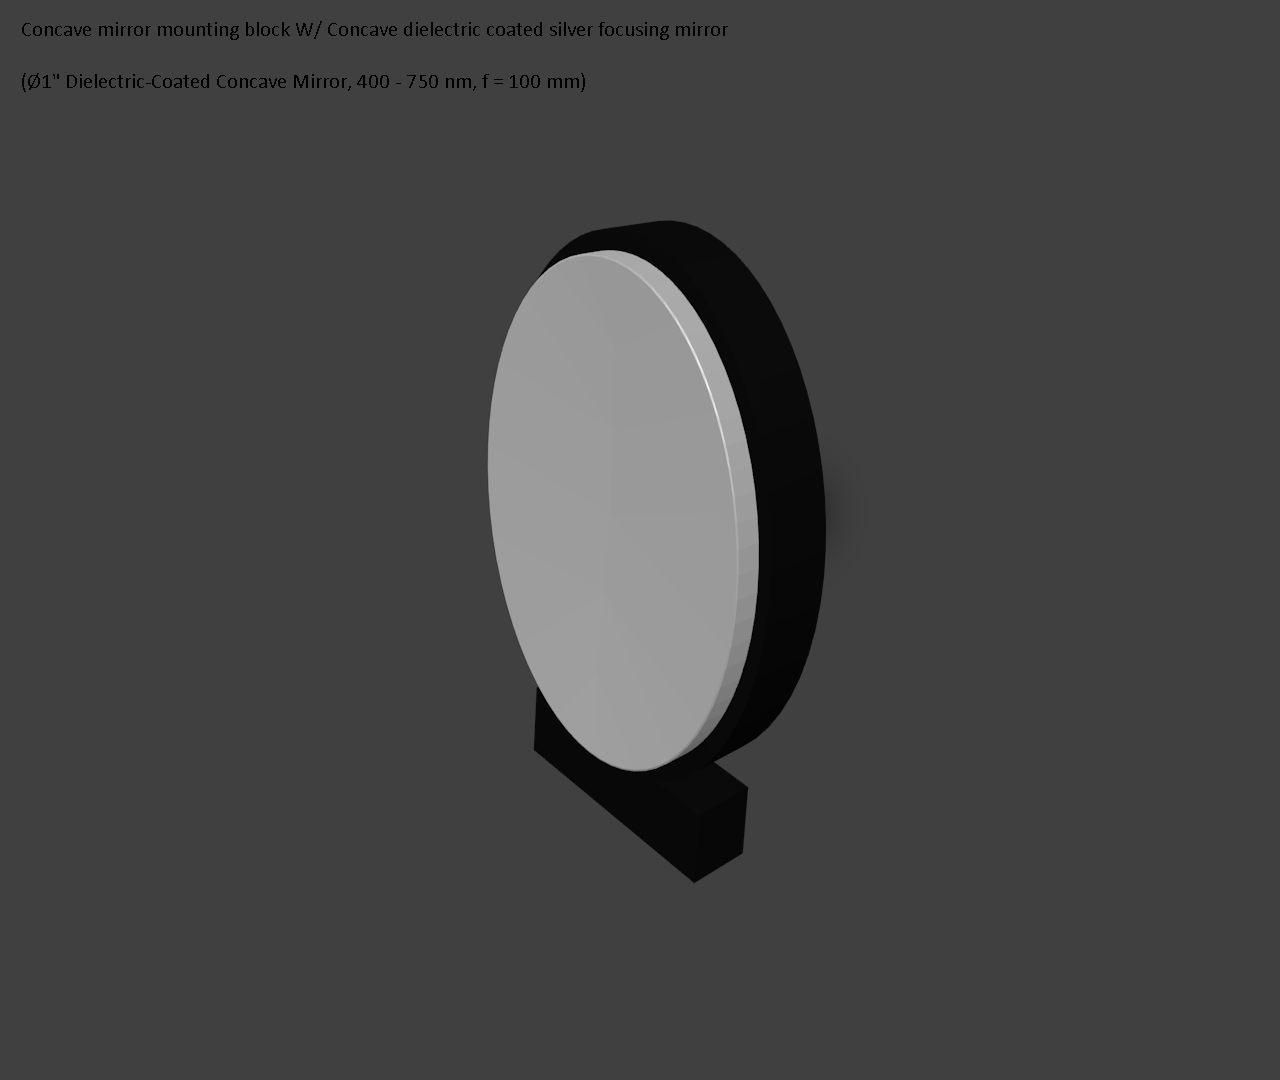
Replaced the flat silver coated reflective mirror and mirror mounting block W/
Ø1" Dielectric-Coated Concave Mirror, 400 - 750 nm, f = 100 mm, a detailed explaination of why is in the build instructions.
![]()
![]()
-
BOM for The 3D Printed Raman Probe V 0.1.0C
02/02/2018 at 17:26 • 0 commentsThis is the complete bill of materials for the Raman probe, hardware included. The 3D material used for my project is Nylon PA12, since I do not have a 3d printer myself, I have to source my parts out to Sculpteo, but you can use any material you want, just keep in mind that I use Netgen tessellation (very fine,) which gives me a tolerance of 0.1mm.
![]()
3D Printable Raman Probe
This a 100% 3D printed Transmission Raman Probe (low resolution) W/built-in cuvette holder/Raman filter