-
Lost Signal
05/03/2016 at 14:42 • 0 commentsSince it's been 9 months since my last log entry, I should probably close out this project. I've looked a little at parsing the data from the GPS, but I've come across some other projects that I think would be more useful or interesting at the moment. So, for now I'll put this project on hold. Perhaps I'll return to it in the future. Regardless, I did learn quite a bit about the OLED displays and the libraries to use them as well as some basics of setting up the development environment.
-
SPI, logically
08/05/2015 at 18:58 • 0 commentsI looked at the transfers to the SPI OLED display today. It took me a little while to get my fx2lafw logic analzyer to work properly for this. On Windows, using a nightly build of Pulseview from sometime in May, I couldn't capture faster than about 3 MHz. I tried the same logic analyzer on the same laptop under Ubuntu, and things ran fine. Downloading the latest nightly build of Pulseview for Windows, it fixed the problem of capture rates, but introduced a new problem where it doesn't show me any more than about 10 ms of data (20 M samples at 16 MHz should be over 1 s worth). So I captured the trace in Ubuntu and saved it to a file, and then loaded into Pulseview in Windows. I could have just stayed in Ubuntu to analyze it, but I'm more familiar with the photo tools I use for the screen captures in Windows.
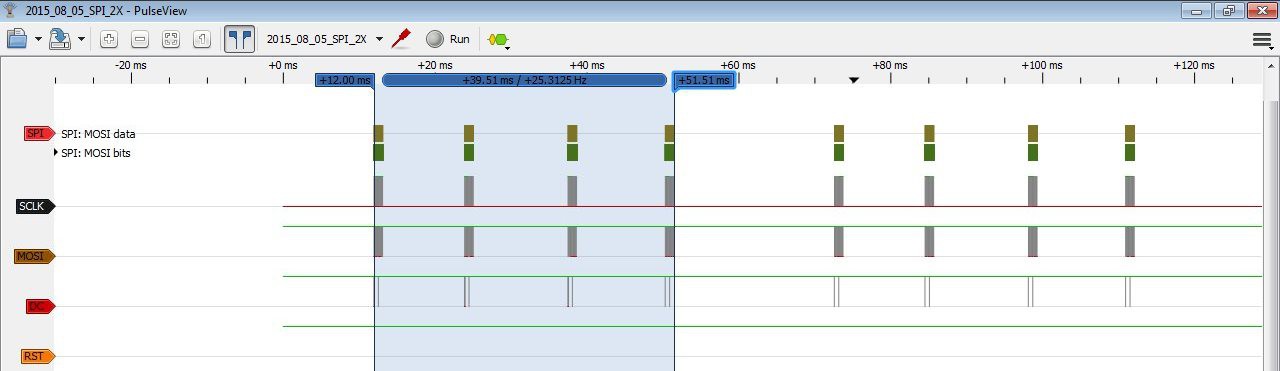
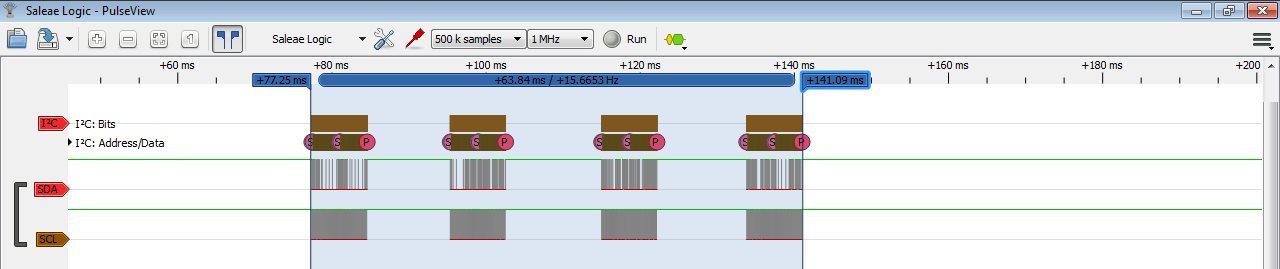
Here's the overall transfer. In this image you can see two complete transfers, each transfer consisting of 4 pages sent to the display. The time for the update is 39.51 ms, which compares favorably to the 43.8 ms I got using the timer.
![]()
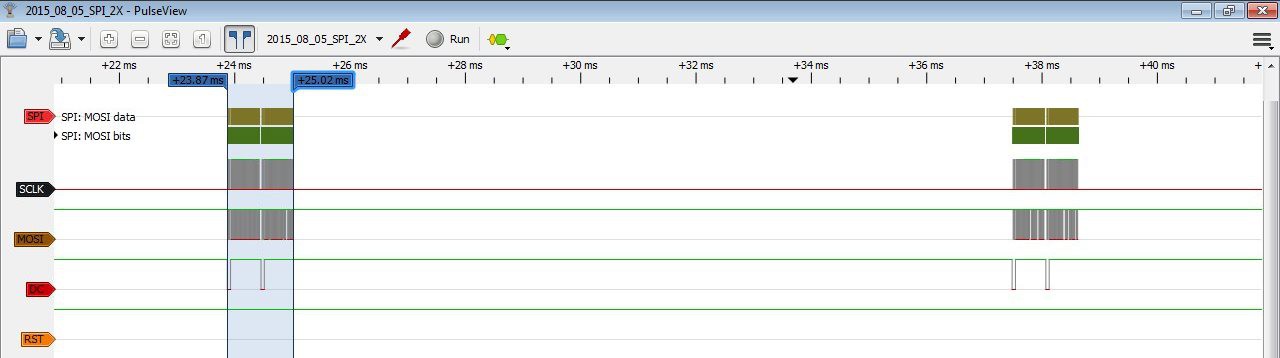
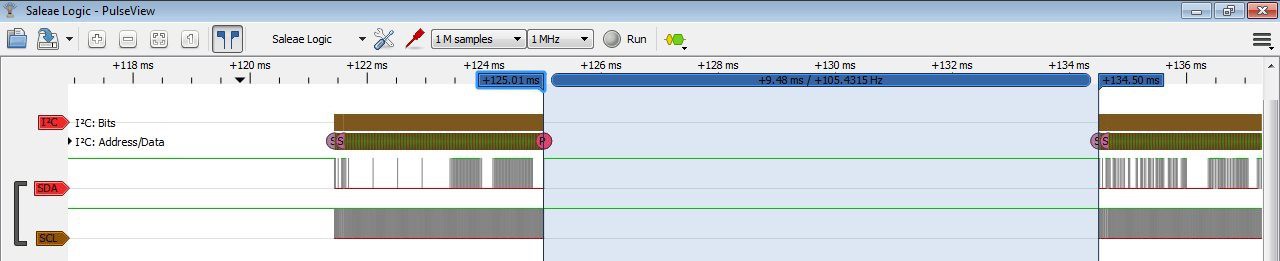
The time between page transfers is about 12.45 ms. This is the draw time. This compares with 9.48 ms using the IIC display. So it seems that the SPI display must take a little longer to ready the transfer, since we're drawing the same thing?
![]()
The actual transfer time is shown below. Subtracting the two times, we get 1.15 ms. This compares to 3.57 ms per 2x size page transfer using IIC.
![]()
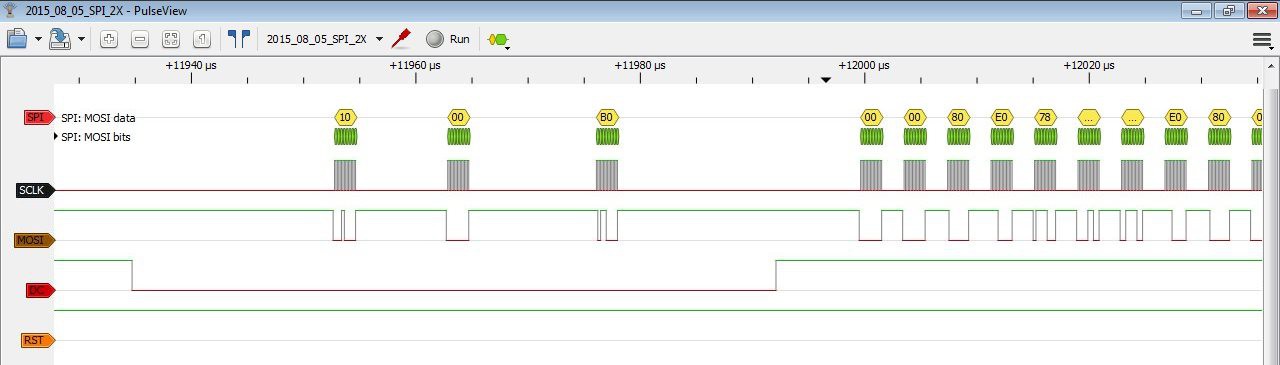
Here you can see what a page transfer looks like. Note that it's split into two parts. You can see the DC line go low for the first 3 bytes in each half.
![]()
Here's what the command transfer bytes look like. There are 8 sets of these per update, 2 per page. the 0x10 and 0x00 stay the same, the 0xB0 increments to 0xB1, 0xB2, etc. I'm guessing this is a page or offset counter for the display?
![]()
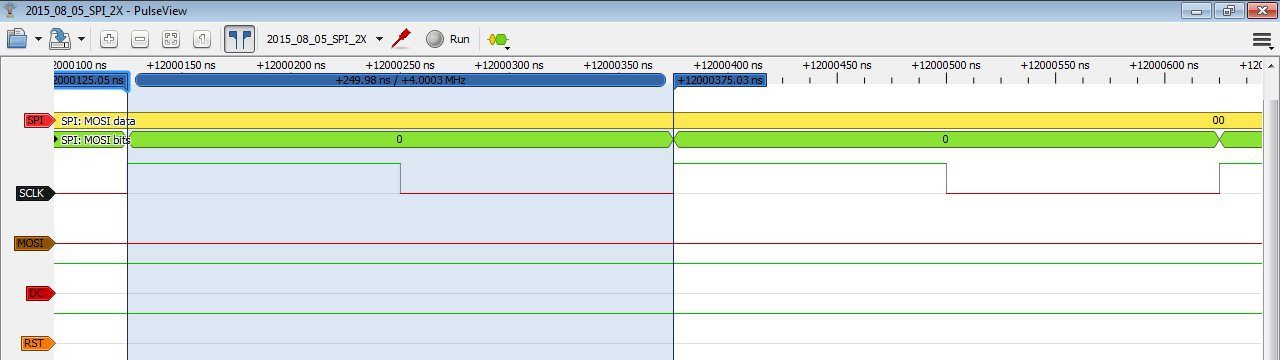
Here's the clock, you can see it's running at 4MHz. It's interesting that even though the clock is now 10x faster than IIC, it is only about 3x faster for a page transfer. The time between bytes for SPI is a larger percentage than that for IIC. This makes sense, since the time the processor takes to load the next byte for transfer is probably about the same, but since the SPI clock is faster a larger percentage of the time is now taken for loading the next byte.
![]()
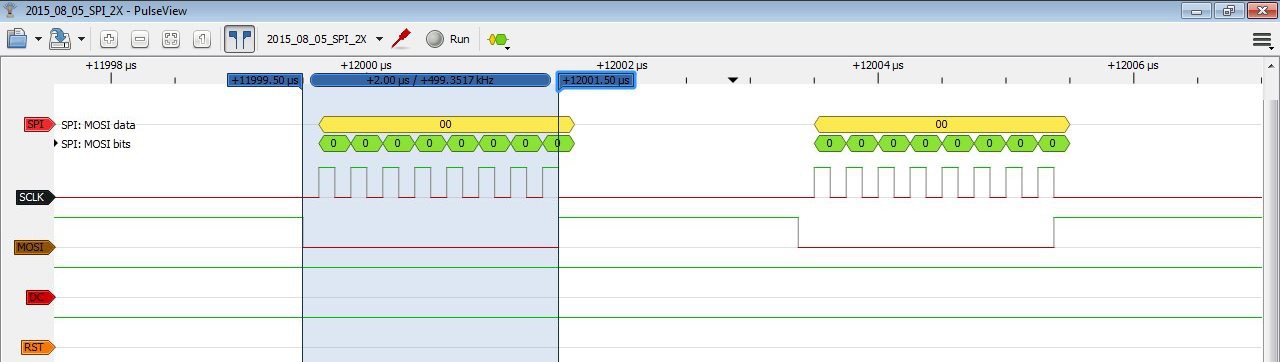
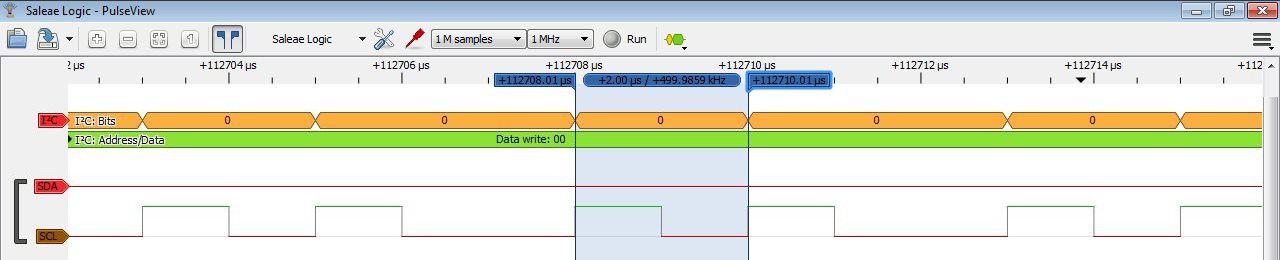
Here's the time is takes to transfer one byte. This 2 us is indeed 10x faster than the 20 us it takes for a byte transfer using the 400 kHz IIC.
![]()
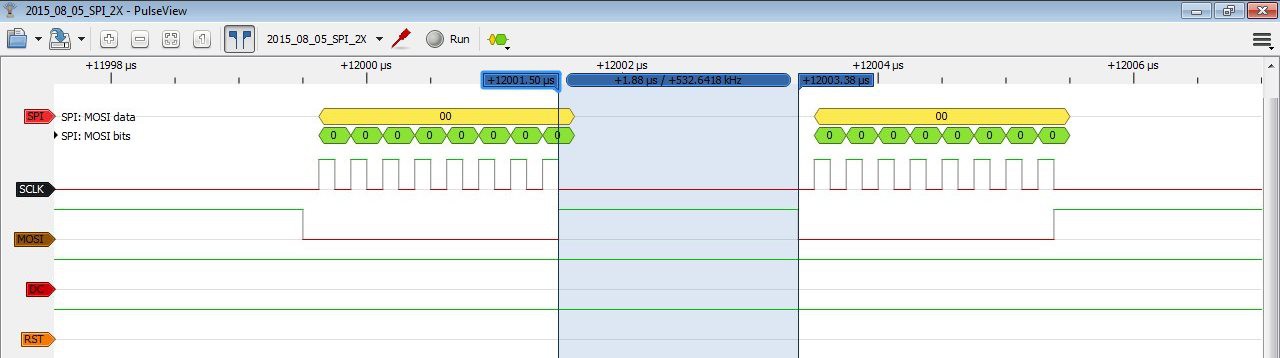
Time to load the next byte for transfer is 1.88 us. I didn't measure how long this took with the IIC display, looking at the photos it appears to be 4 to 5 us. I had kind of expected this to be the same, but there might be a larger delay when starting the IIC hardware?
![]()
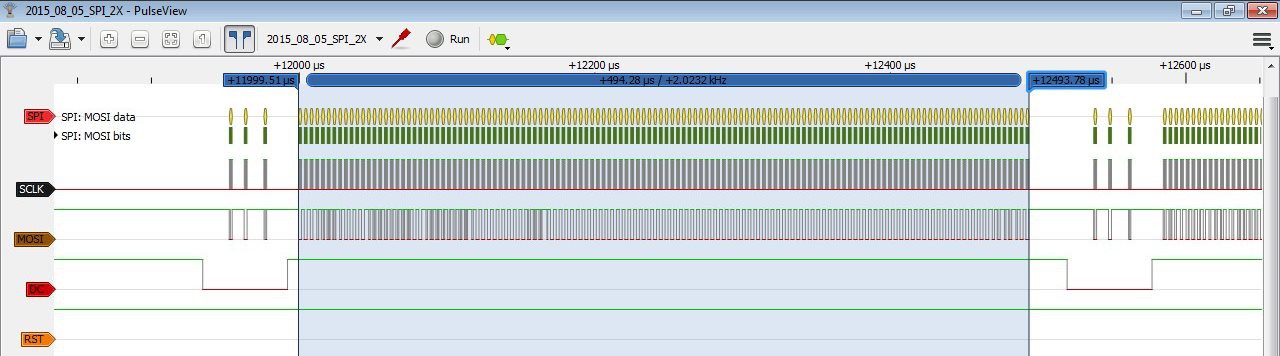
Here's the transfer of one part of a page transfer. The time is 494.28 us. From the above, a byte load and transfer takes about 3.88 us. Dividing by that, it works out to around 128, which is reasonable since the 2x page size is 256, so half that is 128.
![]()
So, here's the final results. Using the IIC OLED display with the 2x page size, an update takes 86.8 ms. Using the SPI display and a 2x page size, it's 43.8. So about half the time using the SPI display. I'm planning on using the SPI displays. Since I would potentially like to use two displays (one for the cruise control stuff, the other for time and perhaps OBDII information), the lack of the CS line makes it a little more difficult. I may just order another set of displays for this project that have a CS line brought out to a pin.
I think I've done most everything I can to analyze the times taken for a display update. Now I'll start on parsing the binary data from the GPS 18x.
-
Do you speak SPI?
07/31/2015 at 19:32 • 0 commentsI received the OLED displays with the SPI interface and I wanted to see how long the display update took with these.
First, I had to figure out how to connect these new displays. Mine have D0, D1, RST, and DC (in addition to supply and ground). For a complete SPI interface, I should also have a CS (chip select) line. I finally found this discussion that gave me some clues as to how to hook it up. The CS line on my display is always asserted (low?). D0 is the clock, D1 is MOSI, DC is a data/control line that has something to do with the hardware SPI controller on the AVR not being able to handle 9 bits (I think), and the RST line is the reset line. D0 (SCL) is connected to PB5 (Arduino pin 13), D1 (MOSI) is connected to PB3 (Arduino pin 11), and then I chose to connect DC to PB0 (Arduino pin 8) and RST to PB1 (Arduino pin 9).
After figuring out that the PN( x, x) macro for the u8glib uses 1 for port B (for some reason I was using 2), it worked. Looked pretty much the same as the IIC display. The timing value for the update was 2737, this was for the 2x page size. This works out to 43.8 ms. I need to see what the clock speed is, I don't know if there's something similar to the 'fast' option that I used for IIC.
The lack of a CS line would be detrimental if I try to use 2 displays. I may be able to connect to the board to control a CS line. If not, perhaps I can switch the clock signal (if that is sufficient?) between the two displays.
-
A little logic
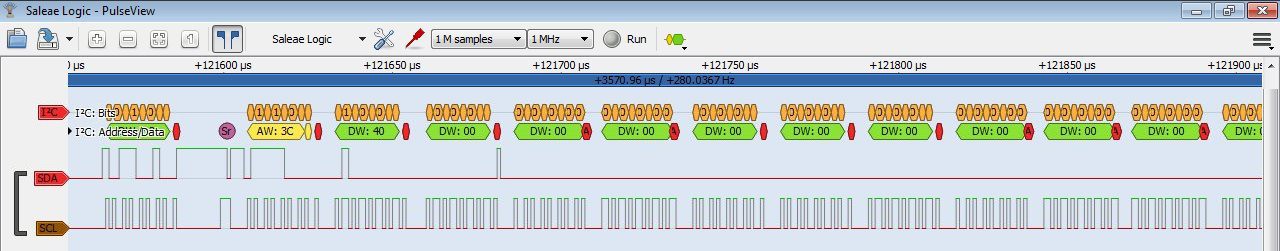
07/24/2015 at 20:40 • 0 commentsToday I had a chance to use the logic analyzer to capture the IIC data transfers at the 400 kHz rate. This showed why my previous estimates of the improved timing were off. In the estimate I made, I was using the shortest drawing time and figuring that across the 8 draws. The first one is the shortest, the second one is the second shortest, and then all the rest are about the same time. That time is 9.48 ms, as seen below.
![]()
If all of the draw times were that long, there would be 75.84 ms spent drawing. In the current case, it's a little shorter because the first two draw times are shorter.
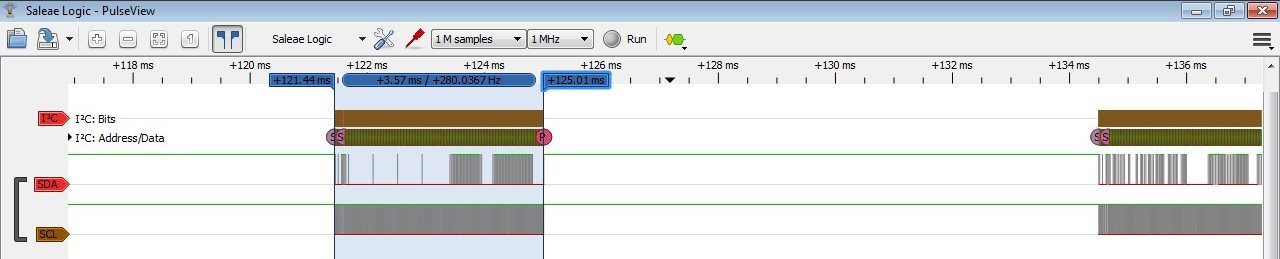
You can see below that the transfer time is significantly faster, 3.57 ms compared to 12.75 ms at the 100 kHz speed.
![]()
The clock was interesting to look at. The clock isn't quite as regular as it was at 100 kHz. This image shows the variations between cycles. You can also see that time between bits where the AVR is loading the next byte is a more significant time. At 100 kHz, it was about 2 cycles. Here it seems to be about 4.
![]()
In the photo below, you can see that the clock is held low a little longer in some spots. If I measure a 'shorter' cycle, it's equivalent to 500 kHz.
![]()
I think this is clock stretching, where the display is holding the clock line low until it's ready to receive the next bit.
But it also happens during the high part of the clock, as seen below. I think this must be the AVR loading the next bit. This image also shows the time for a complete transfer, which when divided by four works out to almost 400 kHz. So even though the low or high period may be stretched, it seems that it's made up for during the opposite part of the cycle.
![]()
I also switched to a 256 byte page size to see how that timing worked out. It took 4244 counts, again with the 1/256 divider. that works out to 67.9 ms. that agrees pretty well with the measurement of the capture below.
![]()
So, the fastest I can draw the display, with a 256 page size, is 67.9 ms. I'm interested to see how the timing is different with the SPI displays. While there's a few bytes overhead when transferring the data because of the address byte, it's a negligible amount of time. I think any improvements would come from a faster clock.
I also had a chance to take a quick look at the data from the GPS 18x. It has a binary mode, which I think I'm going to use. This will make parsing the data faster and easier than the text based NMEA mode. However, from what I can determine, there's not just one speed, there's lat speed, long speed, and altitude speed. So I would need to compute an 'actual' speed from those. I think the altitude speed can be left out of that, as it will be very small compared to the other two.
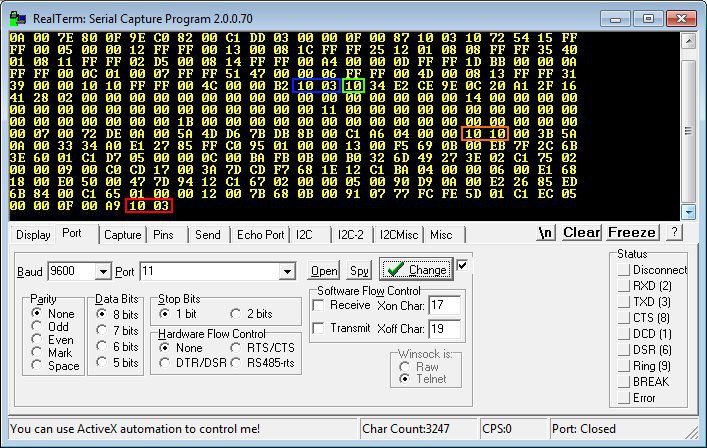
The image below shows the data sent out. One data transfer starts with the 10 squared in green. The '10 03' squared before that is the end of the last transmission (always ends with a '10 03'). If there is a '10' that is sent as part of the data, it is escaped with another '10' first, as seen in the orange rectangle. The end of that transmission is the red squared '10 03'.
![]()
Next step, to figure out what that data actually means and how to process it. Fortunately, the GPS 18x details what the data means.
-
Faster, faster
07/24/2015 at 02:53 • 0 commentsI built the project using the U8G_I2C_OPT_FAST option. It is faster now, although not as fast as I thought it would be. With a 128 byte page size, the timer count (using the 1/256 divider) was 5427, which works out to 86.8 msec. So roughly twice as fast as before, but not 4 times. I'll need to hook up the logic analyzer and see what's happening with the signals.
-
How fast?
07/23/2015 at 19:53 • 0 commentsLast time I found that it took about 159 ms to update the display. I have ordered 2 new displays with an SPI interface, they'll hopefully show up in a few weeks.
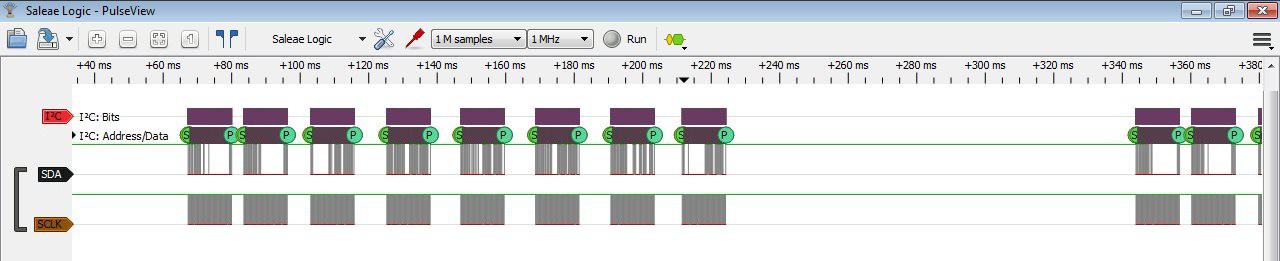
I wanted to take a look at the actual signals going to the display to see if there was any unneeded delays or inefficiencies. So I pulled out my trusty fx2lafw logic analyzer (also known as a Saleae Logic clone). Running this with the PulseView Windows program from the sigrok project, I used the I2C protocol decoder to easily see the data that was being sent across the IIC bus.
![]()
I looked at the data sheet for the ssd1306 controller that is on this board. I kept getting tripped up by its description of the Co bit of the control byte:
"If the Co bit is set as logic “0”, the transmission of the following information will contain
data bytes only."This seemed to somewhat duplicate the function of the D/C# bit:
"The D/C# bit determines the next data byte is acted as a command or a data."
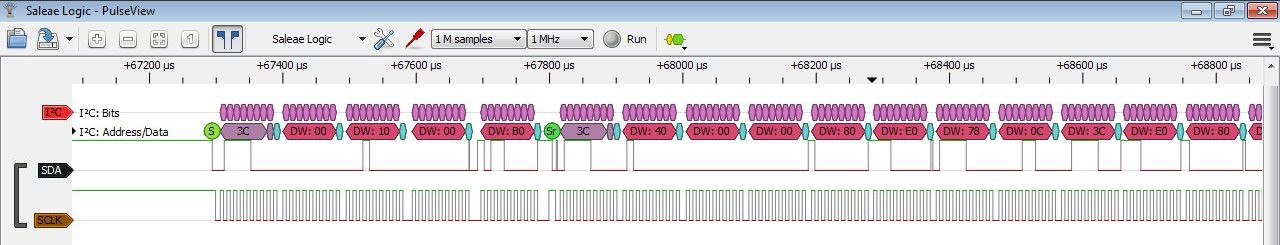
Reading this page, the author clearly talks about the Co bit as being a continuation bit, which is what the bit is described as at the top of Figure 8-7 in the data sheet. That seemed to make more sense. So first the device address is sent (0x3C), and then the control byte indicates that the following bytes will be a stream of commands. Those commands basically set the writing to begin at the start of the display memory. In the next transfer, the device address is again sent, but then the control byte indicates that it will be data that is following. Then there's a long stream of data bytes.
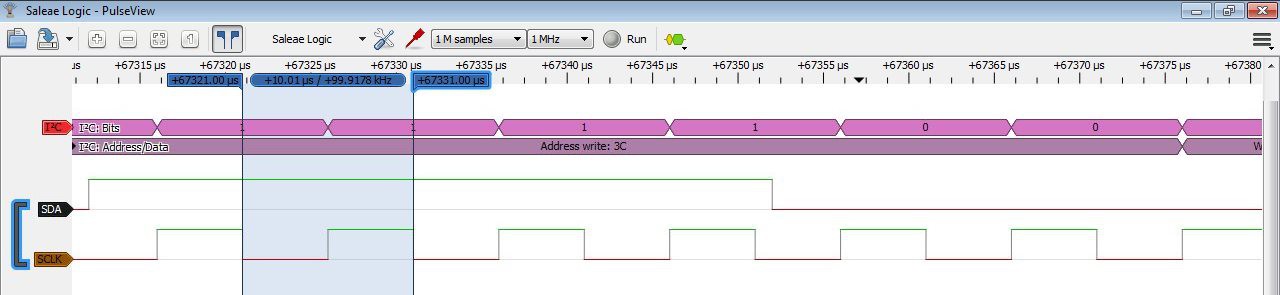
This view is zoomed out. The first image is zoomed into the start of one![]()
of these transfers. Since we have a page size of 1/8 the display size,
there are 8 transfers.
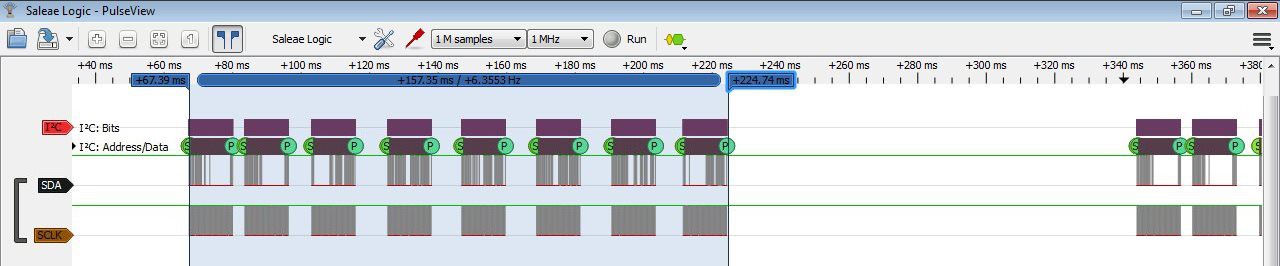
The timing of the 8 transfers is 157.35 ms. Considering that this timing doesn't take into account the drawing for the first page (since that happens before the first transfer), they seem to agree pretty well.![]()
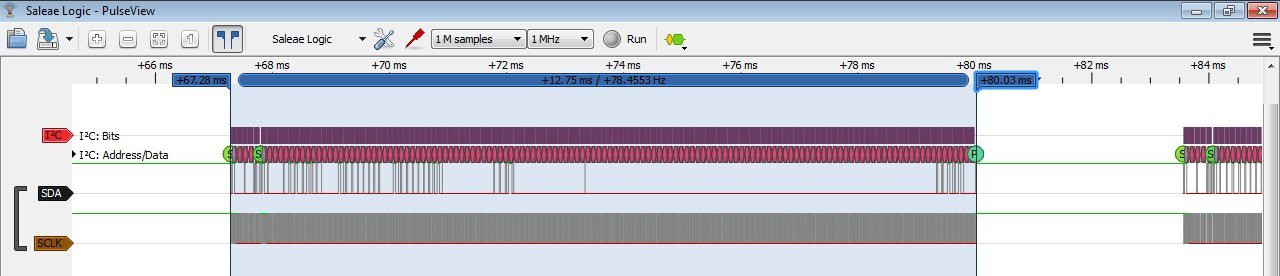
This image shows the time it takes for the data transfer: 12.75 ms.![]()
This image shows the time between the transfers, what is mostly the drawing time: 3.57 ms. So it takes about 3.4 times as long to transfer the page as it does to draw it.![]()
![]() This final image holds the key to the slow performance, though. The time/frequency shown is that of the data clock, which is only 100 kHz. I don't know why I initially thought the transfers were at 400 kHz. That clearly is not the case. And looking at the u8glib code, it clearly chooses a clock frequency of 100 kHz if the U8G_I2C_OPT_FAST option is not passed. So, the next step is to rebuild the code using the U8G_I2C_OPT_FAST option and see how it does. That will have to wait until next time.
This final image holds the key to the slow performance, though. The time/frequency shown is that of the data clock, which is only 100 kHz. I don't know why I initially thought the transfers were at 400 kHz. That clearly is not the case. And looking at the u8glib code, it clearly chooses a clock frequency of 100 kHz if the U8G_I2C_OPT_FAST option is not passed. So, the next step is to rebuild the code using the U8G_I2C_OPT_FAST option and see how it does. That will have to wait until next time.
Currently, the transfer time it 8*12.75 ms = 102 ms. The drawing time shouldn't decrease, but that transfer time should. Moving to the 400 kHz clock should drop it to 102 ms/4 =25.5 ms. Combined with a combined drawing time of 8*3.57 ms = 28.56 ms, that should be a total of 54.06 ms for the update. -
Timed
07/10/2015 at 18:50 • 0 commentsToday I got some timings of how long it takes to refresh the display with both different buffer sizes and different things displayed.
Displaying the large '65' in the u8g_font_fub42n (as shown previously):
Page Size Timer counts time (msec) 128 bytes 35698 142.8 256 bytes 32137 128.5 I then changed to displaying a small 11 pixel '65' using the u8g_font_fur11:
Page Size Timer Countrs time (msec) 128 bytes 26186 104.7 256 bytes 25931 103.7 Finally, I mocked up the display to be like the one shown at the top of this project's page. I was concerned that perhaps the timer might wrap around, so I changed the division to 1/256 (thus the lower timer counts):
Page Size Timer Counts time (msec) 128 bytes 9990 159 256 bytes 8808 140 The time varies quite a bit between displaying small graphics and large graphics. There wasn't as much change between the large 65 and the full mockup as I had expected. The page size has some effect, but not a lot (compared to the total time, or even the time differences between small graphics and large).
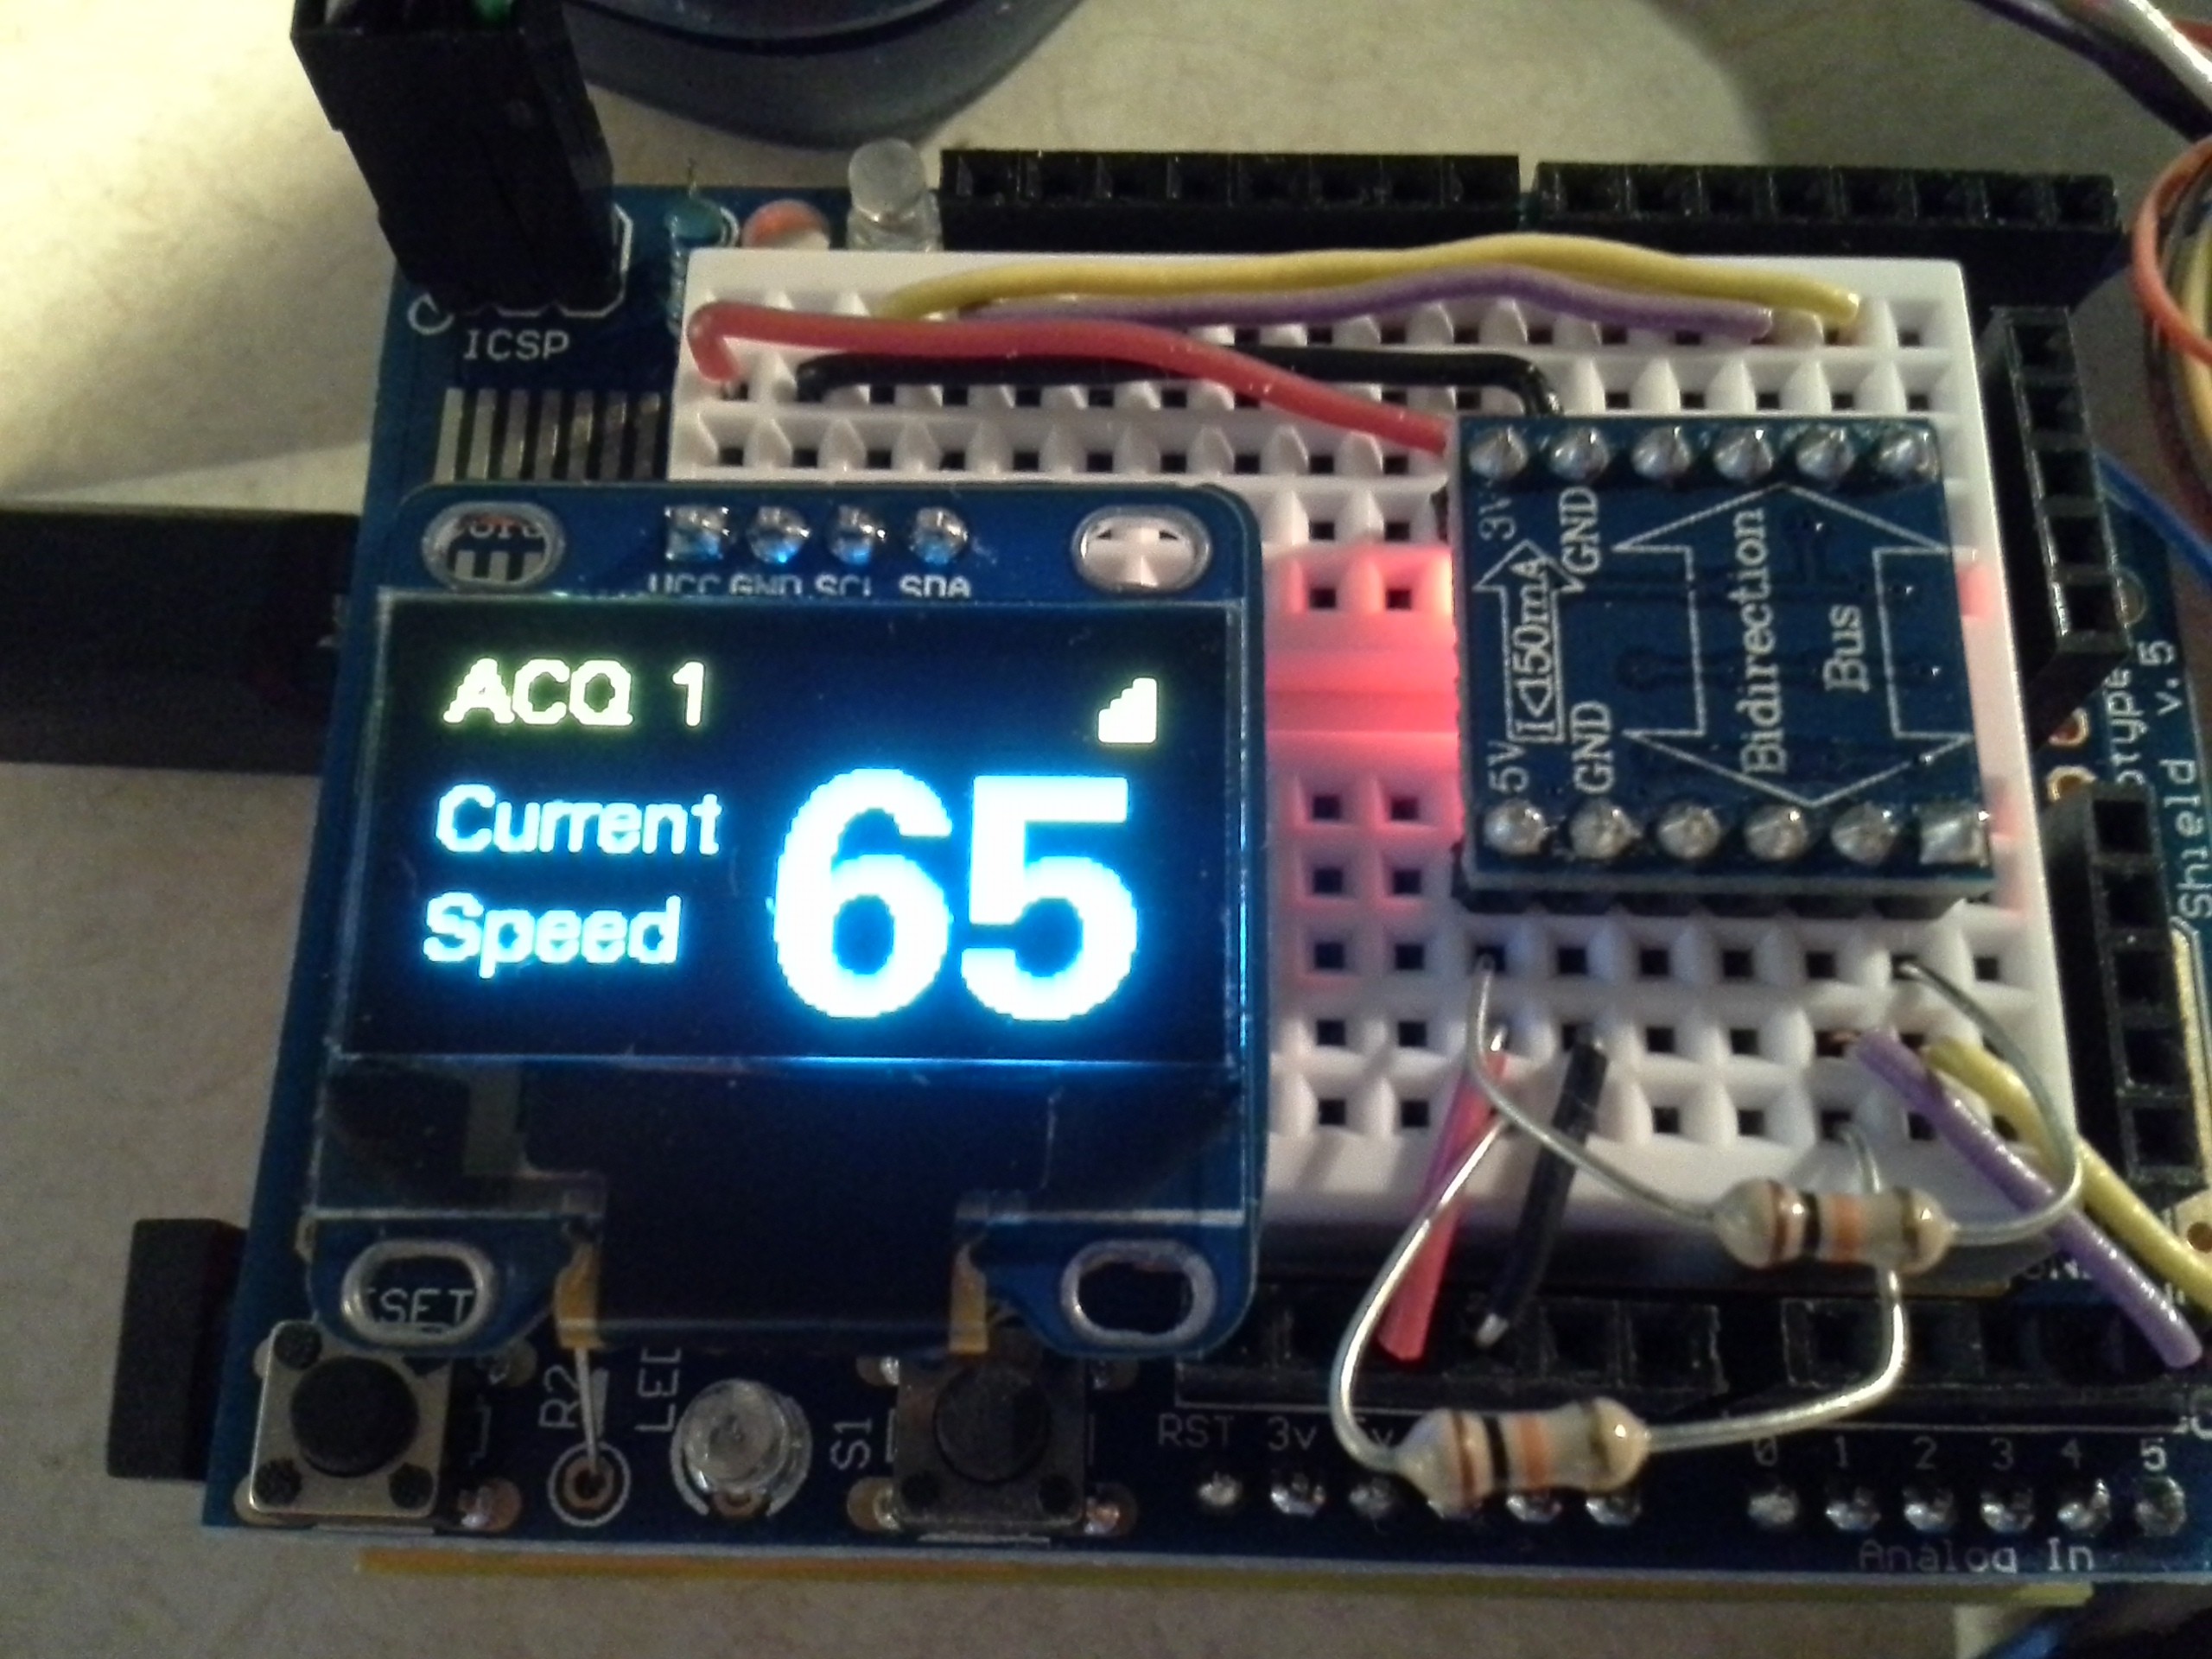
Here's what the full display mockup looked like. It was neat to actually see it on the screen on not just on the PC.
![]()
You can't see it in this photo, but the right 2 bars on the signal strength icon were hollow.
I might order the SPI version of this display and see how the timings fare with that interface. That will take a few weeks to arrive, so next I'll probably start on parsing the GPS data.
-
Ready, set, go!
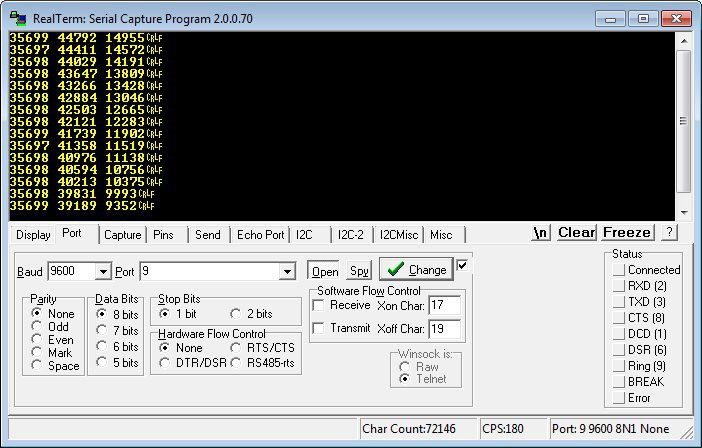
07/09/2015 at 18:42 • 0 commentsI played with the timer registers to change the clock speed and verified that the output pin was toggling at the rate I'd expect. So then it was time to use this to time the display update. When I previously mentioned that I was using Timer0, this was incorrect. I was using Timer1, the 16 bit timer. For timing, I grabbed the timer count before the display loop and then grabbed it again at the end. Subtracting these, I came up with the elapsed counts that the display loop took. I sent this out the serial port. I also inserted a 100 ms delay between updates so that I wouldn't overrun things. Here's a screenshot of the data I received:
![]()
The first number is the elapsed count, the second number is the starting count and the third is the ending count. I was at first having some difficultly getting the AVR to do math right,. When it subtracted the the start from the end the result was always the same as the end value. ??? I looked into that a bit, and then it started working. I'm not sure what I did differently.
Anyway, the clock speed is 16 MHz. The above timings were with the clock select bits set to 1/64. So 16,000,000/64 = 250,000 Hz, which is 4 microseconds per cycle. 0.000004 * 35698 = 142.8 milliseconds. That's kind of a long time. I verified that the counter wasn't wrapping around in 2 ways. First, I logged the data into RealTerm, appending a timestamp. The values came in about every 1/4 second. Subtracting the 100 ms delay, that works out to close to 142 ms. Second, I changed the divider to 1/256. At this speed it would take a little over a second to wrap the 16 bit counter, and I was definitely getting my data at faster than once a second.
So 143 ms it is. That's pretty slow. About 7 times per second if that's all I'm doing. But I also need to be receiving data from the GPS, reading the control inputs, and perhaps managing an acceleration or deceleration. Since my cruise control needs 1-2 seconds between button presses, that shouldn't need much processing time or a quick response rate. I'm not sure how long parsing the GPS data will take. I'll need to set up an ISR to read the serial port and place the data in a buffer, but that's probably a good thing to do anyways. And if I can set up interrupts for the control pins, I should be okay.
But this does suggest that I could go another route. I could have one AVR control the display, and another to parse the GPS data and handle the control inputs. I do have a little concern of the length of wire I'll need if I use just one. I want the display to be up in my rearview mirror. But the controls will be down between the two front seats. There's probably at least a 10 ft run between those two. Will electrical noise interfere with the signals from the rotary encoder? I'm pretty sure I couldn't get away with putting the OLED display at the end of a 10 ft long wire and get IIC to work.
While I think through those things, I'm going to move on to parsing the GPS data.
-
Timing
06/15/2015 at 19:56 • 0 commentsOkay, I know I said "Next up, doing something other than trying to display '65'." That wasn't what was next.
First up, I worked with using the CH340 serial to USB chip that is on my VISduino to talk to RealTerm on my PC. I was succesffully able to transmit "Hello World", so now I'm ready to send an diagnostic information over it.
Then, after watching this video, I got to wondering how long my display loop was actually taking. So I started off on a journey to figure that out. I also did manage to read through the u8glib documentation, which explained why the RAM usage for u8glib was smaller than the adafruit library. The u8glib can be configured for different page sizes. This is what the whole 'picture loop' is about. If your page size is less than the size of the display, then the loop makes it draw things more than once but sets the display boundaries to cover a new part of the display. This increases the time to draw the display ( since you've got to draw everything more than once ), but divides the memory requirements by the number of pages you're drawing. A 128x64 monochrome display takes (128x64/8) = 1024 bytes in RAM. My code is using the 128 byte page size, so it runs through the loop 8 times.
I suspect that the time that the actual drawing takes is pretty small. The most time is likely spent transferring things over IIC. With the bus running at 400 kHz, it takes at least (1024*8/400000) = 0.02048 ms to transfer one 'display'. Since there's no DMA on the AVR, the processor sits there waiting to place each byte into the transmit register.
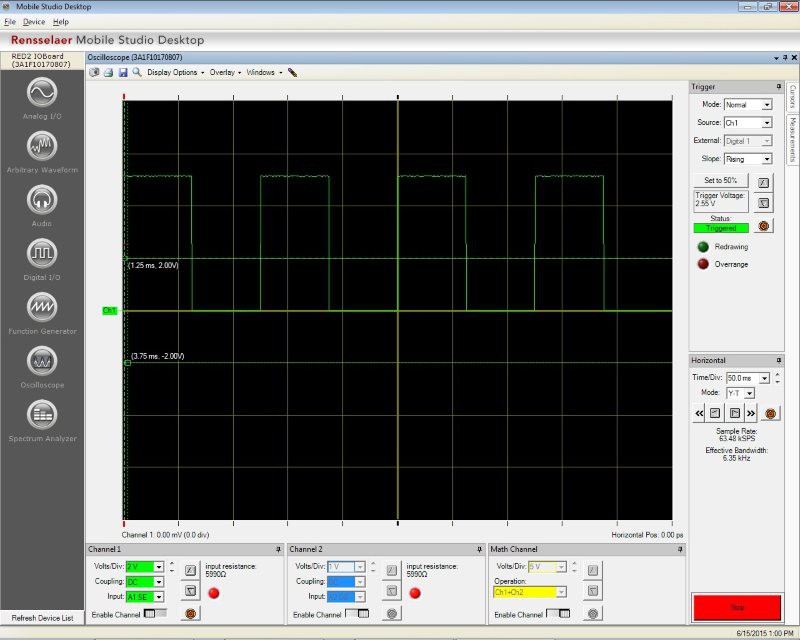
So, how long does it take my code to run? I don't know yet. I got sidetracked into the timers, then my wife had our 5th child, so I'm just now getting back to it. I did, however, manage to get Timer0 to toggle an output pin. This also gave me a chance to use the nifty Mobile Studio IOBoard to view the waveform. This is the first time I've had a chance to use the board for something real, and it was nice to see that it worked. Although viewing an 8 Hz waveform isn't taxing it. :)
![]()
Next up, I want to play with the timer registers and prescalers to get the timer frequency to be in a useful range for measuring the time it takes to display a page. Toggling the pin isn't needed for that timing, but it's a good way to verify that the various prescalers are ending up with a value that I think they should end up with.
-
Back where I started
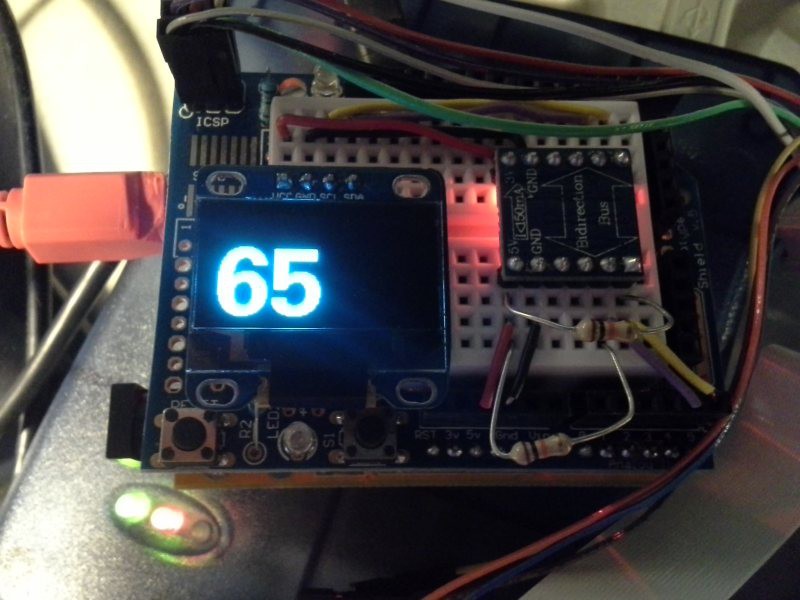
05/15/2015 at 19:19 • 0 commentsI made the quick changes to display '65' on the display and programmed that up. Looks pretty much like what it did when I was using the Arduino IDE:
![]()
Ah, but now it's being built and programmed in Atmel Studio! :)
I spent a little time looking at the GPS parsing. I did find this project that is a library for parsing the NMEA sentences the GPS spits out. I might end up rewriting it in C, but it seems like it would work well. The use of floating point numbers bothers me a bit, I don't know if I will (or can) stick with those.
Next up, doing something other than trying to display '65'. :)
Cruise Control Preset
This project supplements the existing cruise control in a vehicle, allowing you to automatically set the cruise control to a selected speed.


 This final image holds the key to the slow performance, though. The time/frequency shown is that of the data clock, which is only 100 kHz. I don't know why I initially thought the transfers were at 400 kHz. That clearly is not the case. And looking at the u8glib code, it clearly chooses a clock frequency of 100 kHz if the U8G_I2C_OPT_FAST