 Jithin
-
1Step 1
The device will be available in packaged form, and users do not have to worry about soldering components onto PCBs.
However, for users wishing to overwrite the default firmware, and repurpose the board, please refer to the schematics.
-
2Step 2
SOFTWARE.
-> What Platforms are recommended?
The toolchain has been developed and tested on Ubuntu versions>=12.04 . It has also been tested on Raspbian Wheezy.
-> Installing the toolchain [ Debian packaging pending . I'm sorry you'll have to go through this]
Installing dependencies (Might be incomplete. Please send a PM about missing dependencies ):
sudo apt-get install python-qt4 python-opengl python-qt4-gl
python-sip python-scipy python-numpy ipython-qtconsole
python-setuptools
sudo easy_install pyqtgraphA) From Github ( *Recommended for now)
git clone https://github.com/jithinbp/vLabtool.git
cd vLabtool
sudo python setup.py install
B) From PyPIsudo easy_install vLabtool-------- The above steps install the Python module as well as several Apps that can be accessed directly from a shell.
Current list: vLabtool-scope, vLabtool-stream, and several others, all prepended with 'vLabtool' .* easy_install fails to install the permissions file 'proto.rules' to a custom location. In the absence of the rules file, the user will need to manually configure permissions for /dev/ttyACM devices, or run all apps as superuser. So running setup.py from a local copy of the software is recommended.
-
3Step 3
Testing the graphical apps first
open a shell (terminal, or ctrl-alt-t) , run the followingvLabtool-scope
This fires up the oscilloscope program which also includes the logic-analyzer, and several widgets to control voltage sources, waveform generators etc.Error?
Check the USB connection first.
If that fails, try running the app in super-user modesudo vLabtool-scopeIf the above succeeded, then it's a permissions issue. Please refer to the previous step, and install the toolchain from source [github step].
You may also manually copy the rules.proto file to /etc/rules.d/rules.proto, and restart udev.sudo udevadm control --reload-rules sudo udevadm triggerThe following video shows how to use the analog functions . * Clicking on the 'Digital Signals' tab will switch the application to Logic Analyzer mode, and you will need to return to the Analog Section for this demo.
For the digital section, select the peripherals tab, and click on the 'update' button. This sets a 500Hz, 50% PWM on SQ1,SQ2,SQ3,SQ4 . Connect these to the digital inputs (ID1, ID2 , ID3, ID4 ) , and check them out by clicking on the 'digital signals' tab. Right click and drag on the plot for zooming along a particular direction. Here's a demo video:
The 'EVERY EDGE' setting on the logic analyzer is not valid in multi-channel mode if the first signals on any of the channels rise within 200nS of start time, or the trigger signal. If this is the case, please select 'EVERY_RISING_EDGE' or 'EVERY_FALLING_EDGE' to verify the data.
-
4Step 4
Trying out a few commands from the Python library.
There's an app designed specifically for letting users quickly try a few odd commands from the library without having to write code which includes initialization routines, or plotting routines.
in a terminal, run:vLabtool-console
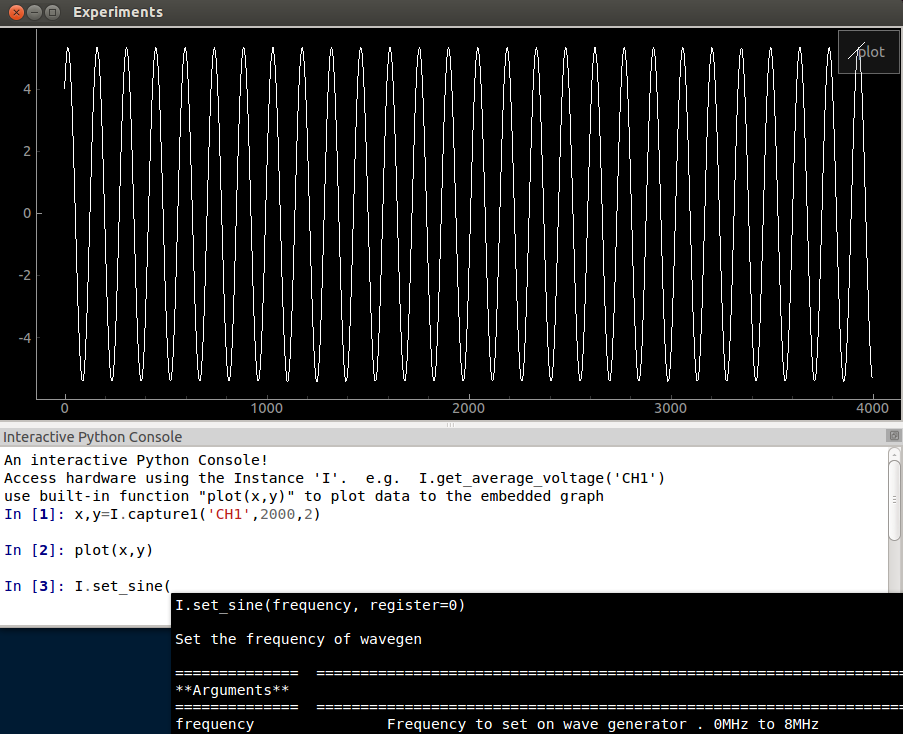
This will load a window like so,![]()
This is an embedded iPython console with an instance referring to your device already loaded.
iPython will autocomplete function calls on pressing the 'TAB' key, and will also display documentation when you open the first bracket
A graph has also been included in this App. It is an embedded PyQtGraph widget with one trace loaded. It has been linked to the iPython widget, and a call to 'plot' will plot datasets.
- Left click and drag to pan. Right click and drag to zoom along a particular direction.
If you have matplotlib installed, you could also tryfrom pylab import * %matplotlib inline plot(x,y)But the interactive PyQtGraph will be much more useful here.
-
5Step 5
Trying out the wireless nodes
Run the following command on a shell ( ensure all the nodes are turned off)
vLabtool-wirelessDemo
- Connect a supported I2C sensor breakout board to the node ( HMC588L, TSL2561, MPU6050 to name a few)
Match Vcc,GND,SCL,SDA of the sensors to the labelled pins on the node. - Turn on the nodes.
- Upon turning on the nodes, they transmit their address to any vLabtool that's listening. Yours is.You will find that their addresses are automatically loaded onto the demo app.
- Unselect 'Register new nodes' [ this is important so that your vLabtool does not keep listening for nodes that other users in the vicinity may be plugging in later ]
- Click on 'Refresh Node List'.
- This will add a row for each node, and each row will contain a pulldown menu with the addresses of the sensors.
- Select a sensor. Click on 'GO'
- Watch data being magically plotted.
- Try out parameter changing menus that will have been loaded with your sensor.
Here's a video. It's too fast, so please try and keep up till I replace it.
- Connect a supported I2C sensor breakout board to the node ( HMC588L, TSL2561, MPU6050 to name a few)
A Versatile Labtool
A cost effective, multi-pronged data acquisition tool to turn your computer into a workbench for science and electronics experiments.
Discussions
Become a Hackaday.io Member
Create an account to leave a comment. Already have an account? Log In.