-
The Dashboard
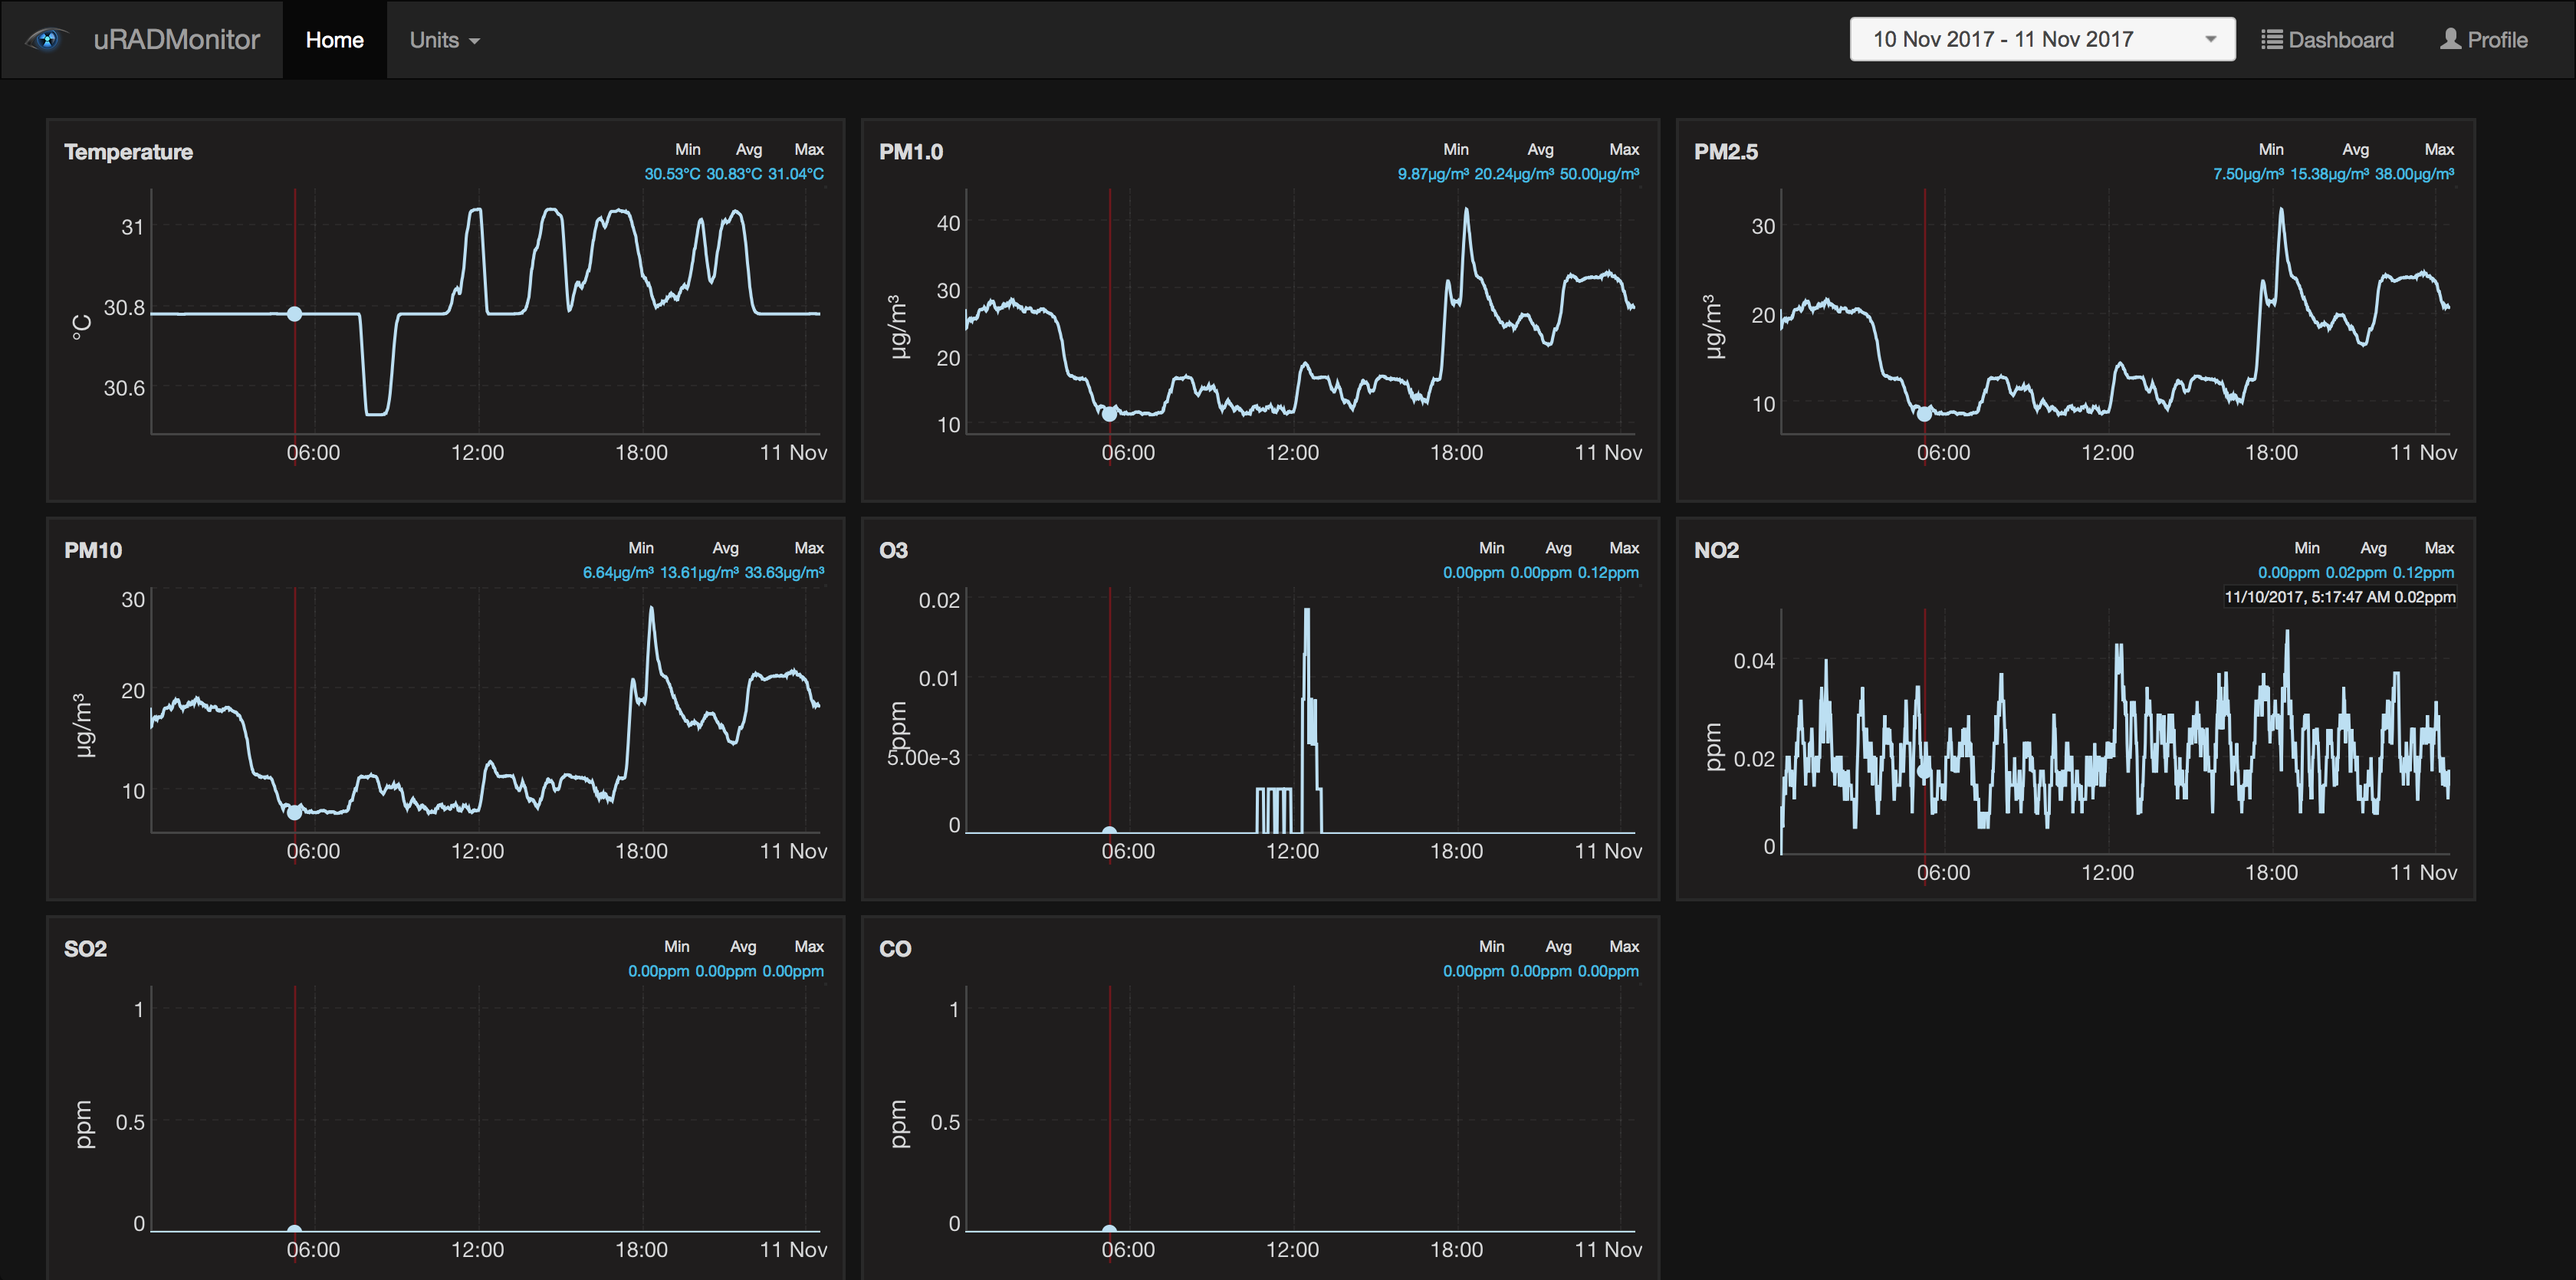
11/11/2017 at 09:52 • 0 commentsIt is still work in progress, but last time I was busy building a new dashboard for the CITY units, one that uses the existing API to iterate the available sensor streams, than plot them in a visually appealing form.
![]()
This dashboard shows all gases, as measured by the CITY hardware. The charts are dynamic and synchronised: You can zoom one and the rest will follow, to make it easy to check the data.
I also need to add some horizontal bars to indicate the legal limits for air quality. This way we'll understand the numbers easier.
More on www.uradmonitor.com/products
-
The sensor calibration parameters
05/14/2017 at 14:25 • 1 commentCalibrated sensors
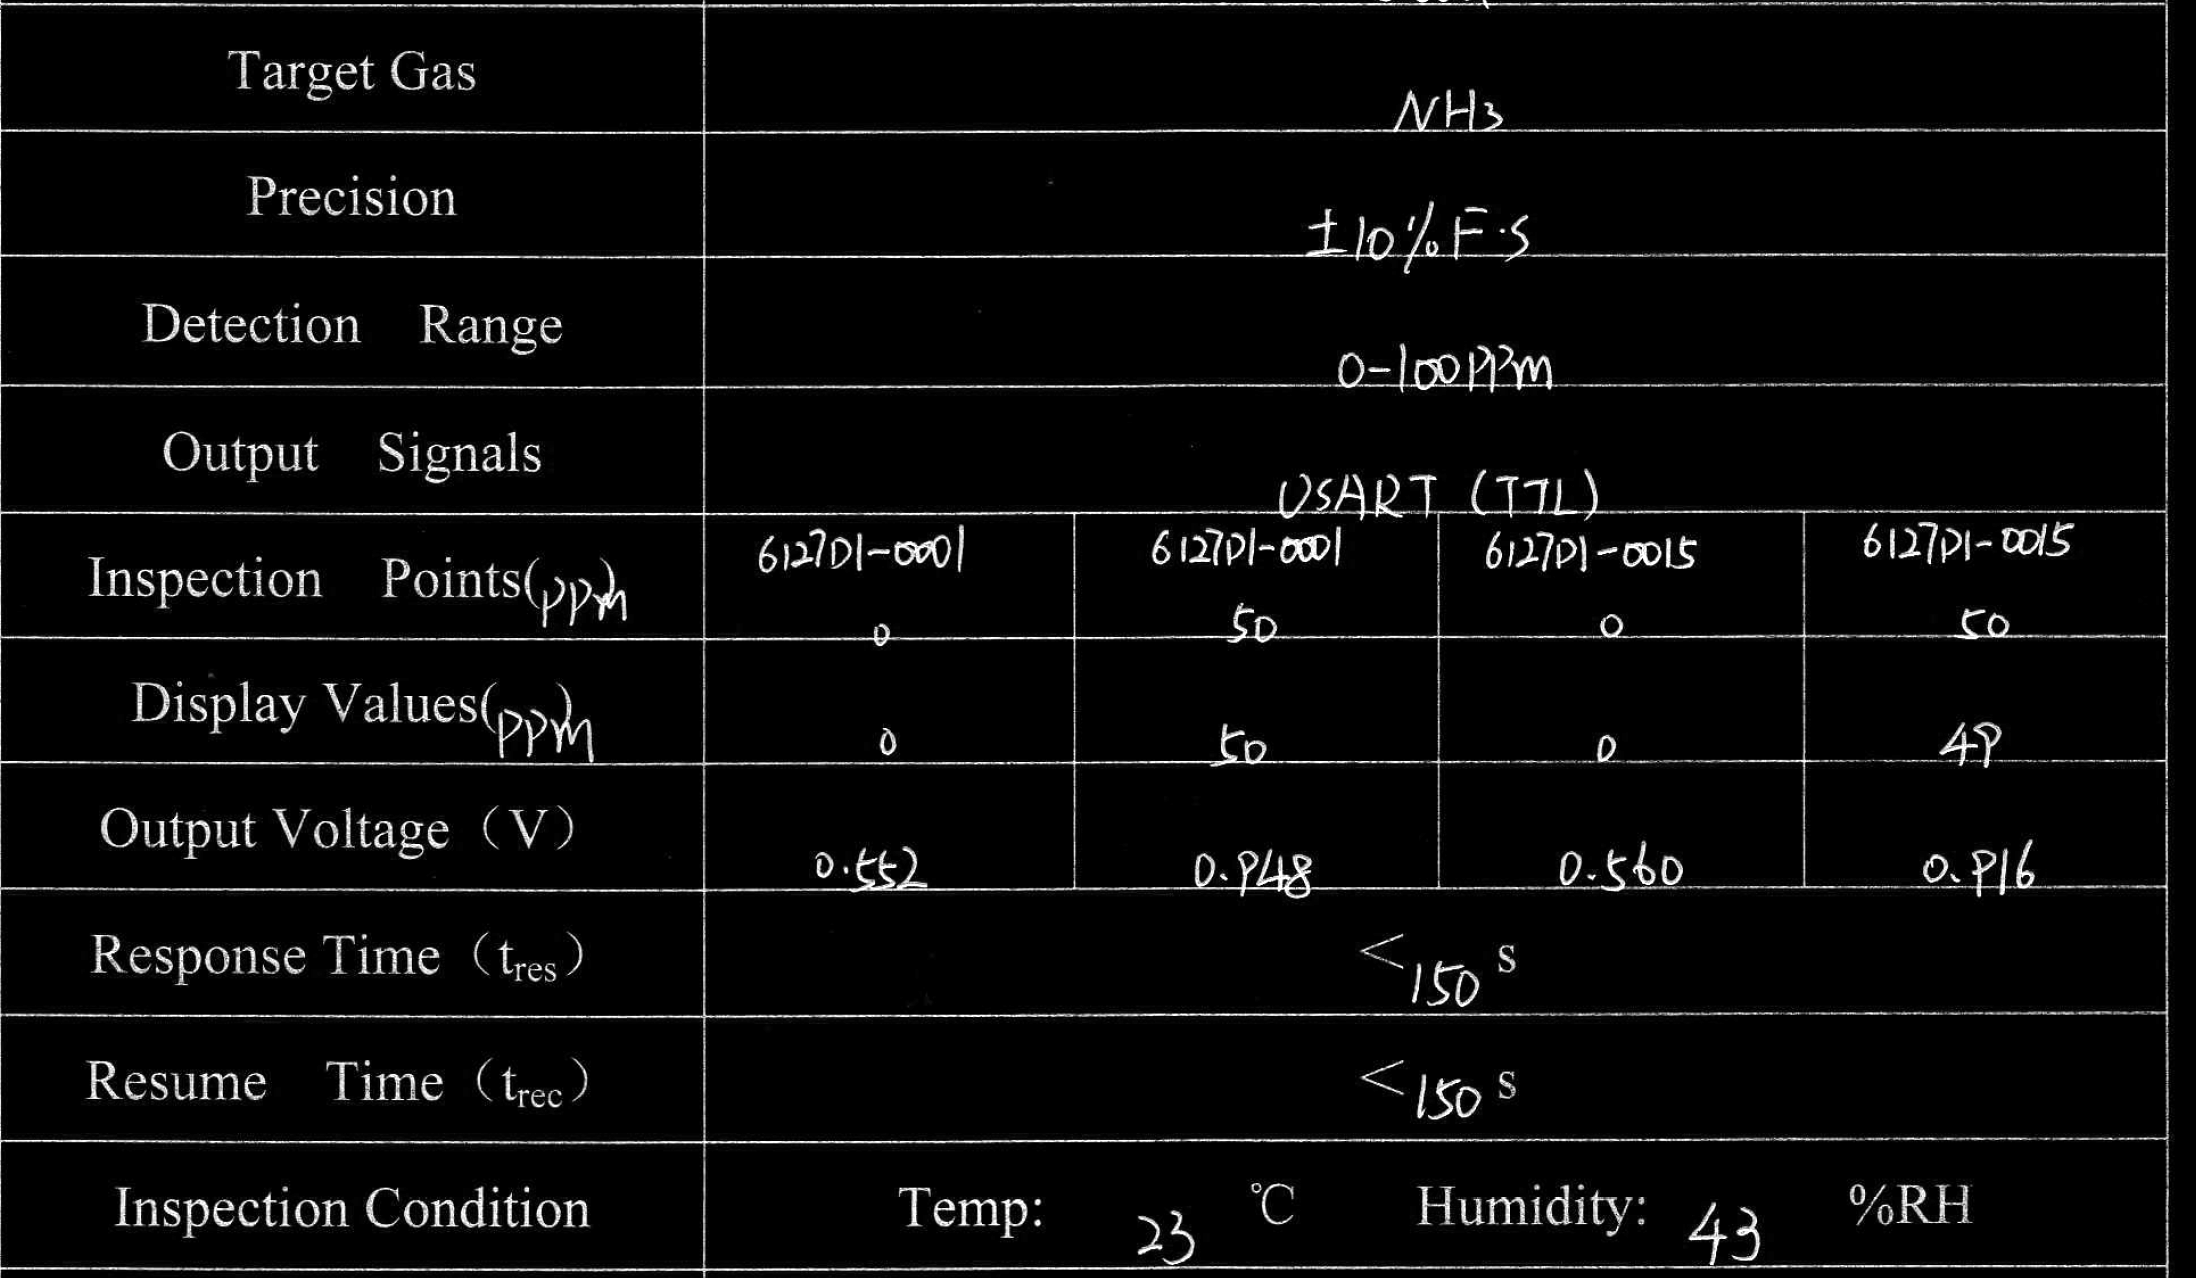
The electrochemical sensors used in this project, are individually calibrated in a test lab. They have a unique identifier, and so, for each - calibration data is generated after tests in the controlled environment.
![]()
Besides the 4 sensors that I selected for this project, there are other sensors for a wide range of gases. This is one of the reasons I designed the PCB with sockets, for interchangeable sensors. The other reason is that electrochemical sensors have a lifespan of about 2 years. That is because they work in a similar way to electrochemical batteries - they generate a current when the target gas is present. So with a limited lifespan, the maintenance of these units needs to be made as simple as possible - for a practical reasons considering city level deployments.
List of gases with compatible sensors
Getting back to the list of gases for which there are compatible Series-4 sensors:
Carbon Monoxide CO (0-1000ppm), Oxigen O2 (0-25%vol), Ammonia NH3 (0-100ppm), Hydrogen Sulphide H2S (0-100ppm), Nitrogen Dioxide NO2 (0-20ppm), Hydrogen Fluoride HF (0-10ppm), Sulphur Dioxide SO2 (0-20ppm), Chlorine CL2 (0-10ppm), Ozone O3 (0-20ppm), Ethylene C2H4 (0-100ppm), Formaldehyde CH2O (0-10ppm), Ethylene Oxide ETO (0-20ppm), Hydrogen H2 (0-1000ppm), Hydrogen Chloride HCL (0-20ppm).
Now that the chemistry lesson is over, I'll take you to another favourite hobby of mine, software.
Calibration parameters
The datasheet indicates two ways of accessing the data. There is the Digital format that comes with registry data that compensates the readings on the fly, and the raw analogue output where the compensation parameters need to be added to the data.
First option is the easy way, but for flexibility I went for the second. Raw data is being obtained from the 4 sensors and sent to the server. There, a database holds the unique sensor identifiers and the calibration parameters for each.
![]()
The calculations are easy:
![]()
Finally when you call the RESTFul API to see the actually readings from the unit, you get the final data, with the calibration parameters added to the result. Perfectly calibrated sensor readings.
The advantage to this is that maintenance work is reduced to a minimum: in case you need to replace old sensors, you just insert them in the sockets, then change the numbers on the server, in a simple dashboard.
The same approach should you want to configure a detector unit to work with different sensors, any from the list will work, you can even use 4 sensors for the same gas, for maximum redundancy.
-
Putting everything together
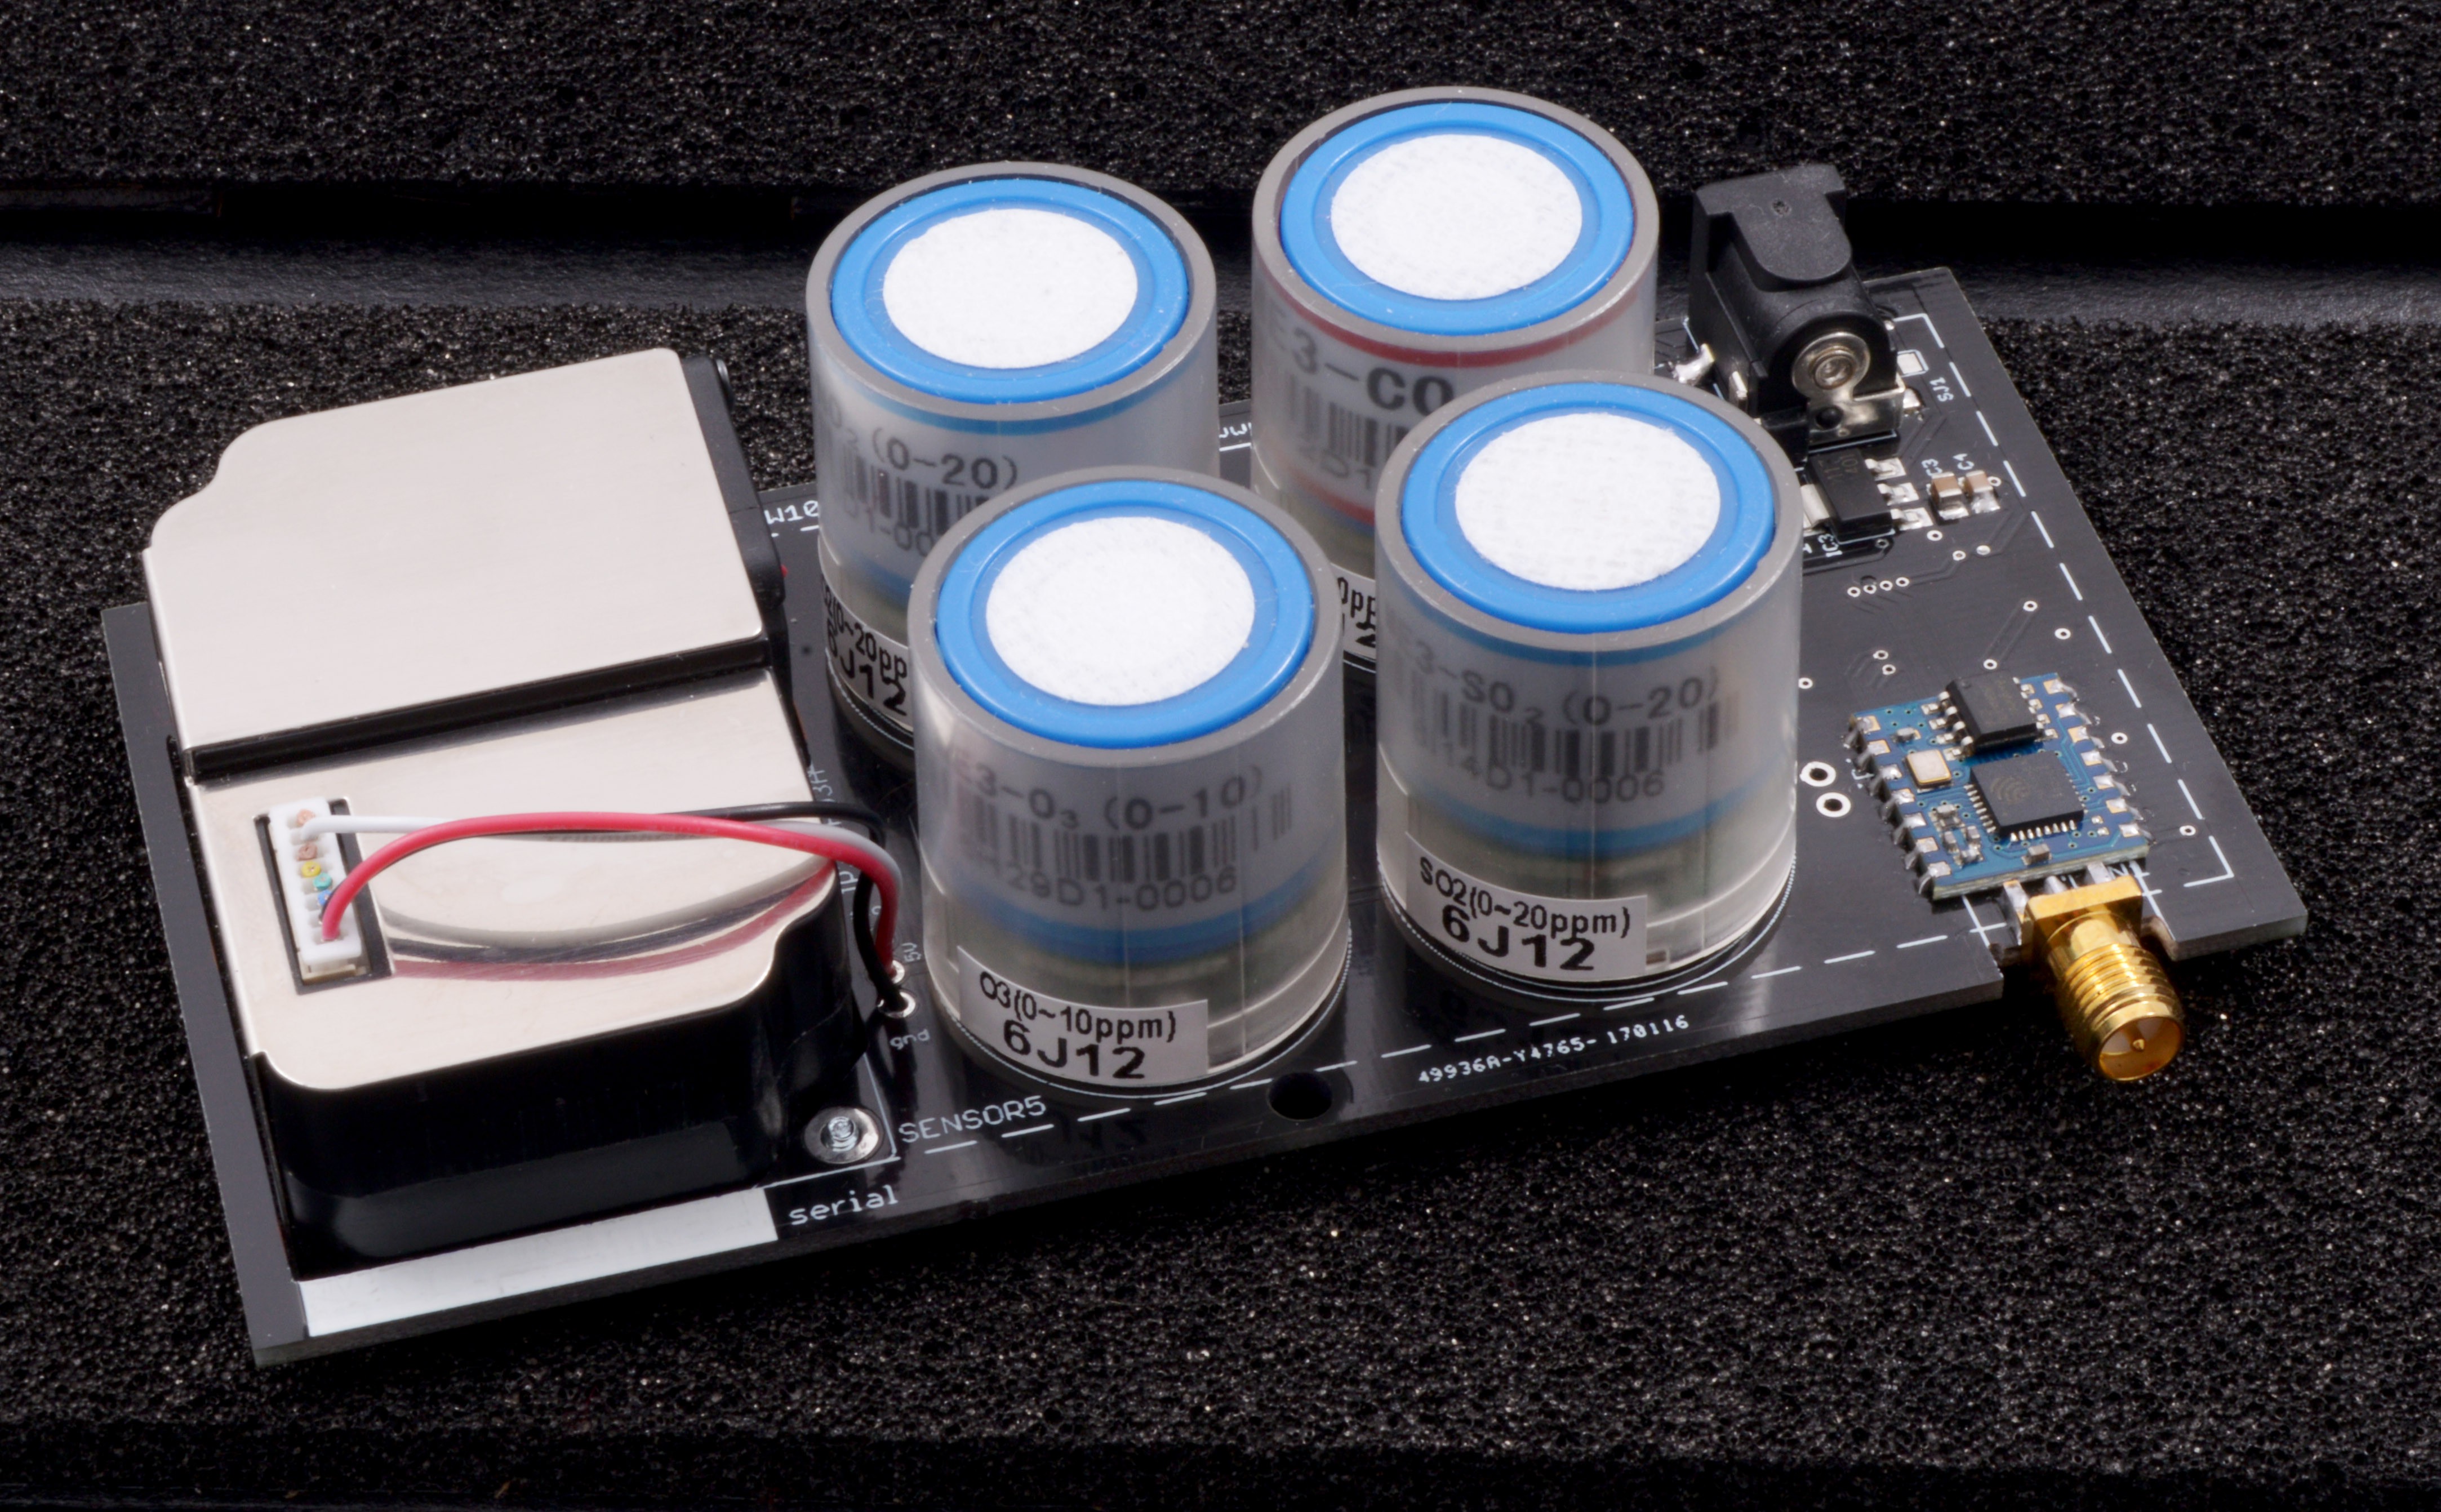
05/14/2017 at 13:55 • 0 commentsThe first assembled PCBs were a beauty:
![]()
The sensors fitted the sockets perfectly. After spending a few hours trying to access sensor data, it became clear that unfortunately, the device didn't work. On each of the 4 electrochemical sensors, the voltage output was a constant value, no matter the fluctuations in test gases (SO2).
What happened was that I did a mistake when drawing the sensor footprint for the PCB design: the positions were mirrored, so the pins were all wrong. A stupid mistake that rendered the PCBs useless.
I had no choice but to start over again. The PCBs were redesigned with the proper sensor footprint, and some additional improvements I had in mind.![]()
This time the performance was as expected. Putting everything together was fun - the PCB connectors and the aluminium enclosure holes fitted perfectly:![]()
![]()
Looking good so far!![]()
-
The aluminium enclosure
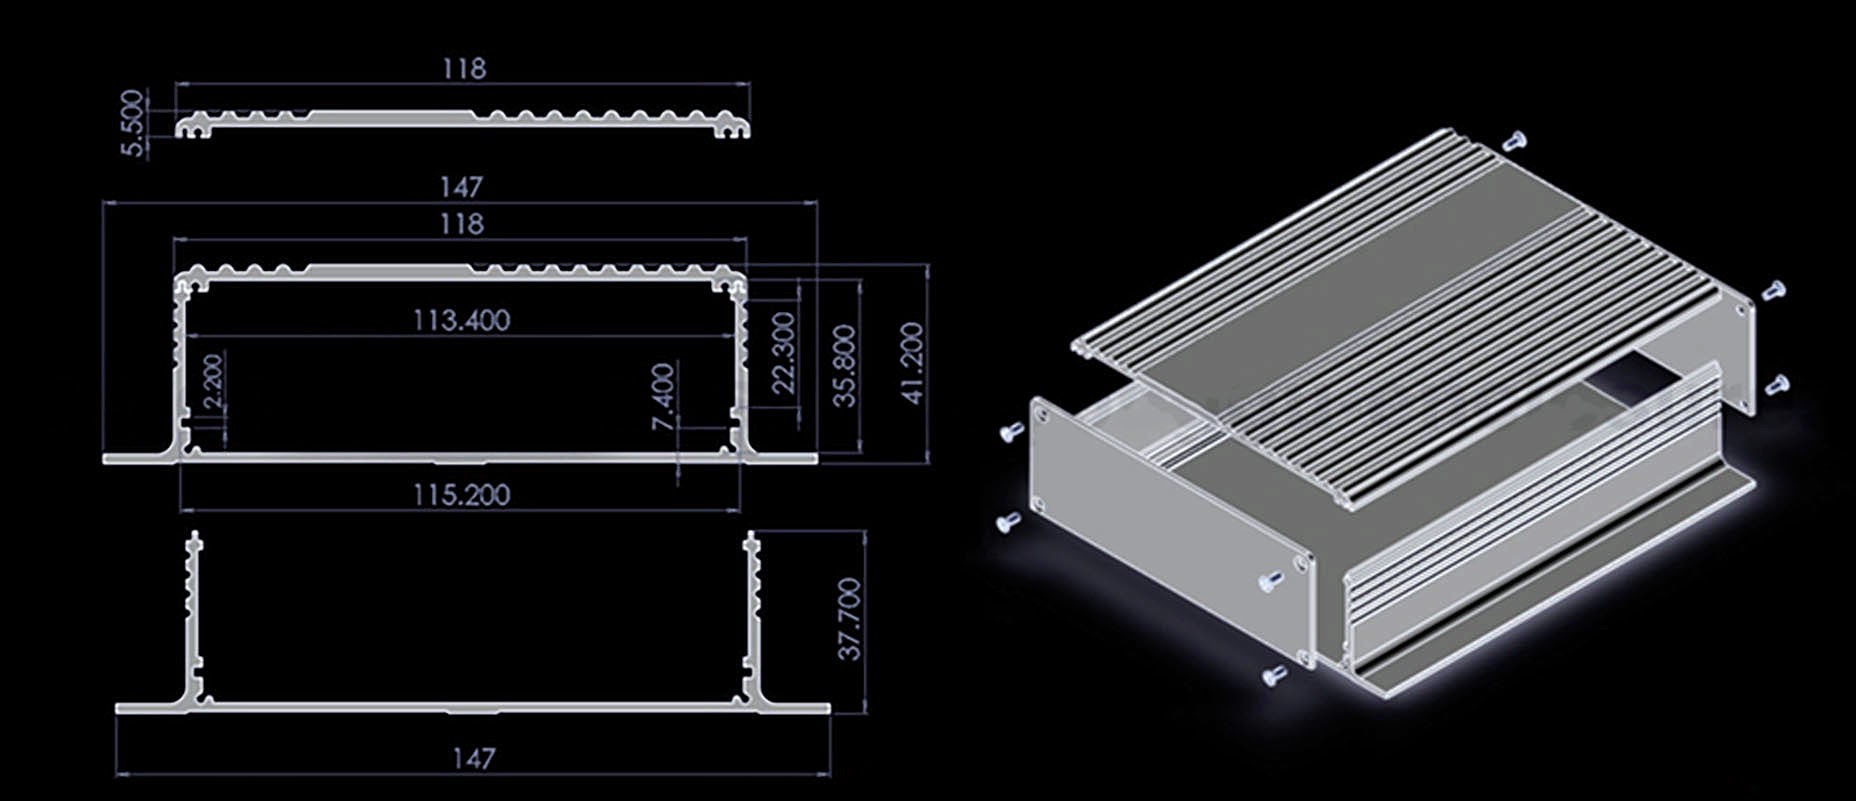
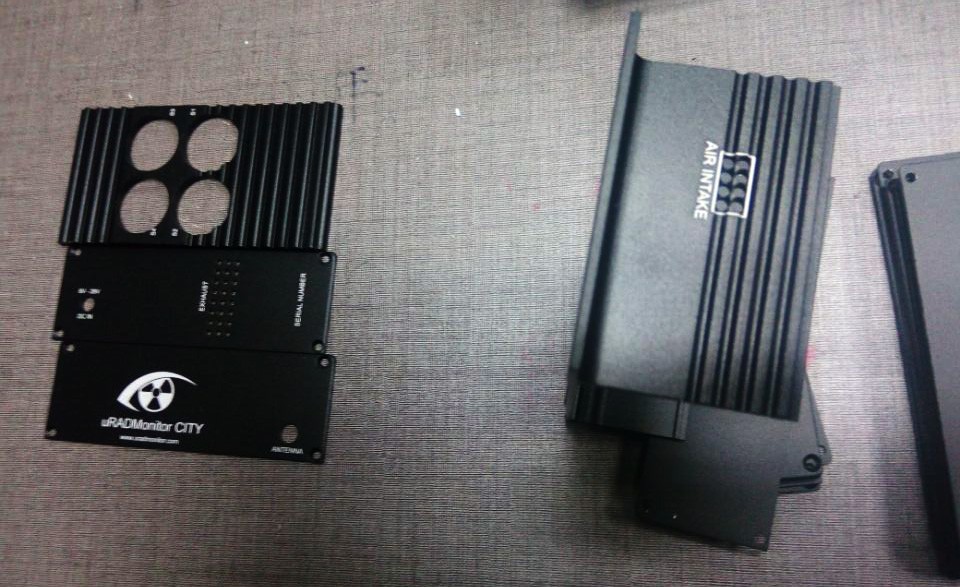
05/14/2017 at 12:59 • 3 commentsTo finalise this product I had to design an enclosure and I opted for anodised aluminium profiles. These can be cut to various lengths to match the PCB, you just need to make sure that the other sizes fit. Luckily the manufacturers offer a large set of profiles to choose from, and I was able to find one that matches the height of the sensors, but also gives some space at the bottom where the copper sockets are soldered, protruding the PCB limit.
![]()
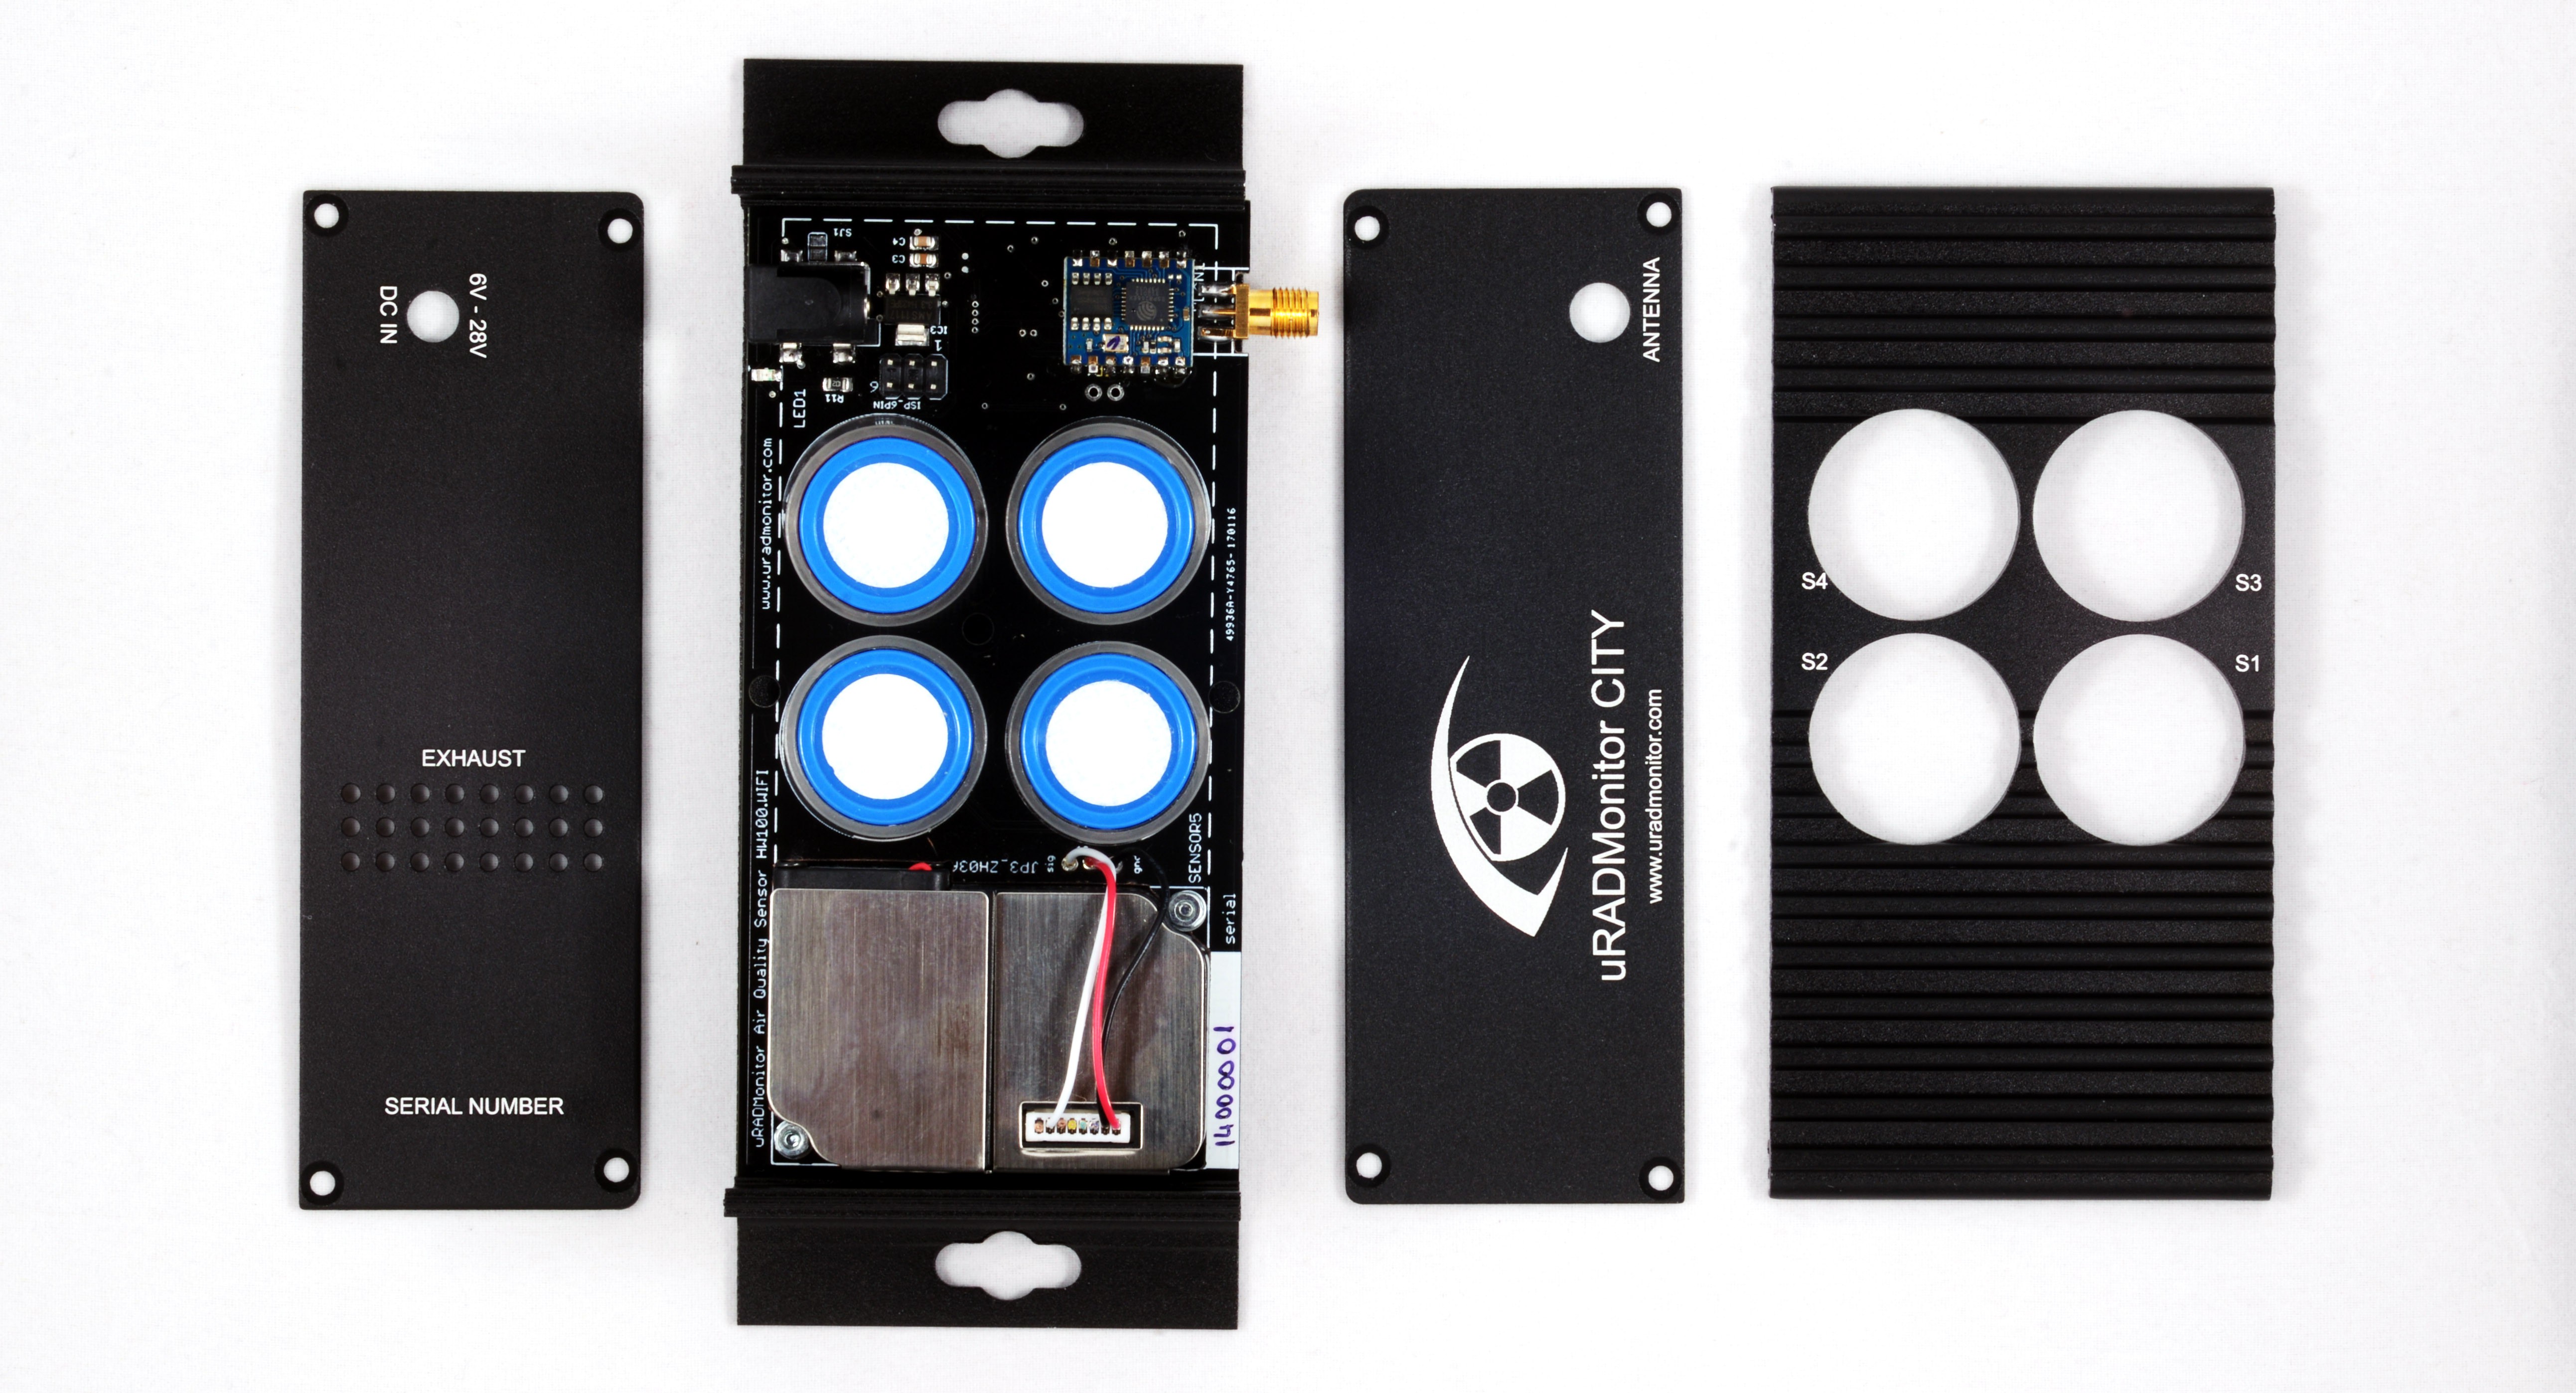
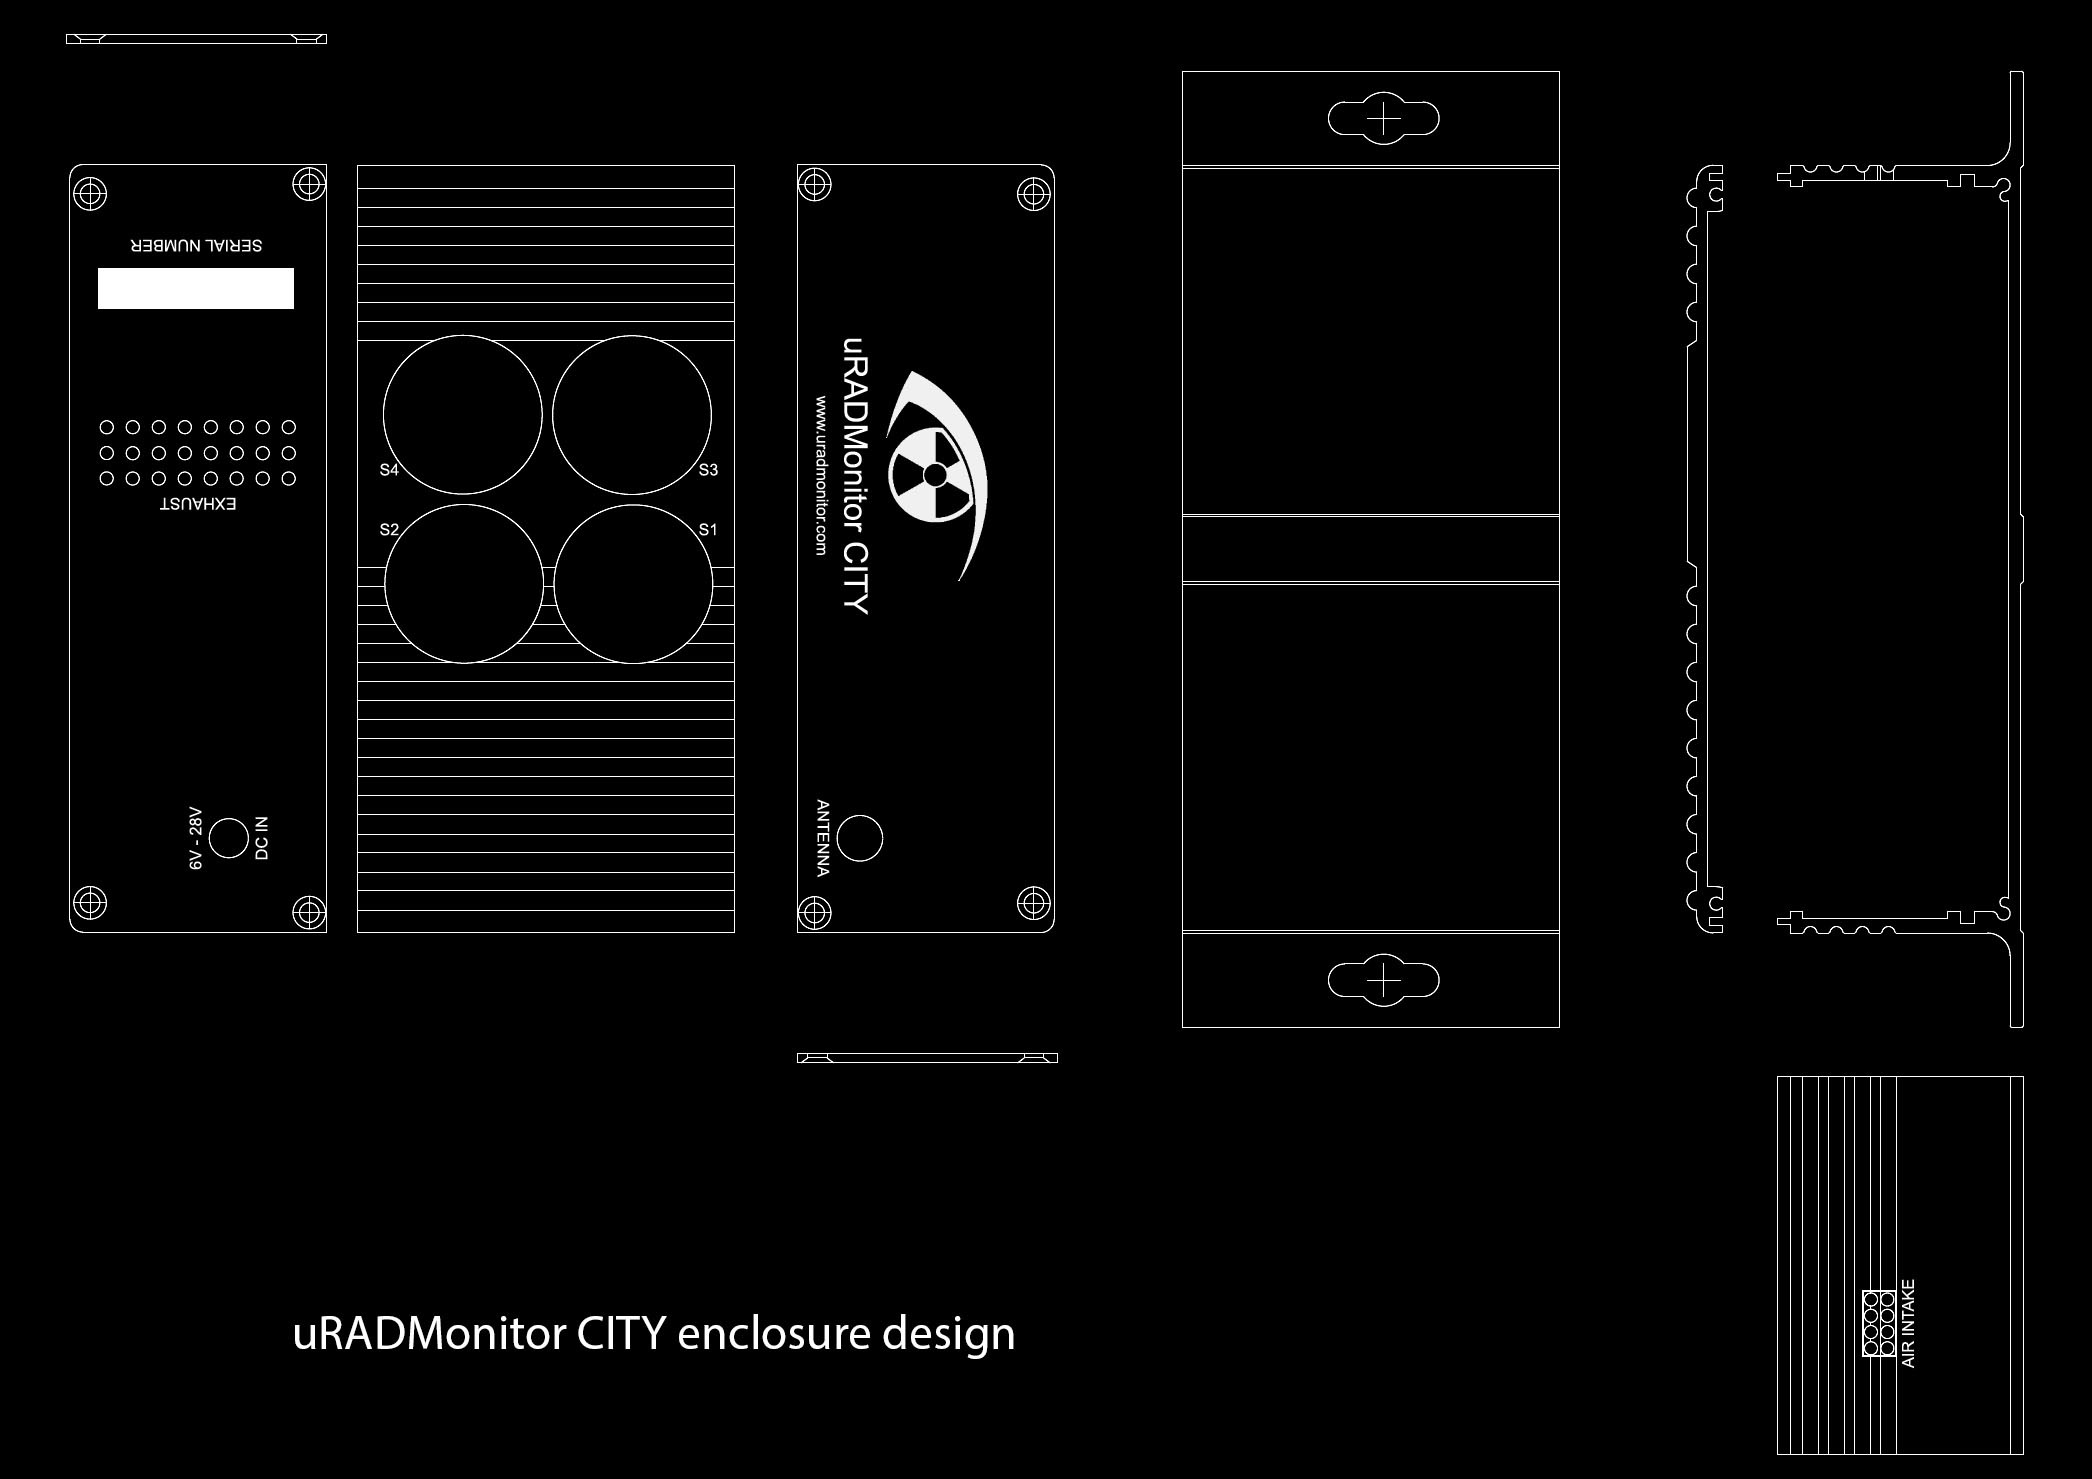
Using the existing profile as a starting point, I had to identify PCB position and sensor sizes to do the holes, logos, and other silkprint elements. I opted for a black anodised aluminium finish with a white silkprint. As the design includes an air pump, holes for air intake and exhaust where added:
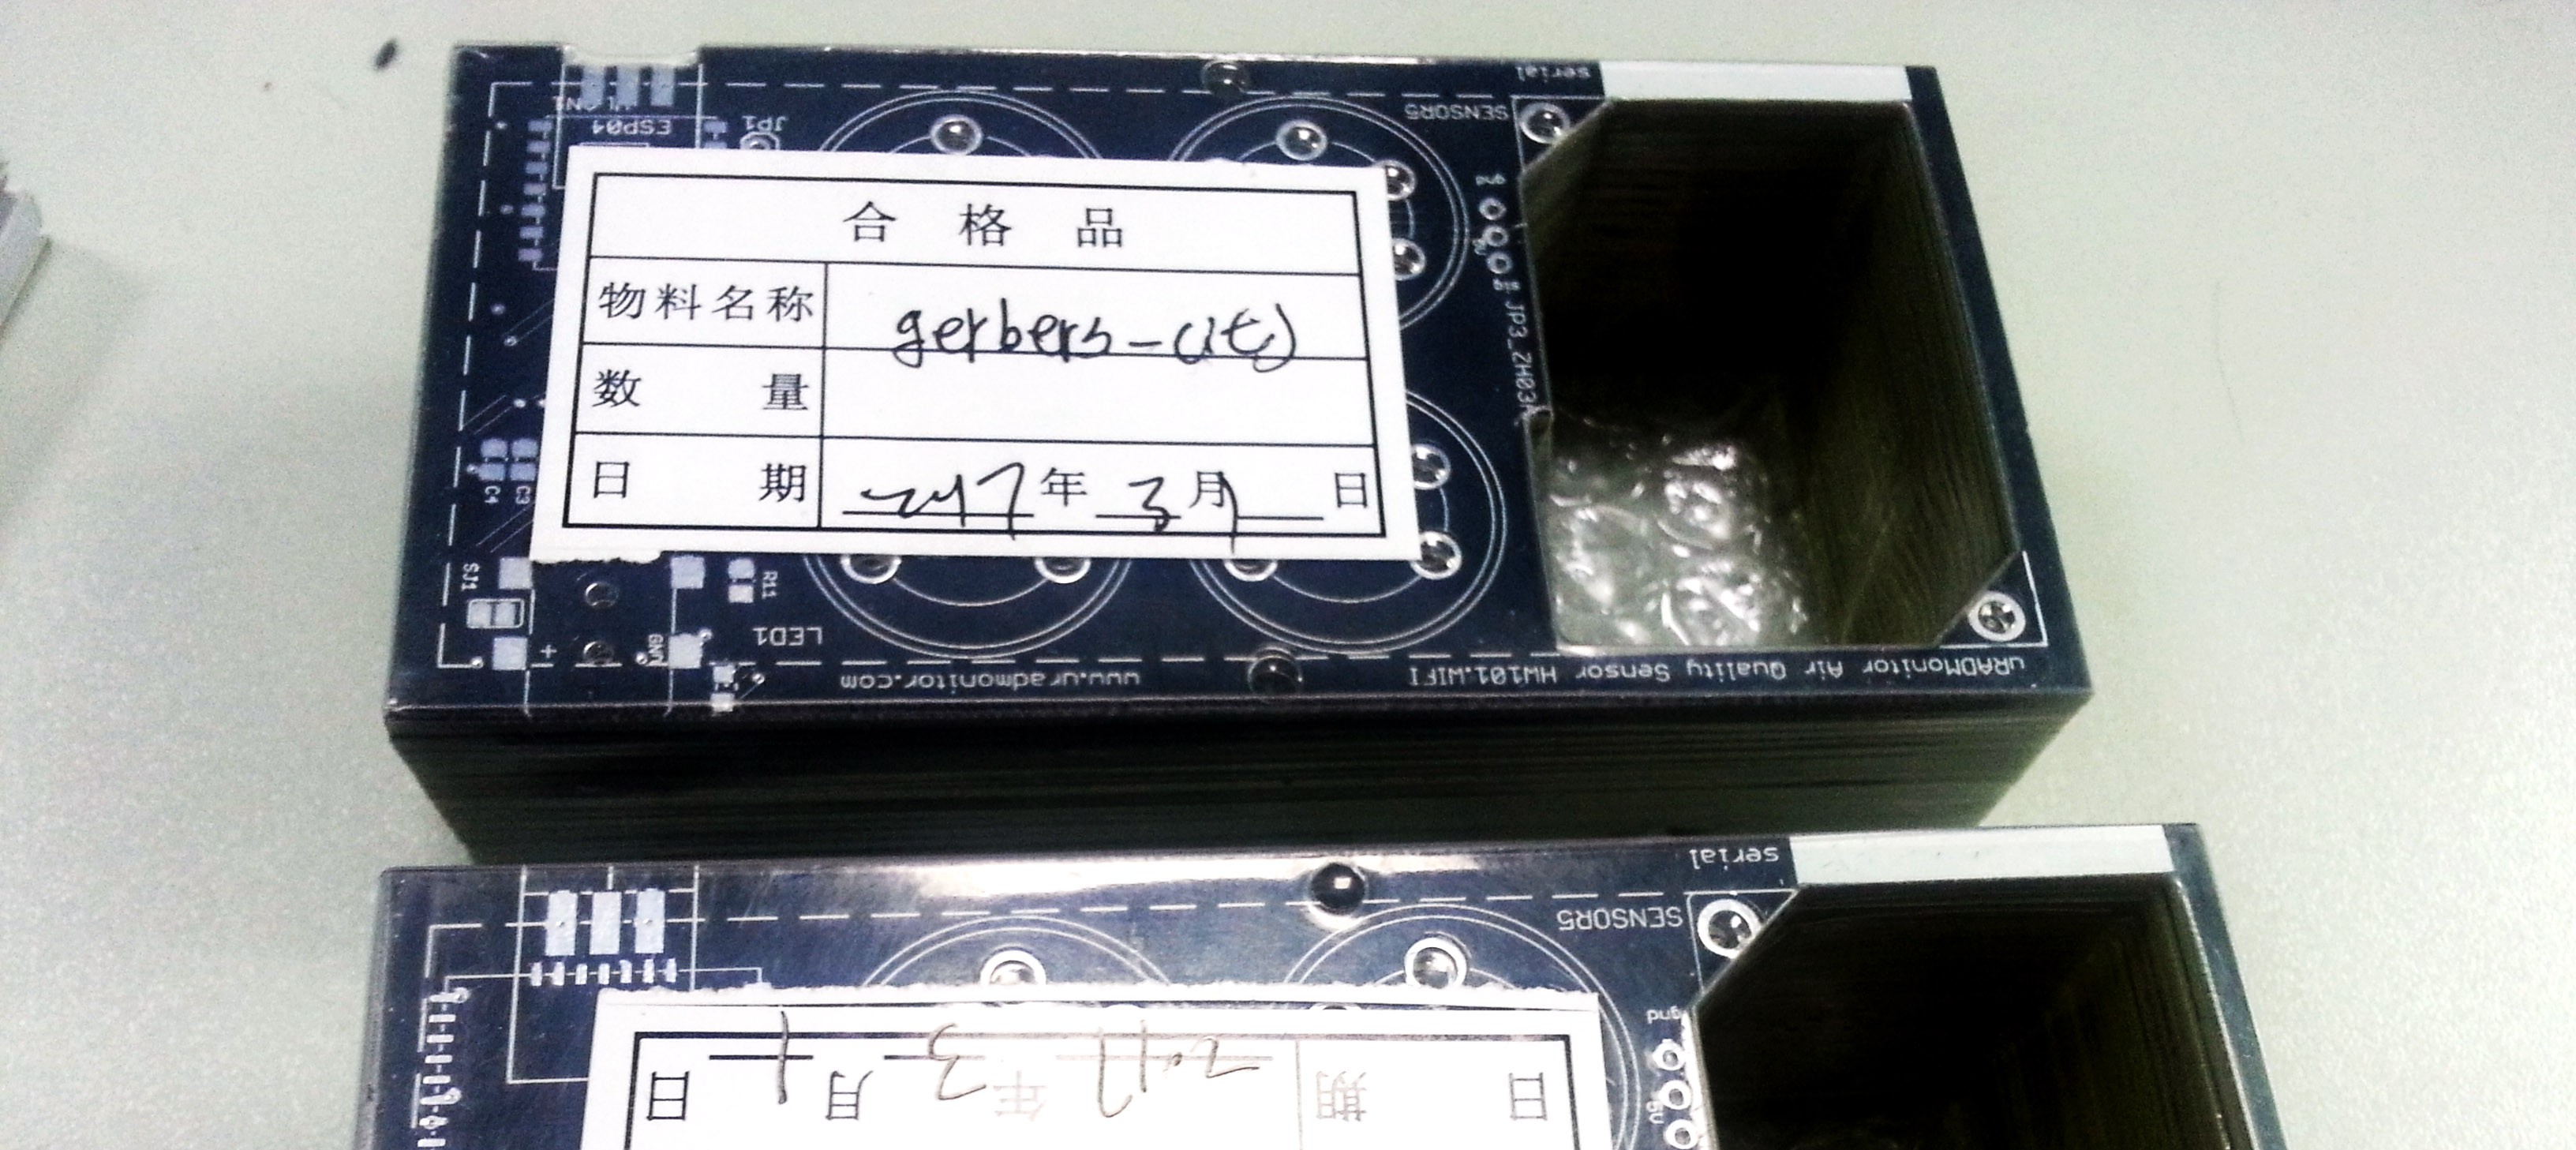
Due to the shape of the PCB, the width of the aluminium profile became the length of final enclosure. This was sent to the factory for machine processing, mainly cutting and cnc milling. About 2 weeks later, the first enclosures were ready:![]()
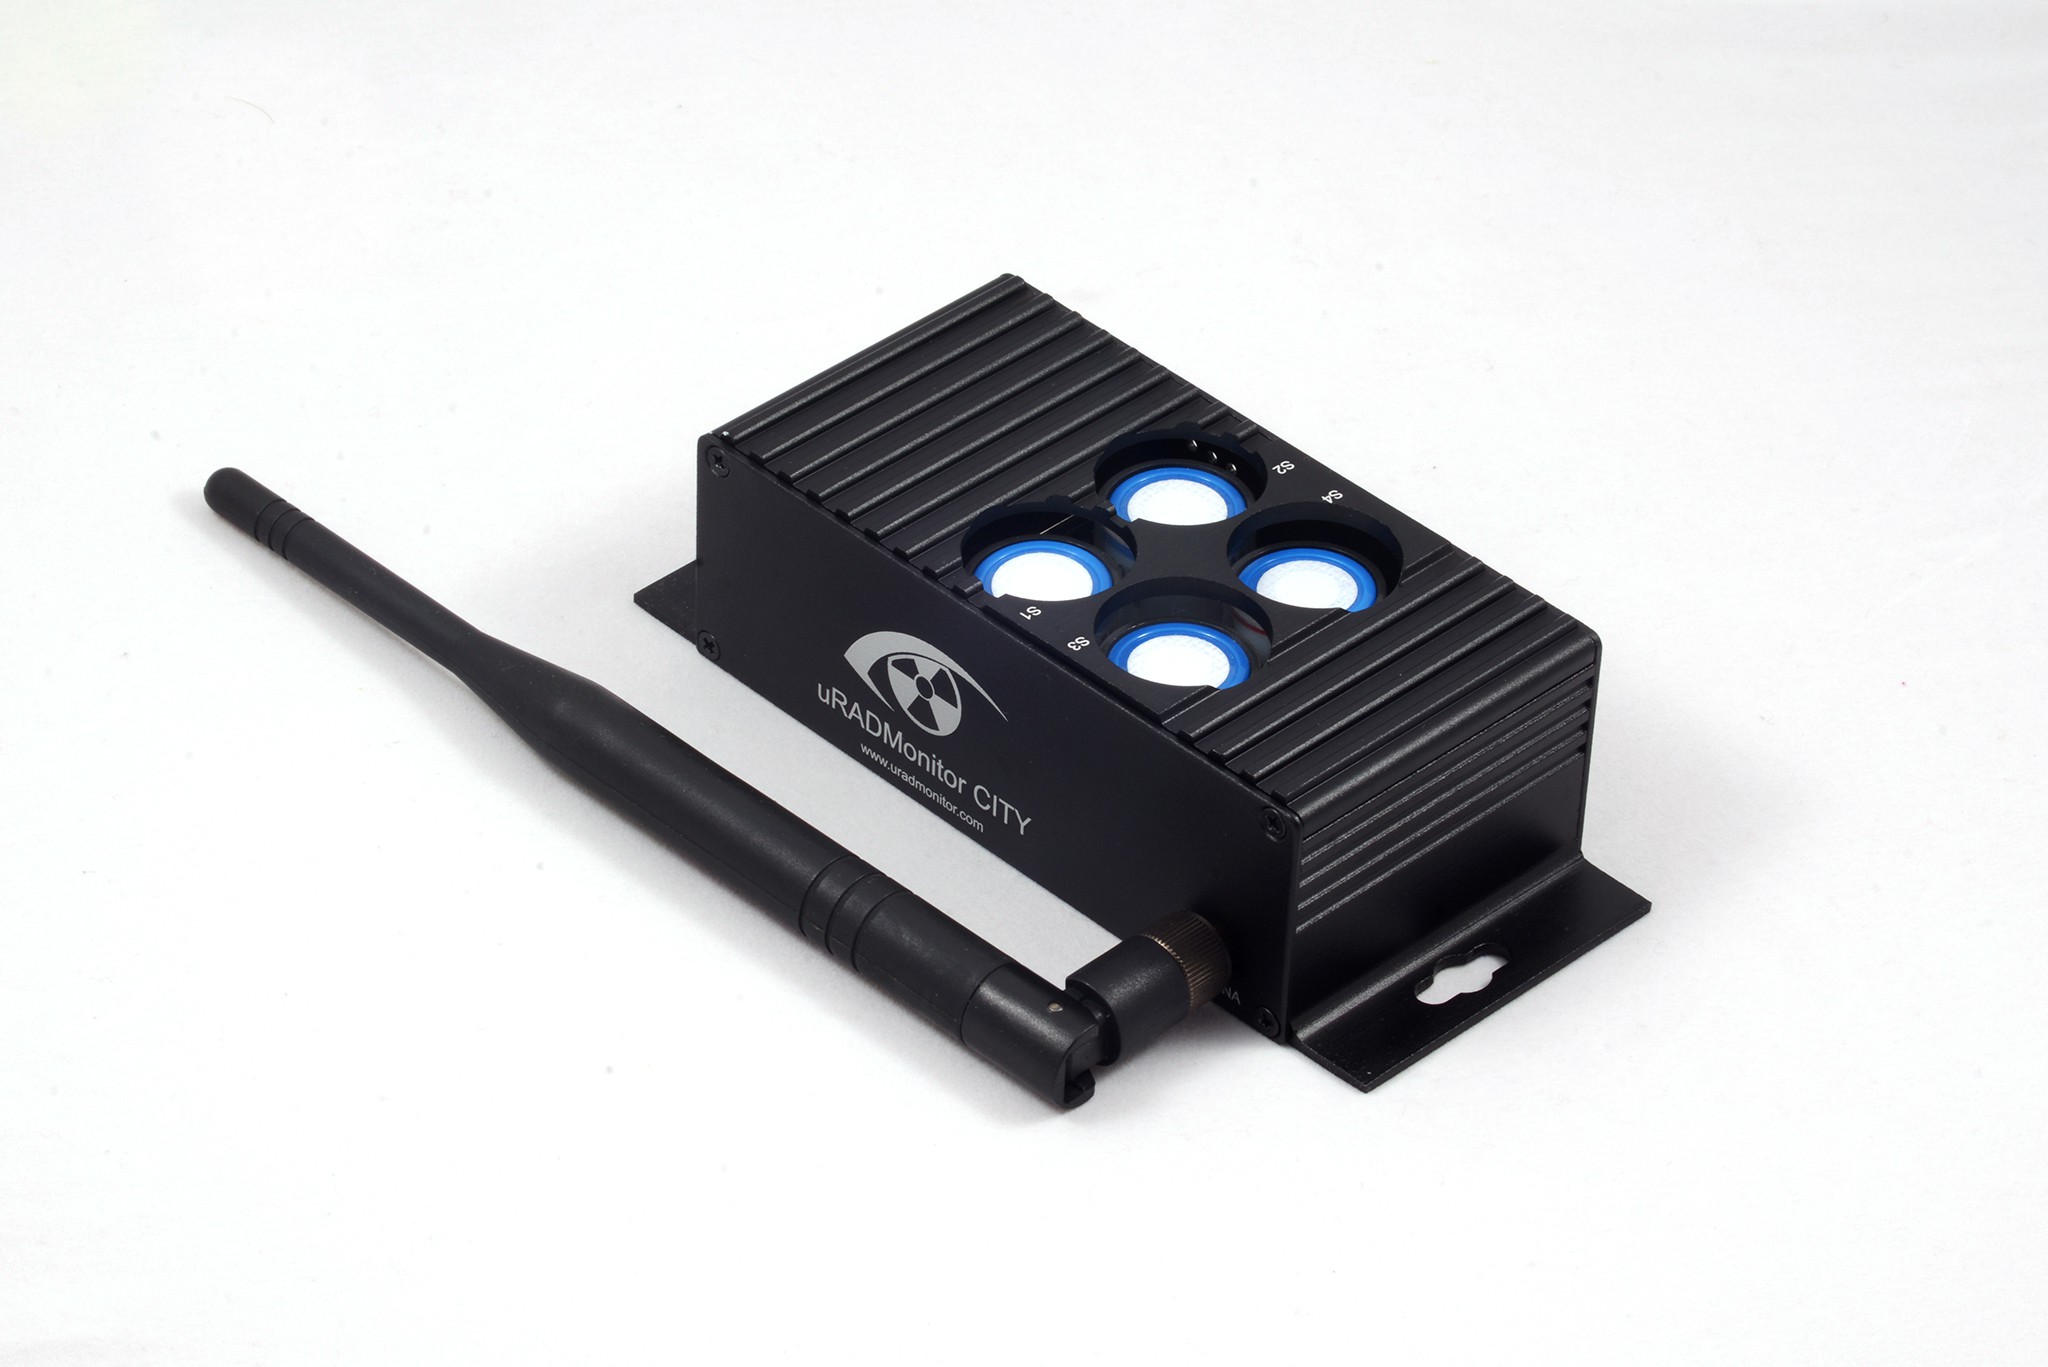
These came out very nicely, and exceeded my initial expectations. The thickness of the aluminium and the proportions of the box give a nice overall feel to this product.![]()
-
Designing the product
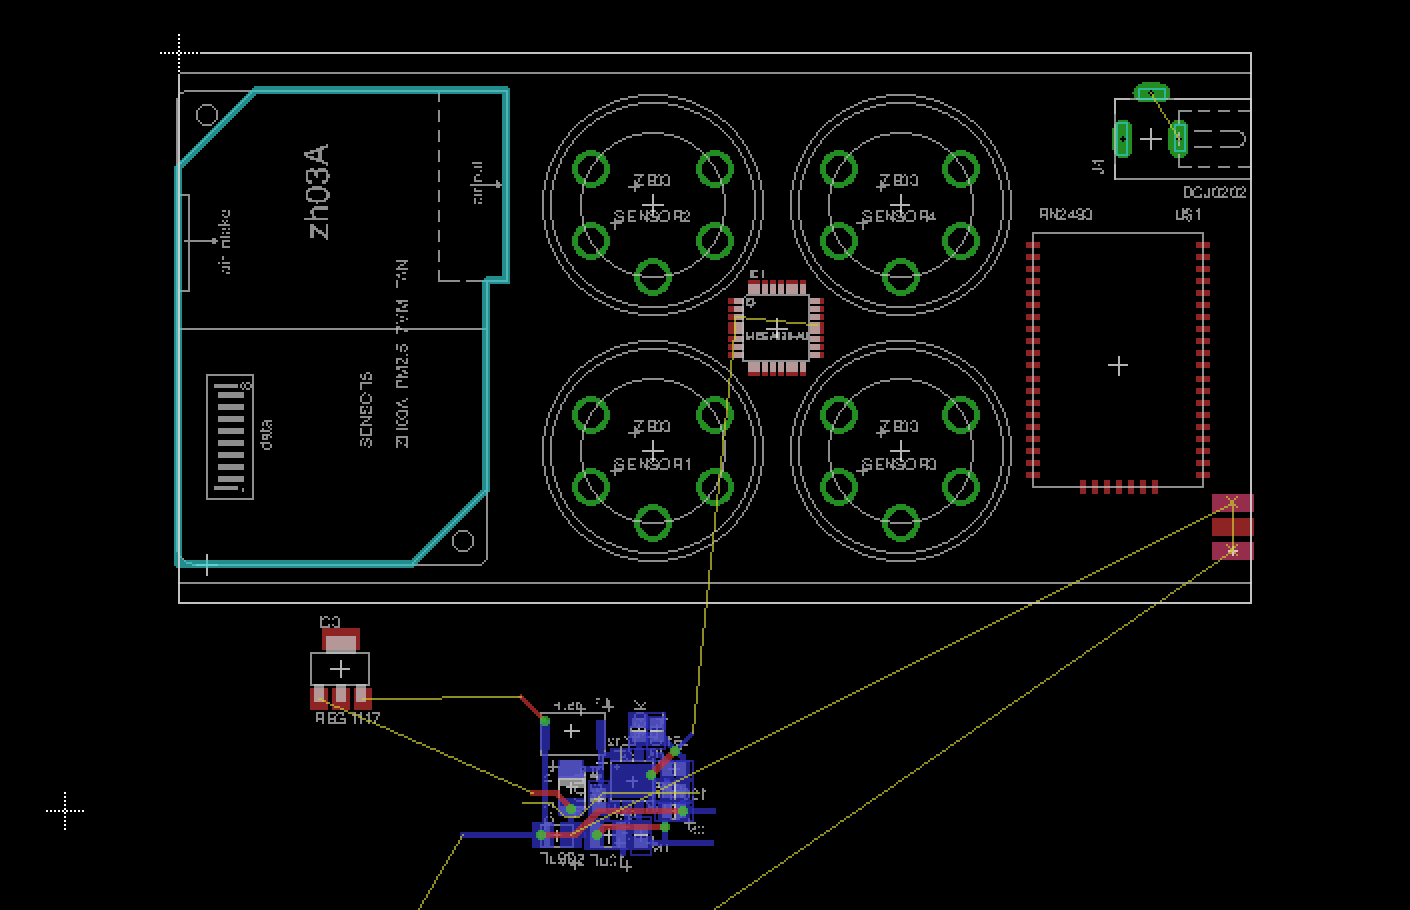
05/11/2017 at 18:15 • 0 commentsThis construction started as a prototype, and I used it a lot in its initial form. I decided to make the next step, and use the field data and sensors tests to build a product out of them. For air pollution in cities, I checked the requirements on Air Quality Index and it became evident that many international evaluation standards go for 6 main parameters. These are Ozone, Carbon Monoxide, Sulphur Dioxide, Nitrogen Dioxide, Particulate Matter PM2.5 and Particulate Matter 10.
As I said my sensor homework was done, so I knew exactly what to go for. I designed a board with 6 electrochemical sensors and a laser light scattering PM sensor. The 6 electrochemical sensor slots would allow two additional gases to be detected, optionally.
![]()
Then, checking the BOM it was clear the costs are too high. 6 4Series electrochemical sensors in a box is not exactly cheap. And talking about the box, that became rather large too. So I removed 2 slots to meet just the Air Quality index requirements. Next was a few hours of fun, doing the PCB traces manually (like I always do):
![]()
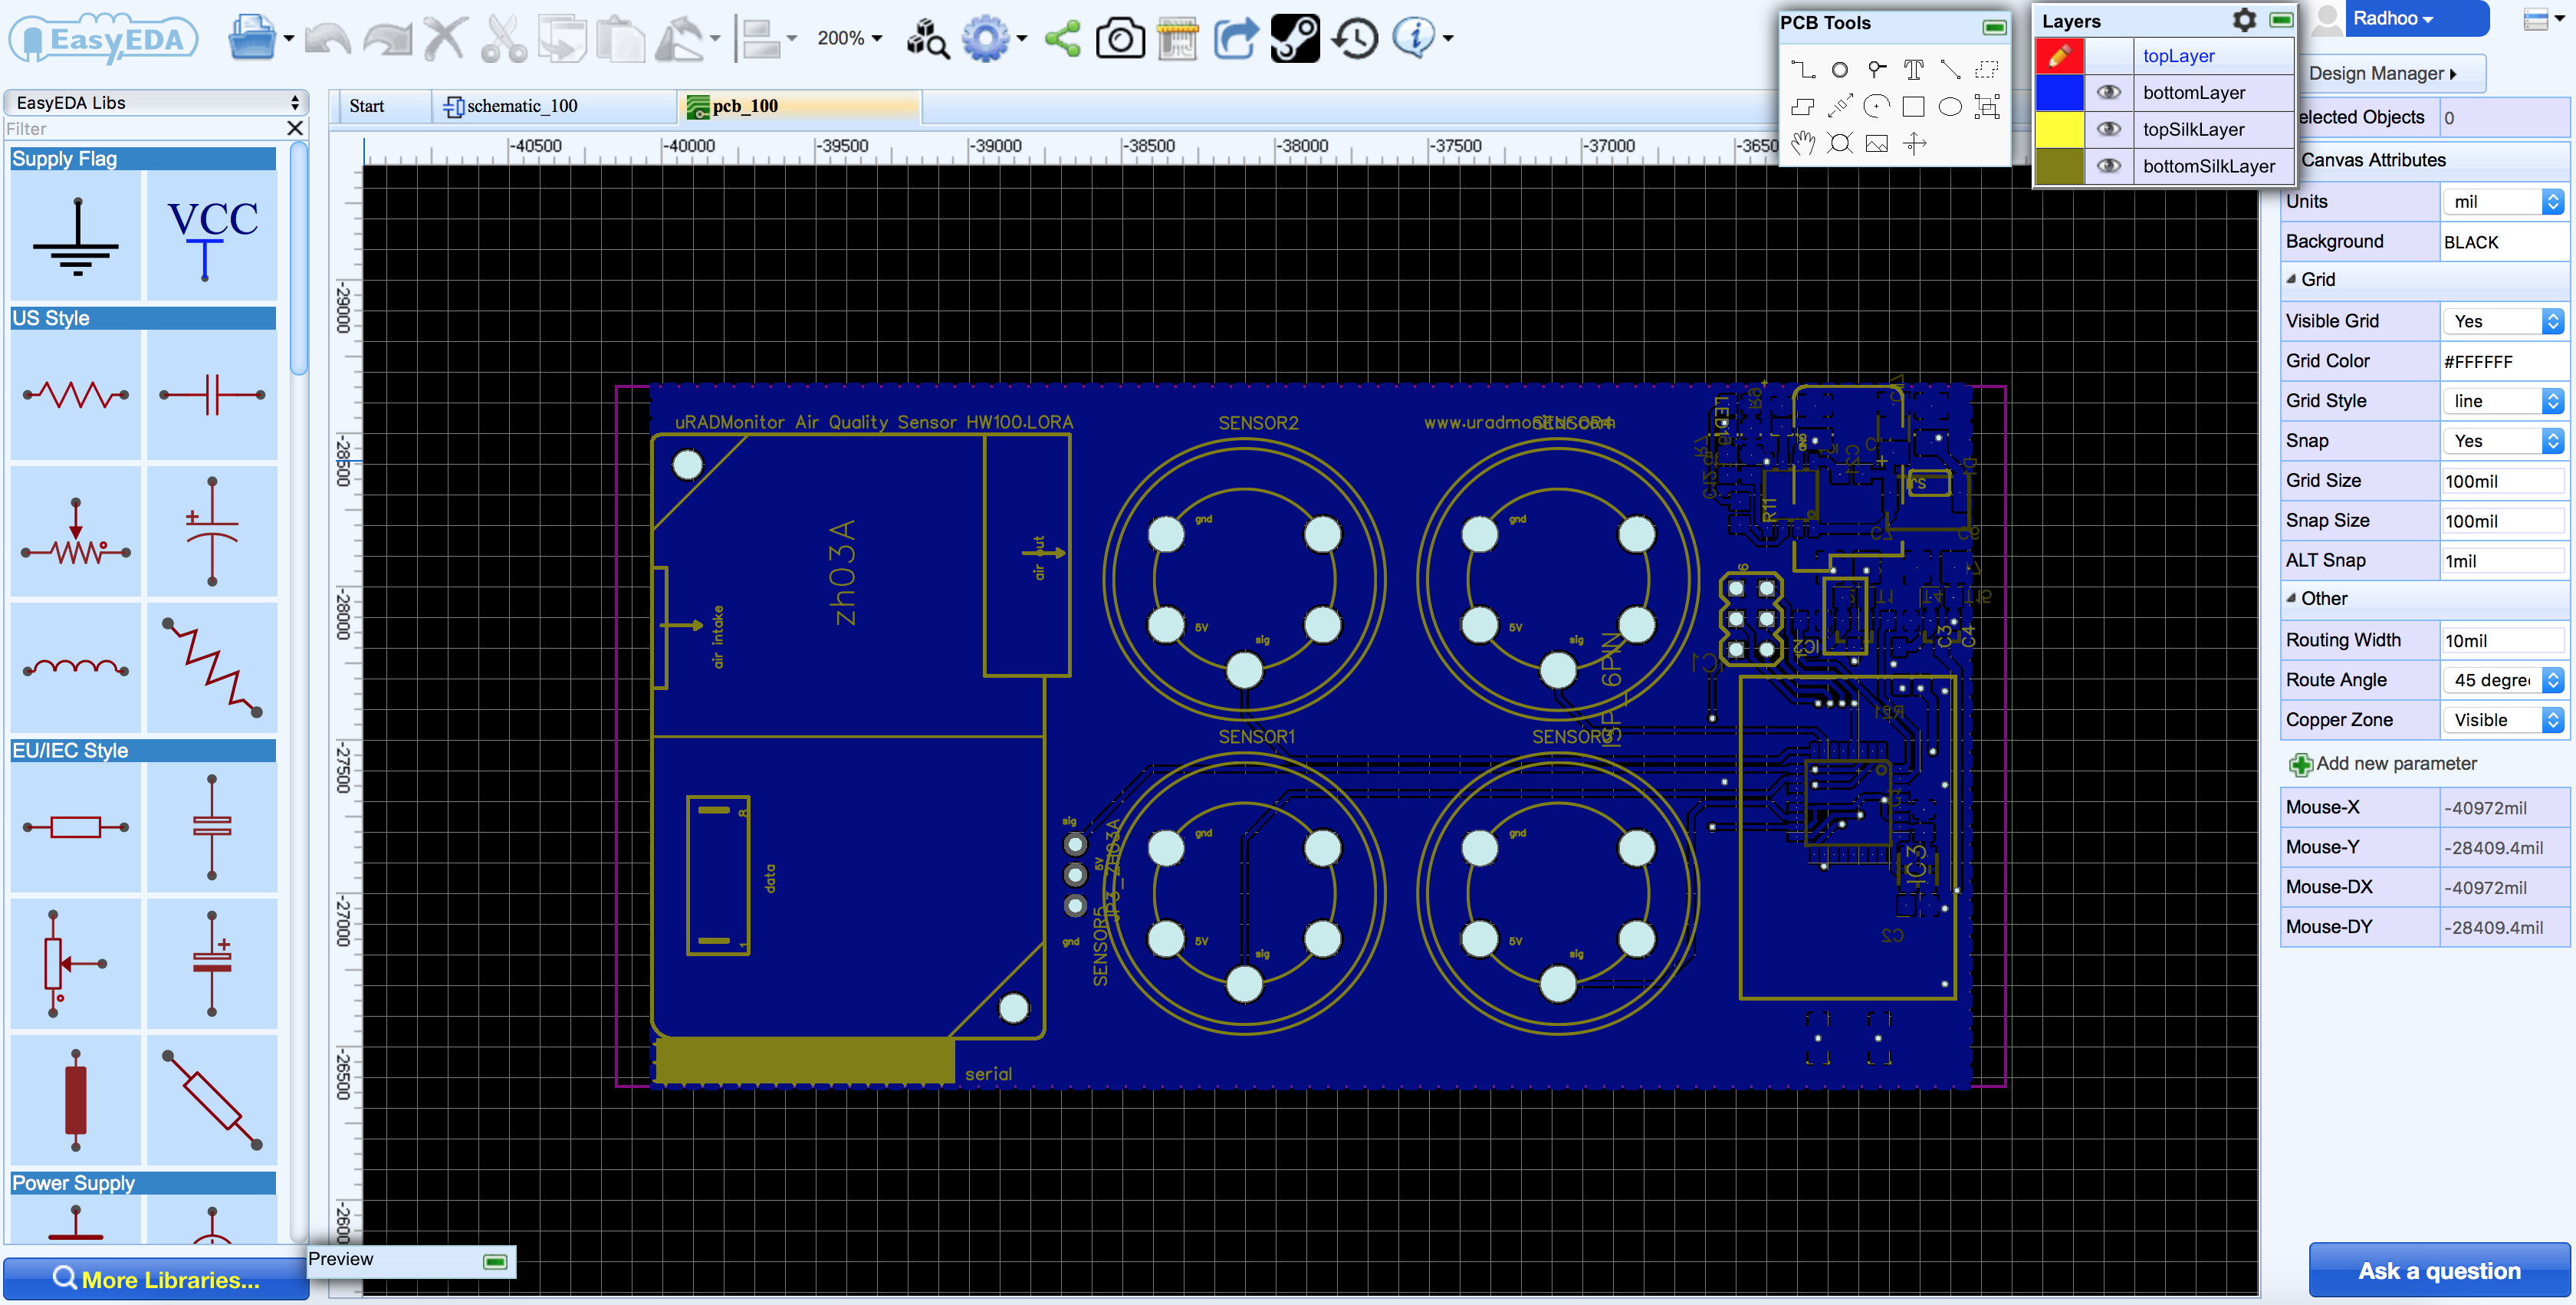
As this will have built in Internet connectivity, the final device will be an IOT detector. I went for two connectivity options, one was LoraWAN and the second Wifi, to cover multiple usage scenarios in City deployments across various ranges and with different power requirement. Here is the LoraWAN:
![]()
And this is the Wifi variant:
![]()
I used some interesting new tools for part of the design, the online tools from EasyEDA. I also used their services to order the PCBs, as my DIY toner transfer attempts failed on this.
-
Ciudanovita, the people and the uranium
05/11/2017 at 17:35 • 2 commentsI had the chance to visit the former uranium mining colony of Ciudanovita in Romania, while having the detector installed on my vehicle. This is a story of what I saw, combined with the data recorded by the device.
![]()
Every gain comes at a price, and so the comfort of technology claims its cost at some other end. For nuclear energy – what it gives is known, modern living conditions, heating, illumination, transportation and all in one the civilised world as we know it. Yet what it takes sometimes remains in the shade, like what an environmental mess irresponsible uranium mining can be, and how hard it is to clean that up?
Ciudanovita in March, 2017
Ciudanovita, in the Caras-Severin county, is one such example. Sadly, it’s a mix of grey Romanian history under Russian occupation, radioactive contamination of a piece of heaven and the struggle for a normal life of those that are still living there.![]()
Ciudanovita surroundings
Under Russian occupation, the Soviets had interest in this area. After the initial prospections in the 1950s, they began uranium ore mining in the 1952, using their own equipment and local workers. This lasted up until 1957 when the SOVROMs were disbanded. Then the Romanians continued the operations until 1964 finalising the country’s debts of war to Russia. All this time, the uranium ore was simply loaded in containers and shipped to the East by train. The mining required signifiant resources, and as a direct result the colony of Ciudanovita grew in population, reaching as high as 35000 people. There was a local hospital, a cinema, restaurants, places with live music and draft beer and many shops.![]()
Ciudanovita today
When one approaches the area today, will first notice the difficult access. The roads are poor, unmaintained. The Geiger counter will sound its alarm in various places while getting closer to the former mines.![]() The colony is in the immediate vicinity of the mines. The problem is people are living in a valley, and one of the slopes right next of the village is where the ore residue has been deposited. It is obvious this forms a channel for rain water to infiltrate the groundwater, not to mention the strong winds blowing contaminated fine dust over the populated area at only a few hundreds of meters in the valley. The surface readings in the residue area, called “Golgota” are rather high, surpassing 1uSv/h in many places.
The colony is in the immediate vicinity of the mines. The problem is people are living in a valley, and one of the slopes right next of the village is where the ore residue has been deposited. It is obvious this forms a channel for rain water to infiltrate the groundwater, not to mention the strong winds blowing contaminated fine dust over the populated area at only a few hundreds of meters in the valley. The surface readings in the residue area, called “Golgota” are rather high, surpassing 1uSv/h in many places.![]()
Highly radioactive uranium ore residue dumps nearby the populated area ![]()
Elevated readings on the Gamma Scout Geiger Counter
Ignorance or neglijence, the mining project cared little about keeping the place clean. Radioactive ore was carelessly loaded in trains, but from the mine to the train station, some of it also padded the roads and the surroundings. Some of that it is still there, throwing invisible ionising radiation to anything in the area.![]()
Contamination map ![]()
Readings detail in the uranium ore residue dumps
It was bad enough to see a village in poverty due to its main source of income – mining collapsed. There are so many similar areas in Romania, but for this one in particular, add the dangerous invisible enemy lurking around, for a nightmarish scenario. Those that have their homes there live it everyday. There were some plans to clean the area, but no proper action was taken so far.As for the device, this short trip proved its utility.
Additional resources:
Fosta mina de uraniu de la Ciudanovita neecologizata nici acum
Ciudanovita locul din Romania unde radiatiile de uraniu depases de 100 de ori limita de alerta
Moartea poarta numele de Ciudanovita
Marturisiri din Ciudanovita -
The first results
11/09/2015 at 00:34 • 1 commentTo collect enough data I drove for a few hours across the city of Timisoara. Thanks to my beautiful assistant I got to have a demo video of the entire procedure:
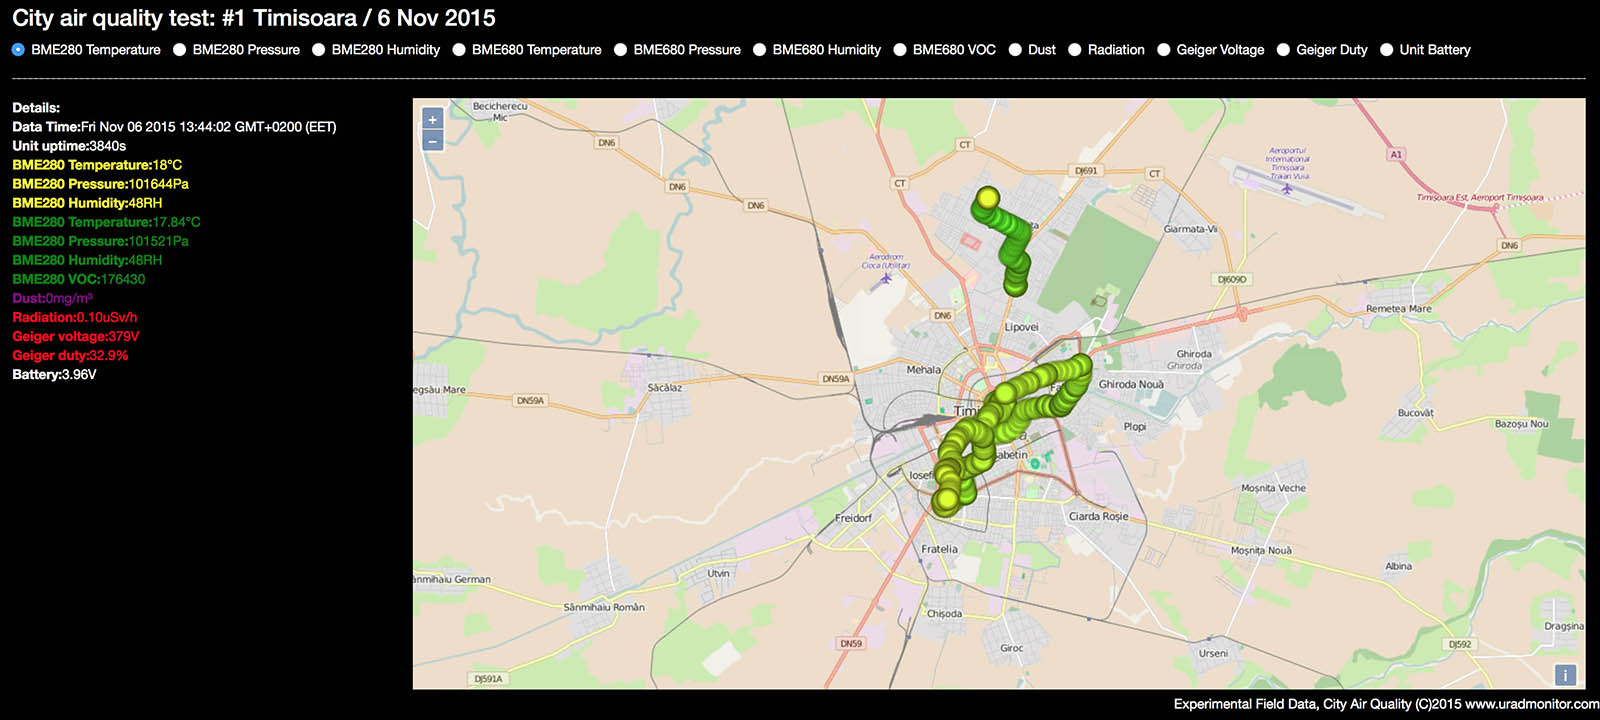
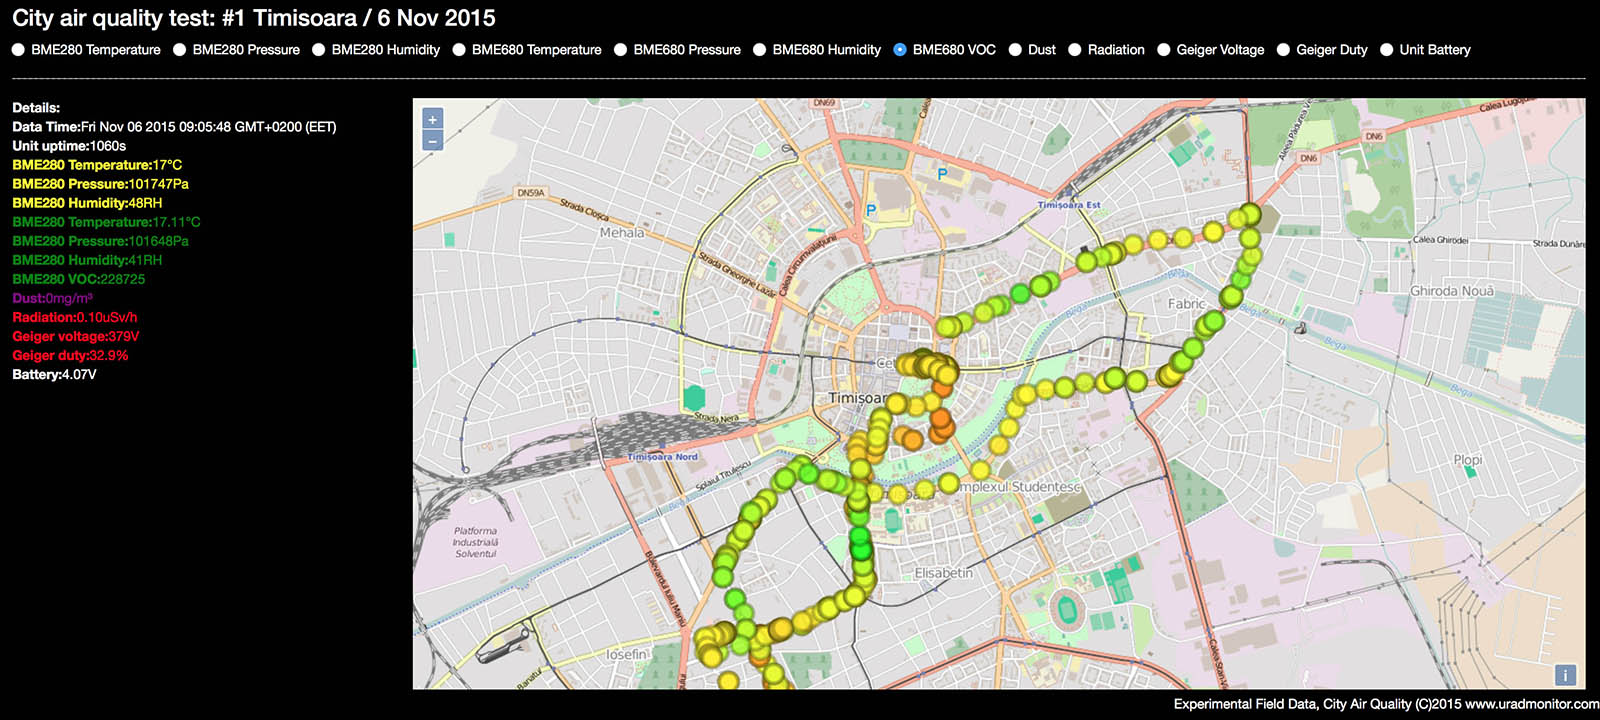
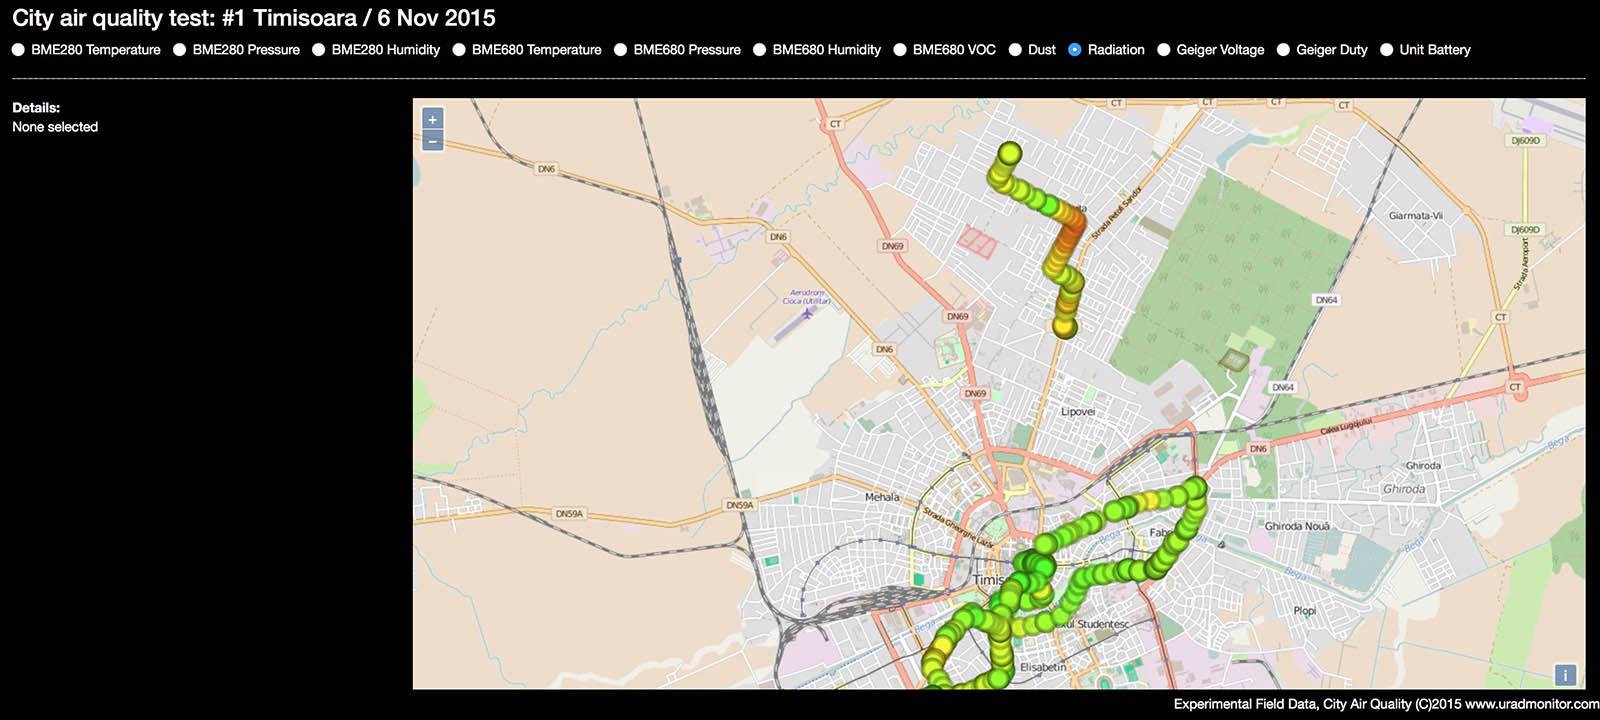
To better analyse the results of this first test, I had to built a web interface that plots all data across an OpenLayers map of Timisoara. While the sensor unit only features 5xSBM19 for sensitive radiation detection, a BME280 sensor mounted inside the unit's case (for temperature, barometric pressure, humidity), a BME680 sensor (temperature, barometric pressure, humidity, VOC) mounted inside the air tube, a Sharp GP2Y1010 dust sensor, the smartphone also adds GPS details including latitude, longitude, altitude and speed. All this together results in valuable information regarding the environmental quality, mapped geographically to exact location. The data can be accessed on the interactive map.![city_airq_webdata_1]()
![city_airq_webdata_2]() The Dust and VOC parameters need some additional work, so as said, this entire project so far is experimental, and has the purpose of identifying the starting point for providing this kind of environmental surveillance at a city level. A very interesting discovery is a raised radiation measurement, in the North side, where increasing readings are consistent to approaching to a radiation source, while departing the area shows the expected decrease, unlike an isolate spike in readings. See the second photo below for a closer look:
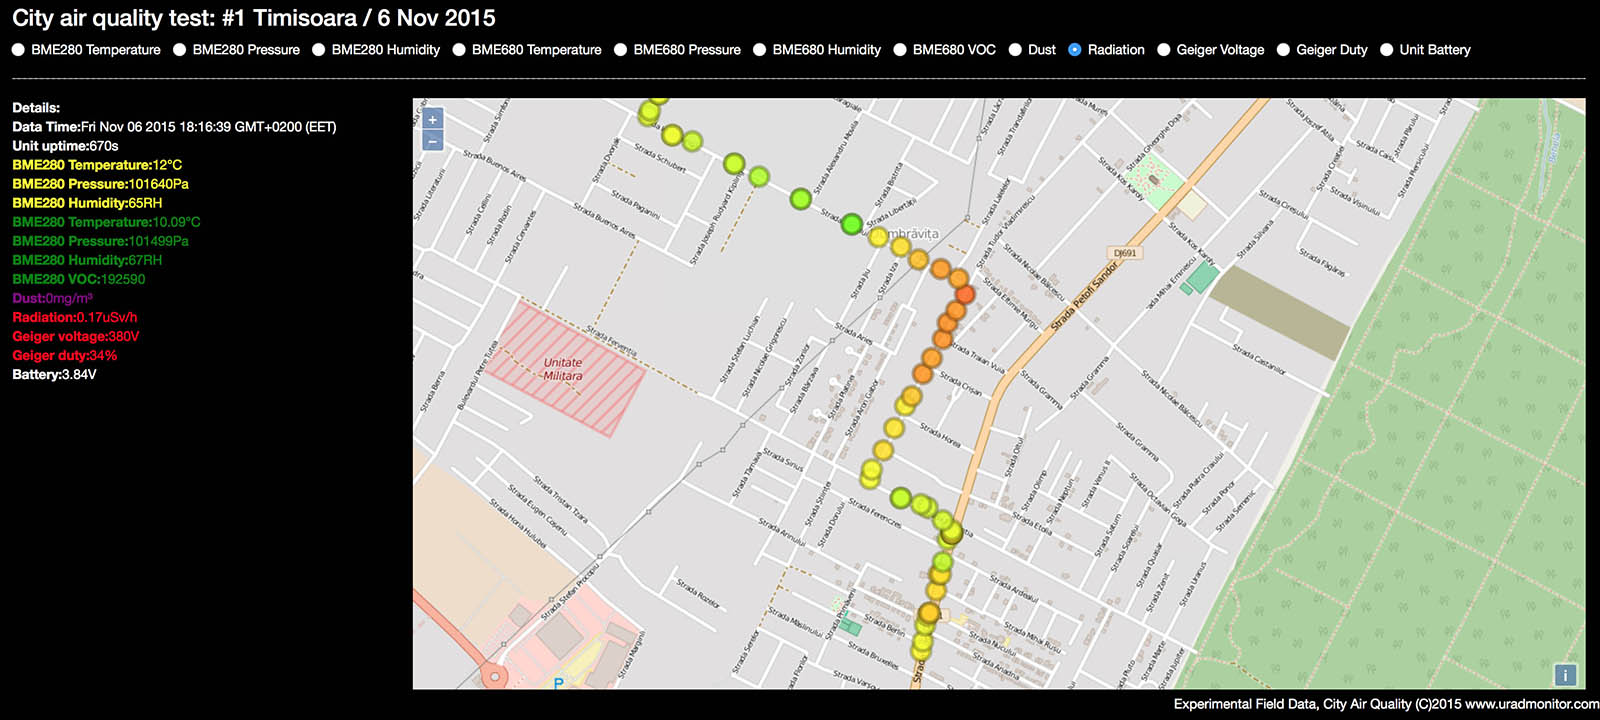
The Dust and VOC parameters need some additional work, so as said, this entire project so far is experimental, and has the purpose of identifying the starting point for providing this kind of environmental surveillance at a city level. A very interesting discovery is a raised radiation measurement, in the North side, where increasing readings are consistent to approaching to a radiation source, while departing the area shows the expected decrease, unlike an isolate spike in readings. See the second photo below for a closer look:![city_airq_webdata_3]()
![city_airq_webdata_4]()
I'm definitely curious about the elevated radiation readings in that area, while the numbers are not big, there must be a cause, especially given the increased detection distance. Here the sensitive Geiger detector played its role. I will research the phenomenon further and report back with more details. -
The software
11/09/2015 at 00:30 • 0 commentsThere are three software components. One is the firmware running on the device, then a mobile application running on the smartphone (most likely an Android app) and finally the server side software that receives the data via HTTP Post, stores it in a mysql database and draws a heatmap for the frontend. The firmware is mostly focused on the sensors drivers and reading the data, the mobile app works as a relay getting the data over bluetooth and sending it to the server (the phone is a good solution for Internet connectivity) and the server component shows the results in a visual form.
Here are a few pictures showing a mobile app I wrote, that works as a Bluetooth relay, taking the data from the sensor unit and sending it only to the server:
![city_airq_android]()
It's obvious this was designed for Android OS, with a nice Bluetooth discovery option, a connect button, and lots of text boxes for showing sensors output. There are even 3 buttons to control the unit, the shutdown, and two for audio effects since the sensor board, based on uRADMonitor-D, also has a speaker: https://hackaday.io/project/4977-portable-environmental-monitor
City Air Quality
Developing hardware to track and assert the air quality in a city based on IOT topology.
 Radu Motisan