Close
0%
0%

"hatching" vectorizer

my crazy ideas of how an raster-image to vector-image converter (with a pen plotter in mind) with artistic contents may look like

Similar projects worth following
Computer screens and printers visualize everything in a rasterized form. A few months ago I came across the world of vintage flat bed pen plotters. Steppermotors move a pen over paper. An electromagnet pushes it down. To create nice drawings with such a device, raster images are completely useless - vector images are needed. The Autocad Spaceshuttle is a nice thing to plot.

As most images you can find on the interwebs are raster images and even vector images do not fit the pen plotter very well (there is no such thing like a filled polygon) I went on my quest of creating an algorithm (or a bunch of small code snippets) that converts an raster image into a few thousand strokes with pens of different color and width.

Known work:

There are various vectorizer tools and algorithms available (e.g. Inkscape includes some). Lots of papers describing fancy algorithms show up if you dig deep enough. The readily available solutions do not fit my problem, as they create filled polygons. Work on these results means to read and "understand" the existing vector graphic and transform it in another vector graphic that only contains lines. The scientific papers, filled with matrices, high level math and no available actual source code implementation are nice for inspiration, but I am just too lazy to fully understand these, convert these papers to actual code, run and debug it and then find out that it does not fit my problem (where would be the fun part?)... but a great inspirational source.

The closest thing to what I want as a result is described in the Eggbot wiki over at evilmadscientists:

But I don't want evenly spaced lines, the "hatching" look is what I am after. Lines should follow contours. Darker areas should use tighter line spacing.

Current status (mid-feb 2016):

For now, I've already implemented some nice algorithms that are easy to understand and just use basic programming stuff. Images are 2d arrays that contain an RGB-value at each entry, everything else consists of lists and variables. No fancy math formulas, laplace transforms etc. to show off my brainpower - basic algorithms mixed with (hopefully) smart ideas. No multithreaded worker-thread-kung-fu. This results in slow code execution and overhead, but increases flexibility and comprehensiveness. After all, if van_gogh.exe works, and it is slow, it should not be too hard to boost the performance by some optimizations or just take the concept and re-implement it in matlab...

Ok, so...?

The plan is to describe single puzzle parts that do something with image data in the project log and show some example pics along the way. These should base on the output of the previous puzzle part(s) and "enhance" it by some way, e.g. extract information or combine information for conclusions. Finally there should be some puzzle parts that take all that extracted information and draw lines on a virtual surface (and in an HPGL file to feed a pen plotter :).

Watch out for a median filter implementation that also extracts contours, or a "motion vector" (ok, its just a delta-x, delta-y) extraction and interpolation thingy, a line following, mountain climbing bot and propably more.

  • line following "robot"

    rawe03/20/2016 at 21:06 5 comments

    With the median filter/edge detection from the previous log the following two images can be generated from the hackaday logo...


    median edge (=cleanup + edge detection)median (=cleanup of jpg artifacts)

    For the edge picture, it is possible to implement a simple line following "robot" that operates by the following principle:

    - for all the steps the "line following robot" makes,
      keep track of them
    - find brightest point in image and move/drop/spawn there
    - mark point as "already visited" by painting it black
      (draw small black filled circle)
    - for -180° to +180° (relative to the current heading) 
      with a distance d from current position,
      sweep around and check where the brightest spot is,
      head there. and move one step with distance d.
      mark point as "already visited". repeat.
      If there is no brightest point near the current location,
      globally find the brightest point and start all over,
      keeping the "already visited" marks.
    With the state drawn every step the "line following robot" takes, it is possible do render a series of images and combine them into a video to see the bot in action.

    Left: Paths the robot went, Right: Input/playground/temporary image:


    Letting the same algorithm run on the filled image, and modifying the "line detection" to sweep from left to right and use the FIRST occurence of a bright point around, it will crawl along the edges.

    Note that as soon as the bot crawled along an edge and marked the area as "already visited" by drawing black filled circles there, the edge is slightly distorted and the errors will add up for every new pass the bot takes in my current implementation. Varying the "already visited" pattern, the logic that re-sets the bot once it went into a dead end and the logic it uses to determine where to crawl, it is possible to create various patterns. Not perfect, but a nice starting point. Marking the already-visited points by altering a copy of the input image limits the algorithm to the image resolution, but allows a simple algorithm that does not get slower over time (e.g. collecting and comparing all the "already visited" points in a list, for each visited point one more would need to be checked each time the bot plans a move).

    HPGL is a vector image format once used by Hewlet-Packard pen plotters, test equipment, network analyzers (e.g. HP8753). There are only three commands to do basic stuff:

    SP1 = select pen number 1
    PU123,456 = lift pen and go to absolute coordinate x|y=123|456
    PD789,123 = put pen on paper and go to x|y=789|123

    Of course, the HPGL format supports much more (text, splines, dotted lines and other features). For a full-blown viewer try the CERN HPGL Viewer ( http://service-hpglview.web.cern.ch/service-hpglview/ ).

    As the points the bot visited were stored in a list, it is easy to generate HPGL commands out of them and feed them to a pen plotter. It is possible to do an simulated pen plotter by just interpreting the commands and setting pixels in a bitmap:

    Right now, filling is just a quick hack and needs improvement. There are much more points in there than necessary. Paths can be combined (if end-start, start-start or end-end are near each other) and certain intermediate points can be omitted. More on this in a followup log...
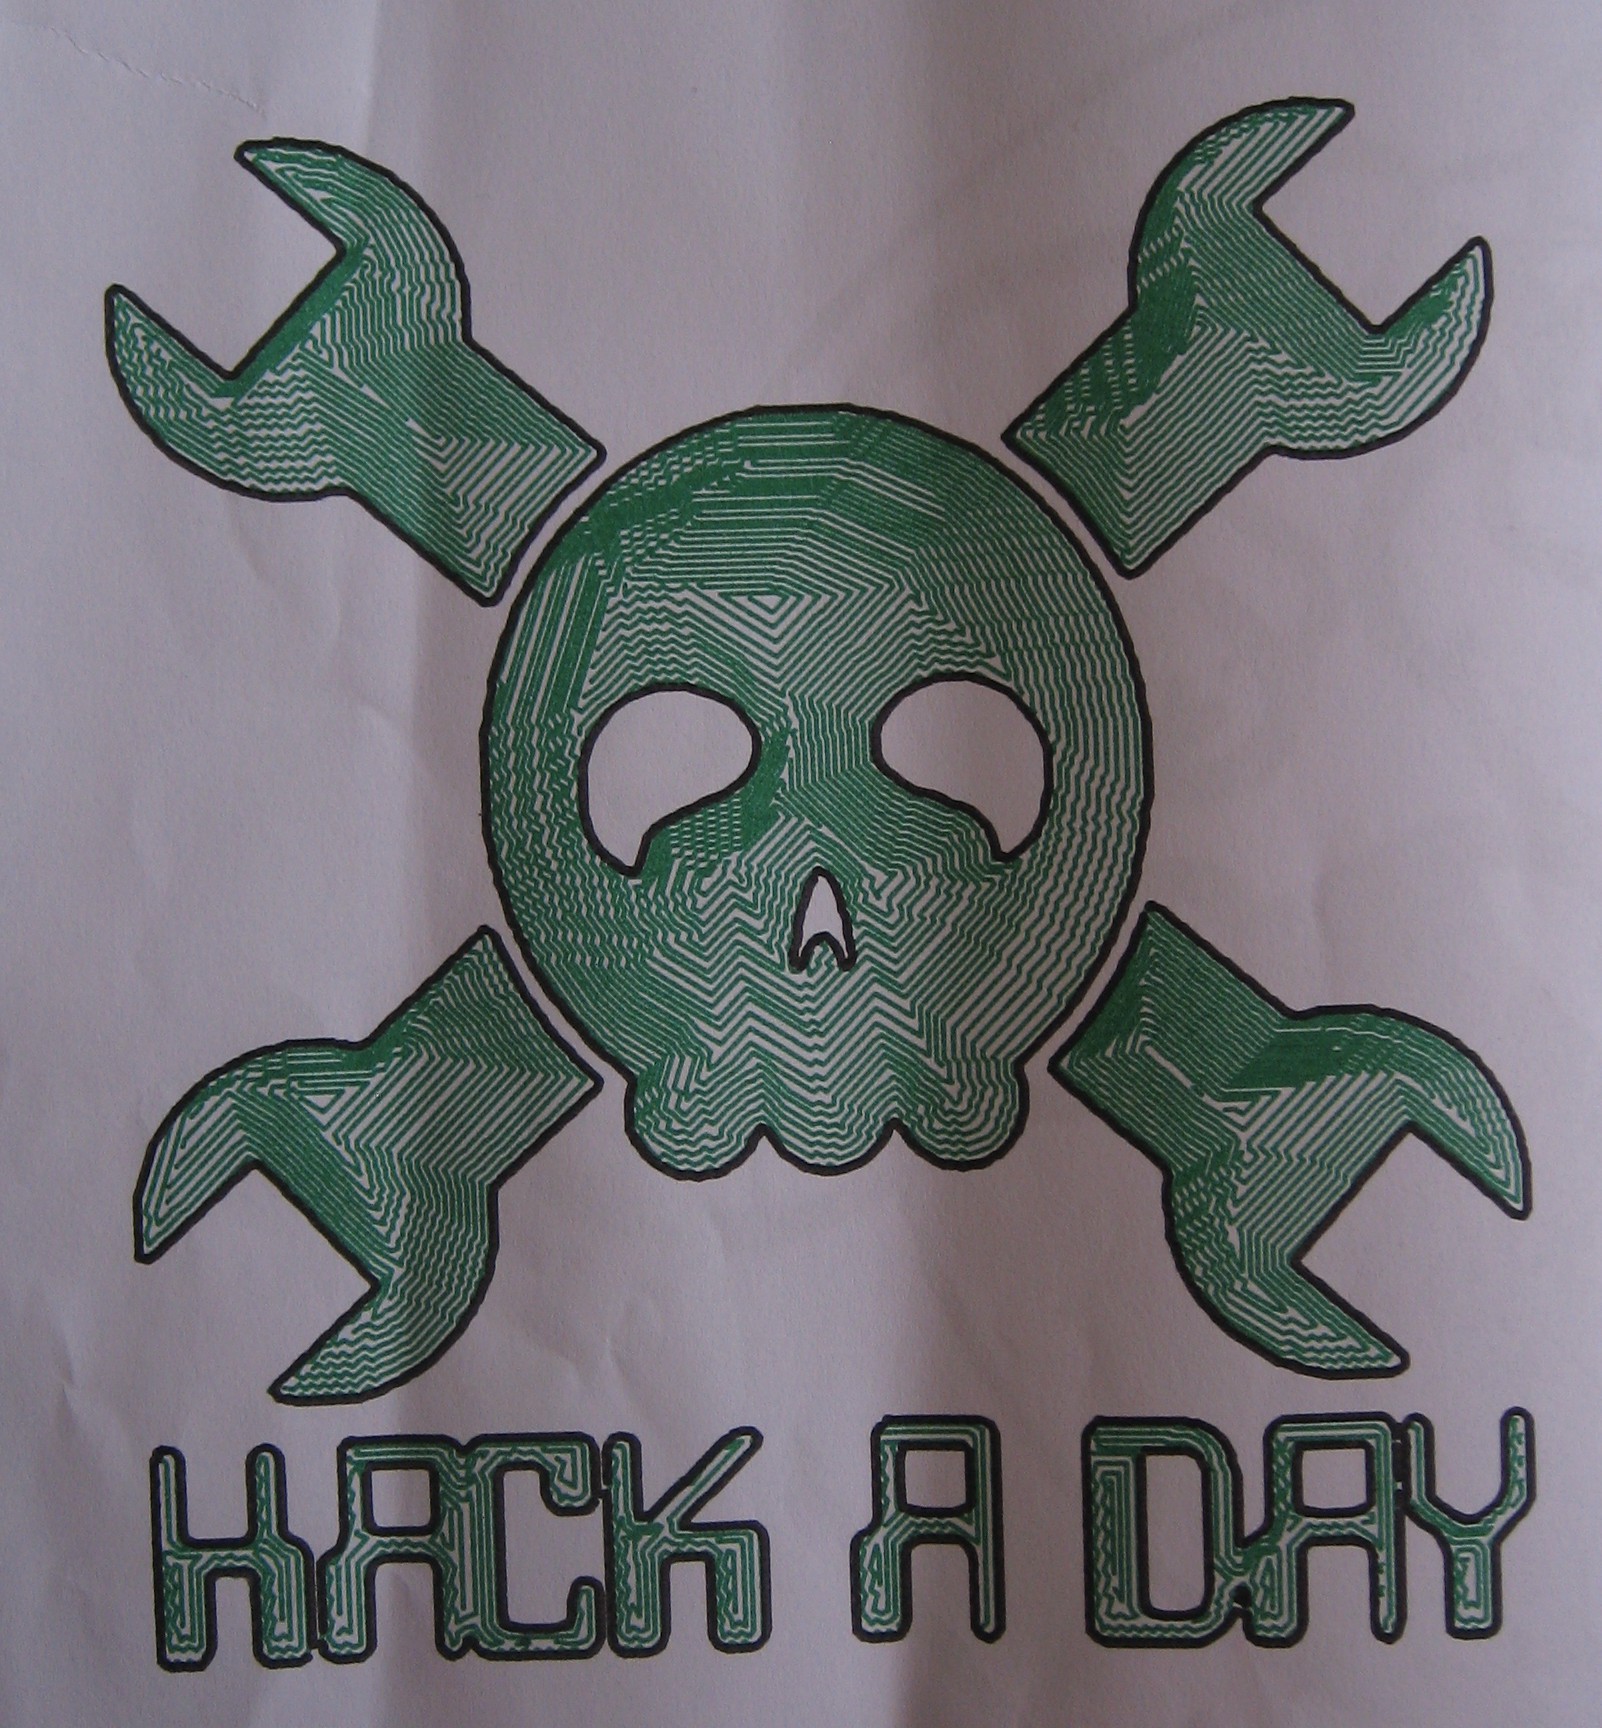

    EDIT/Update: pen plotted:

  • median filter & edge finder

    rawe02/23/2016 at 20:30 0 comments

    I've used the median filter in IrfanView for years to remove noise from high-res text scans, but never thought about how it works. As it turns out, a median filter works more or less like a blur filter.

    A raster image consists of pixels that encode a color for a specific coordinate in 2D space / 2D array. A new / filtered image is created by taking pixels from the old image, doing some math with it to calculate a new color and setting the pixel in a new image to that color. Repeat this with all pixels in an image and a whole, filtered image appears. For simplicity, only greyscale images are used for now, simplified pseudocode is used.

    A simple blur filter takes the color values of the source pixel and its surroundings, calculate the average (maybe weighted by their distance to the source pixel for a larger blur (or std. deviation / Gauss...) or just the surrounding top/bottom/right/left pixels for a start) and set the target pixel value.

    Such an formula may look like...

    target[x][y] = (source[x][y]+source[x+1][y]+source[x-1][y]+source[x][y+1]+source[x][y-1])/5
    Original imageimage with blur

    Noise gets removed, but edges are blurred away, too. What about another function, similar to average... median function?

    If the same surrounding source pixels are taken, but instead of just calculating the average, they are sorted and the middle one (=median) is used? This gets rid of "unusual" values in this area. As a side effect, think about what happens if this is done on one or the other side of a sharp edge - yes, the edge is preserved - great!

    unsorted = list (source[x][y], source[x+1][y], source[x-1][y], source[x][y+1], source[x][y-1] )
    
    sorted = sort(unsorted)
    
    target[x][y] = sorted[ length(sorted) / 2 ]
    Original imagemedian filter

    The noise is gone and edges are still there. Ok, corners are a bit rounded - could be worse, ok for my planned use case.

    As there is already a sorted list to get the middle/median one, why not take the difference of the last and the first one and thread this value as "contrast in this area"?

    unsorted = list (source[x][y], source[x+1][y], source[x-1][y], source[x][y+1], source[x][y-1] )
    
    sorted = sort(unsorted)
    
    target[x][y] = sorted[last] - sorted[first]

    Borders detected. Note that the sharp borders are bright while the gradient in the background shows up grey-ish - so there is a contrast but a much lower one. On the upper left and lower right there is only one brightness in the source image, so the resulting "contrast" is low/black. The brightness correction of your screen (view from top/bottom) might come in handy here.

    Things get complex for different corner cases (namely left,right,upper and lower edges ;) as source pixel coordinates outside the source pixel have to be dealt with, or pixels along the border are not processed for the target image. Wrap around? Ignore? Multiple ways to go. In general, color versions of the algorithms above are not much difficult, just calculate the three R/G/B color channels for their own.

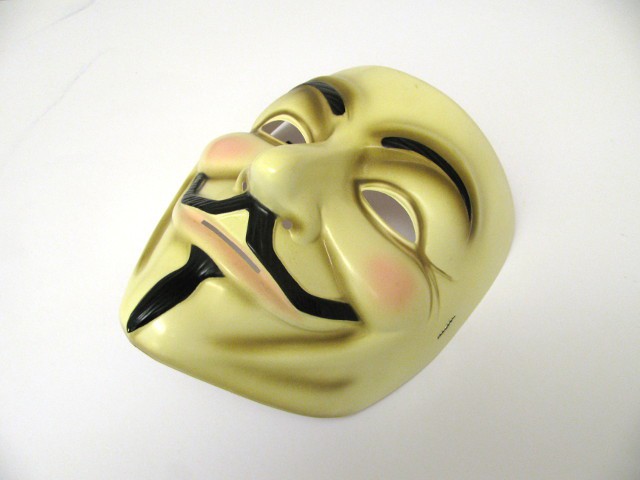
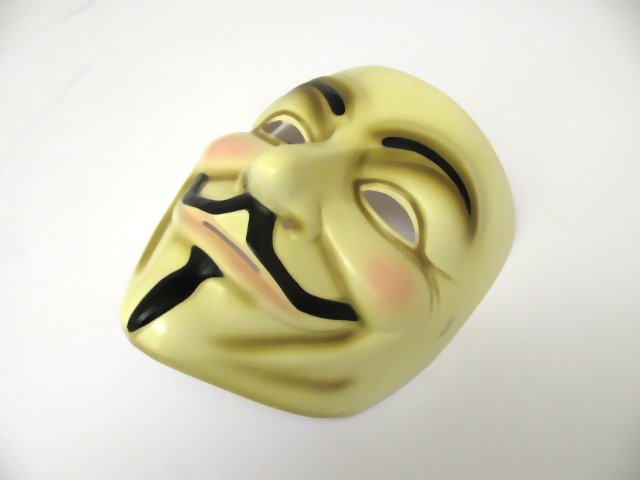
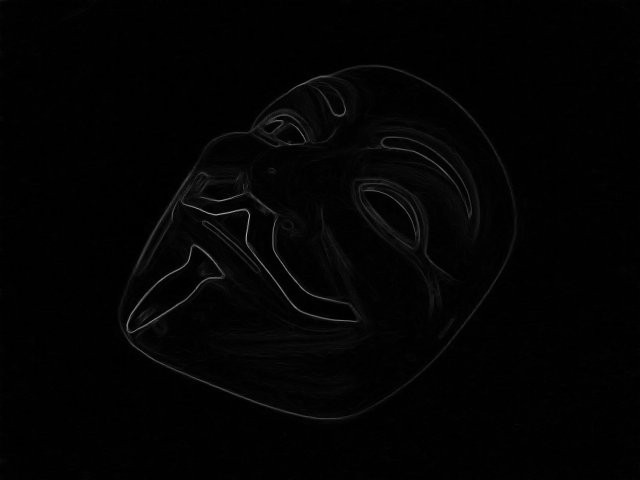
    Demo with bigger image - Input:

    Median filter:

    Median-by-product border filter:

View all 2 project logs

Enjoy this project?

Share

Discussions

Similar Projects

Does this project spark your interest?

Become a member to follow this project and never miss any updates