Michel Kuenemann
-
Second 10 KWh string put into service
05/02/2018 at 04:02 • 0 commentsI have added the second 10 KWh string to my setup by the beginning of April 2018.
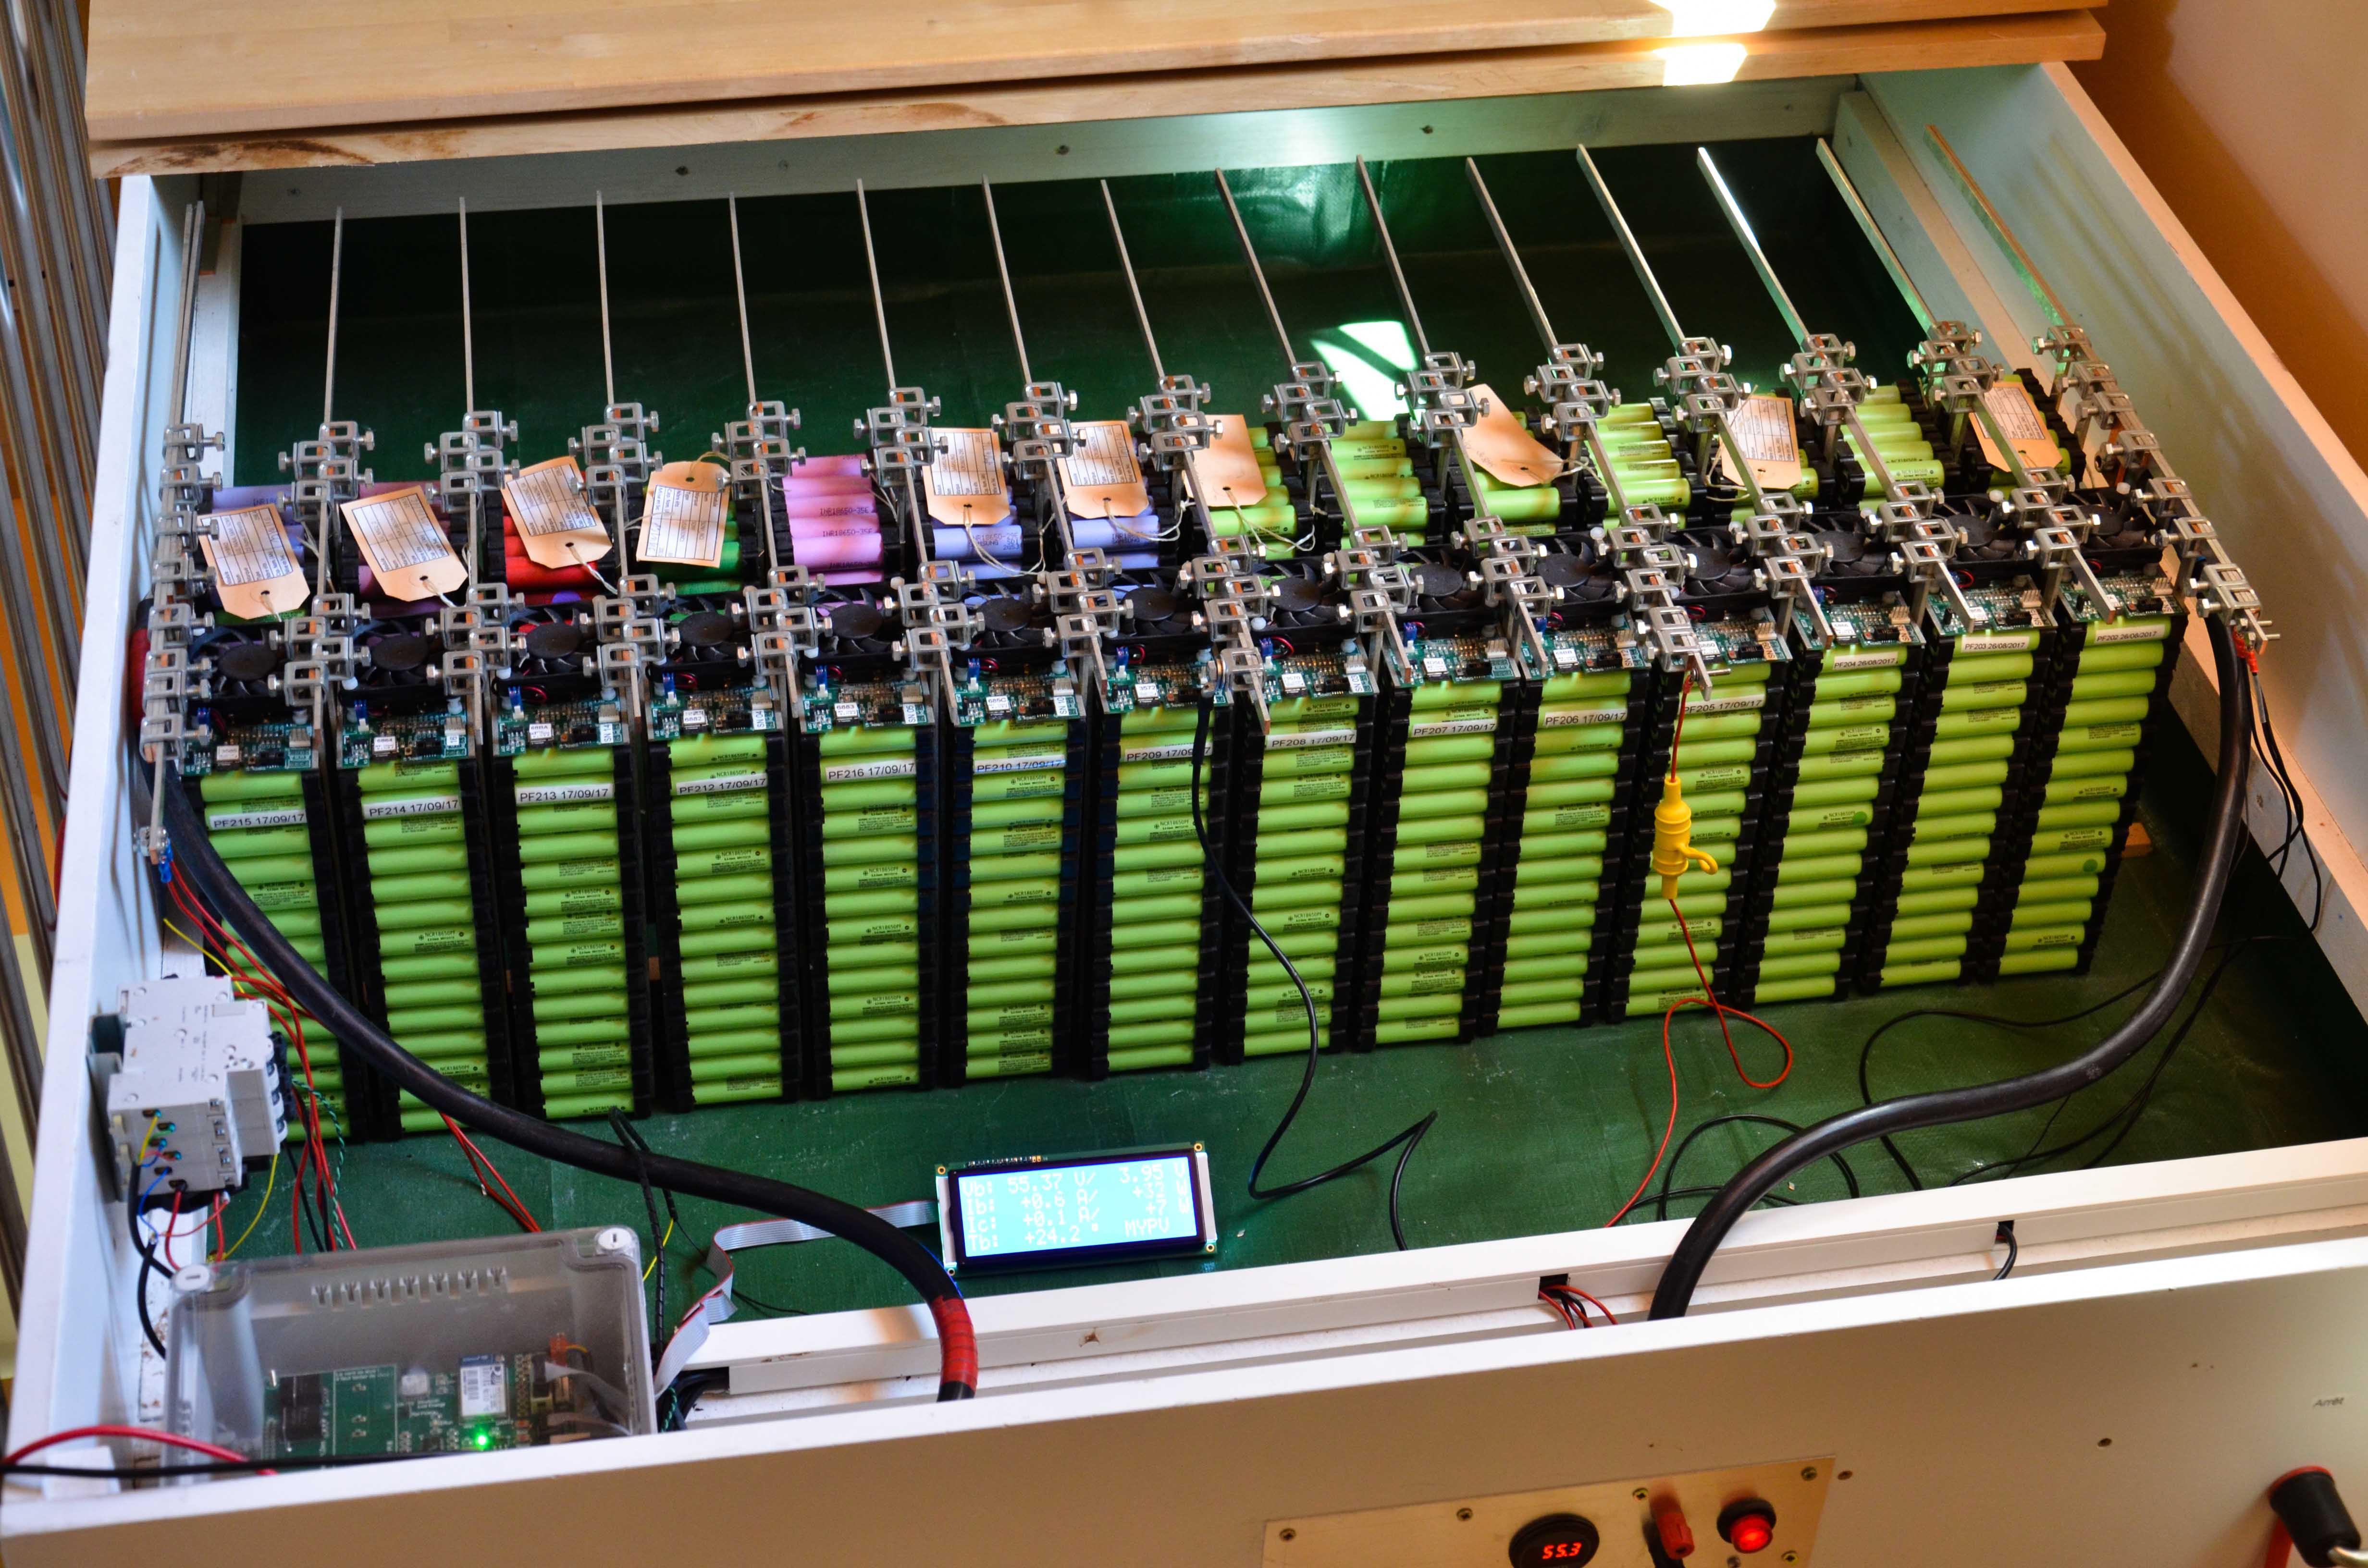
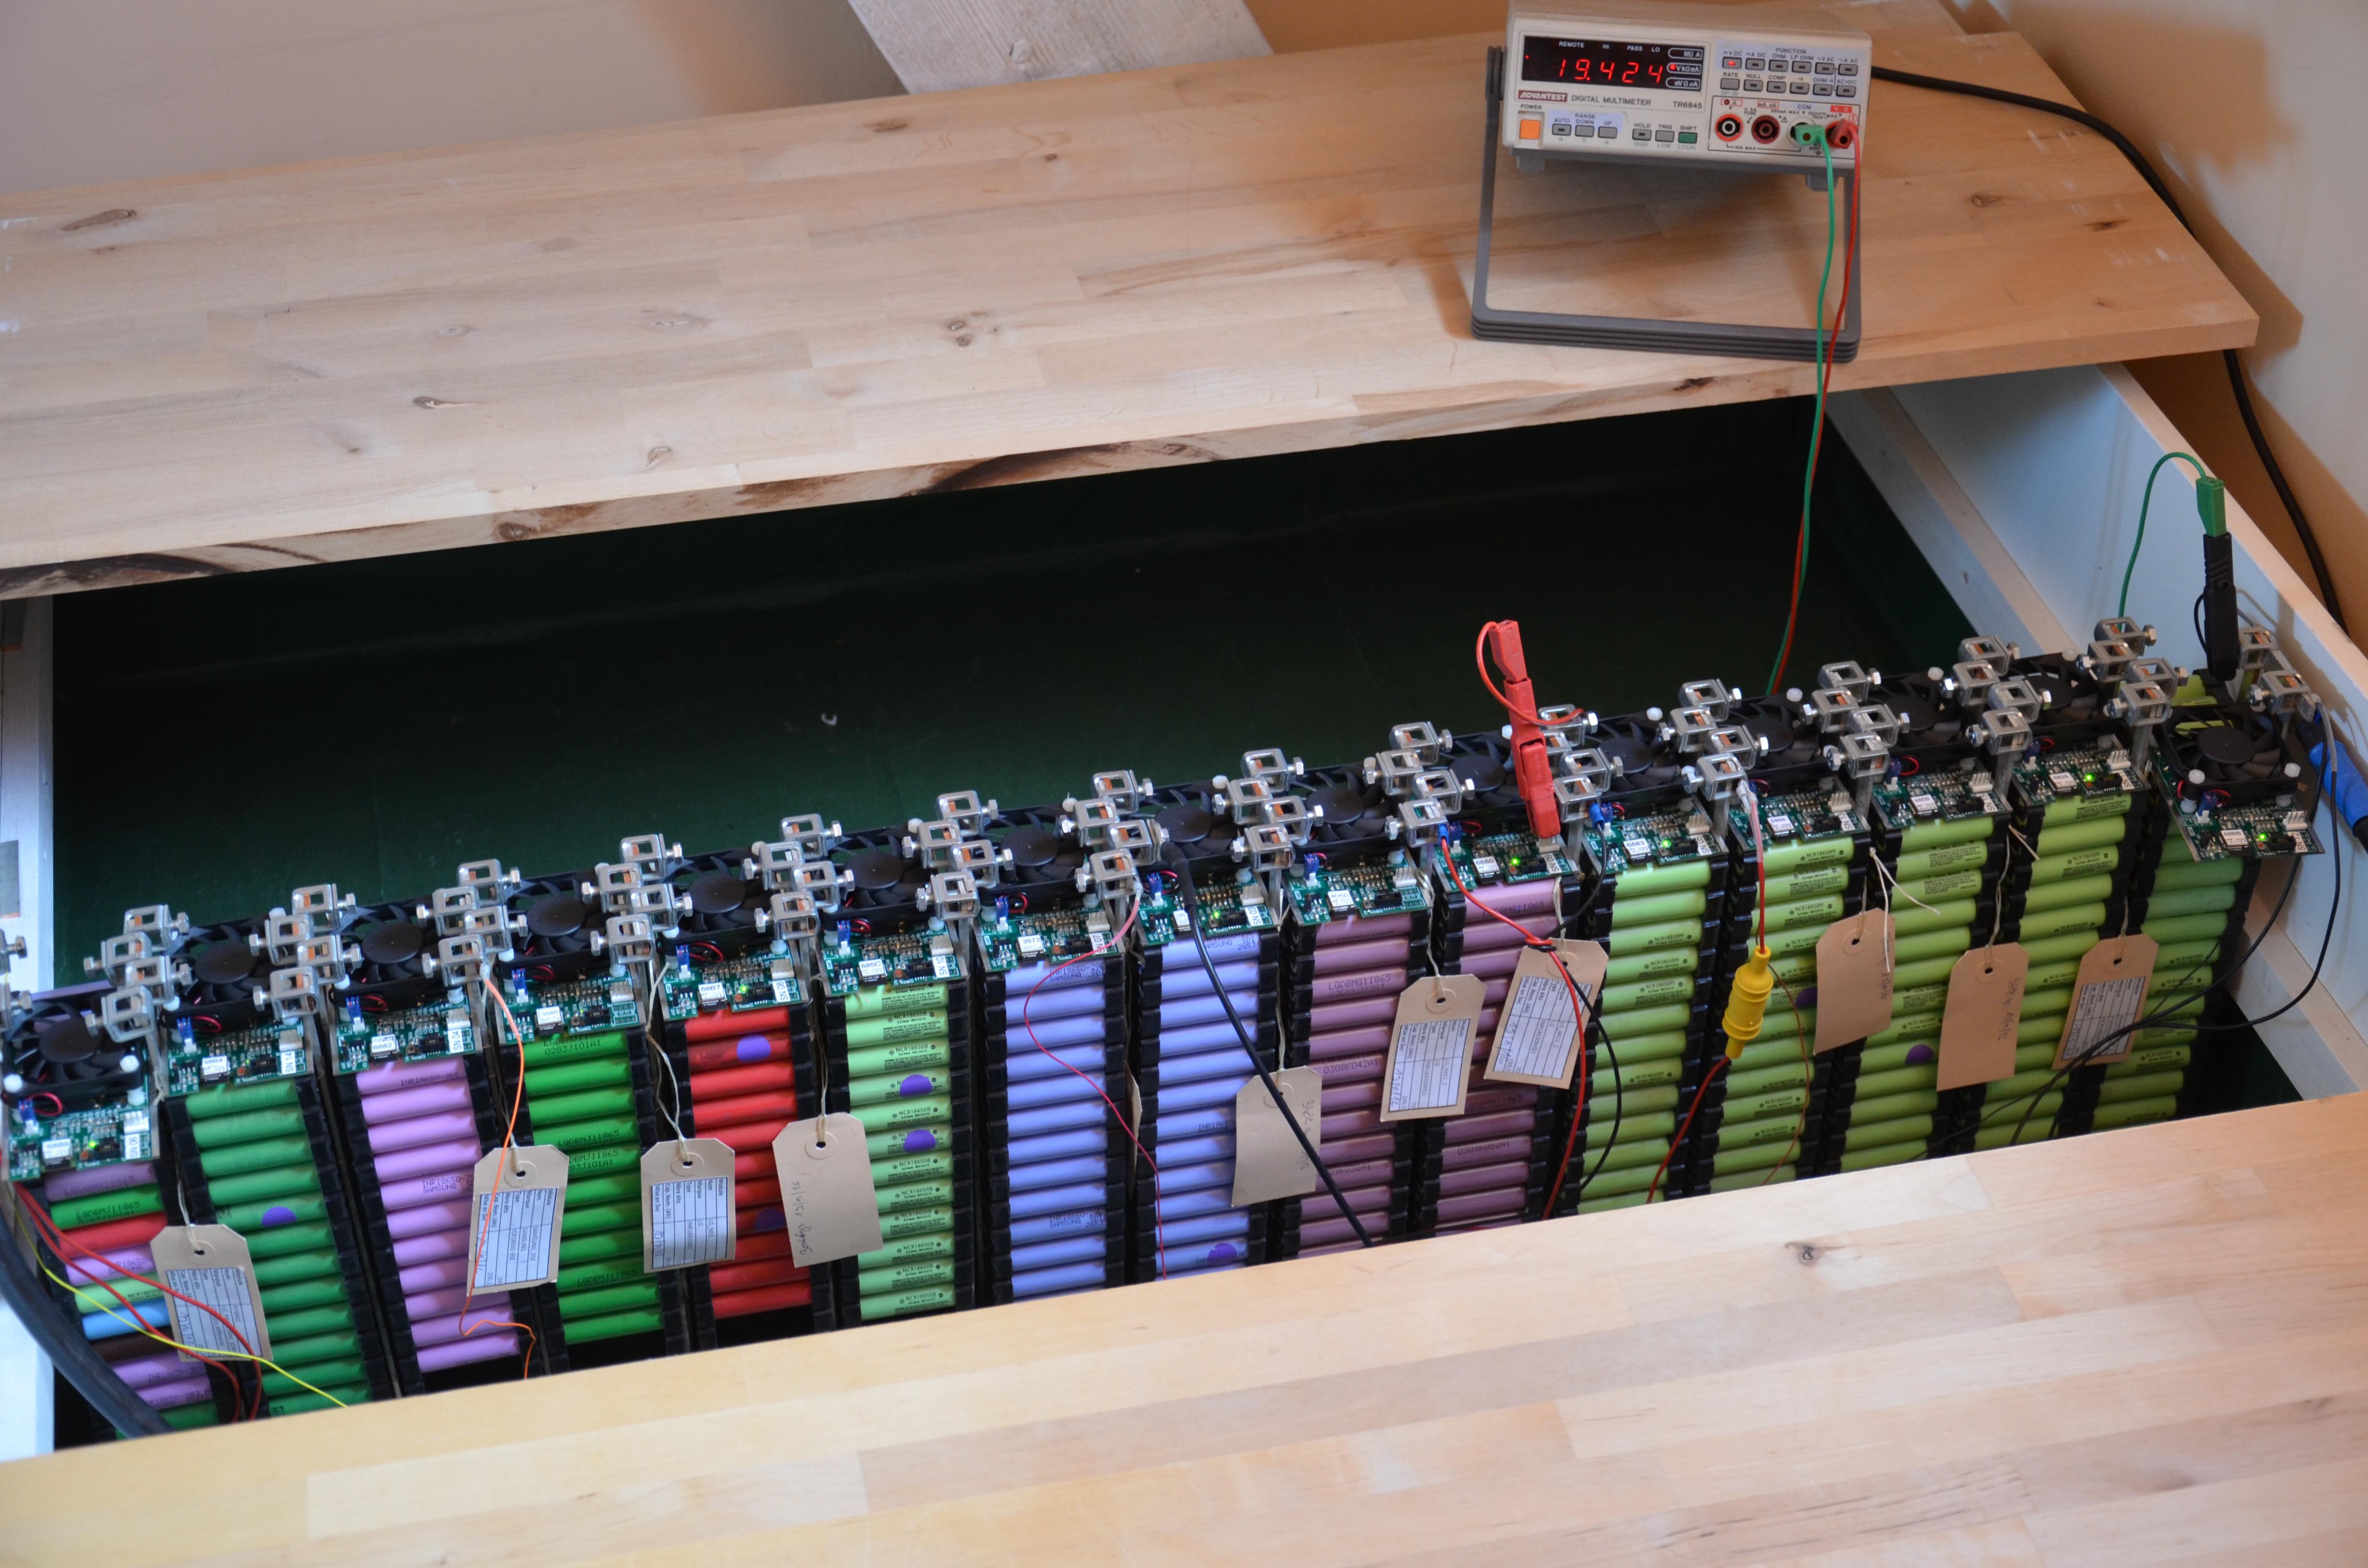
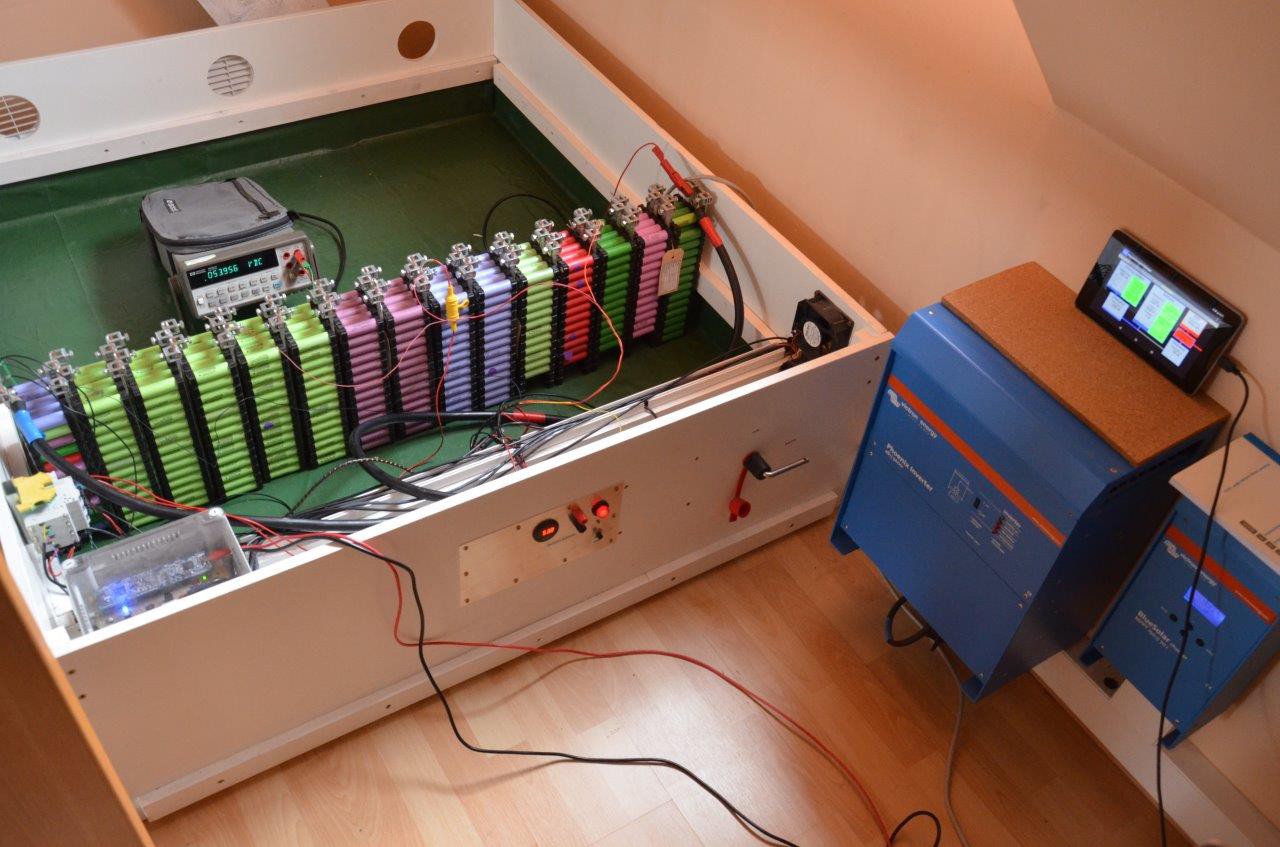
This string is made of 980 X Panasonic NCR18650PF's cells. You can see them in the foreground (the green cells).
The first string, made of various types of cells, sits behind. The complete battery is a 140P14S stack (1960 cells in total).
The long rods are tinned copper bus bars which insure the parallelization of the modules. As they are quite long, there is provision for addition of two more strings.
I have also added an LCD display that indicates Battery voltage, current and temperature as well as input / output powers.
Battery management is performed by my wireless modular BMS
This battery pack covers now 2 days of consumption. A third string is planned for addition this summer.
![]()
-
Phase 2: Adding a second 10 kWh string
08/27/2017 at 09:19 • 0 commentsI have purchased 1050 new PANASONIC NCR18650PF cells in order to add a second string to my PowerBucket.
PANASONIC NCR18650PF cells are very good and cost efficient 2900 mAh cells. They are a great choice for my application.
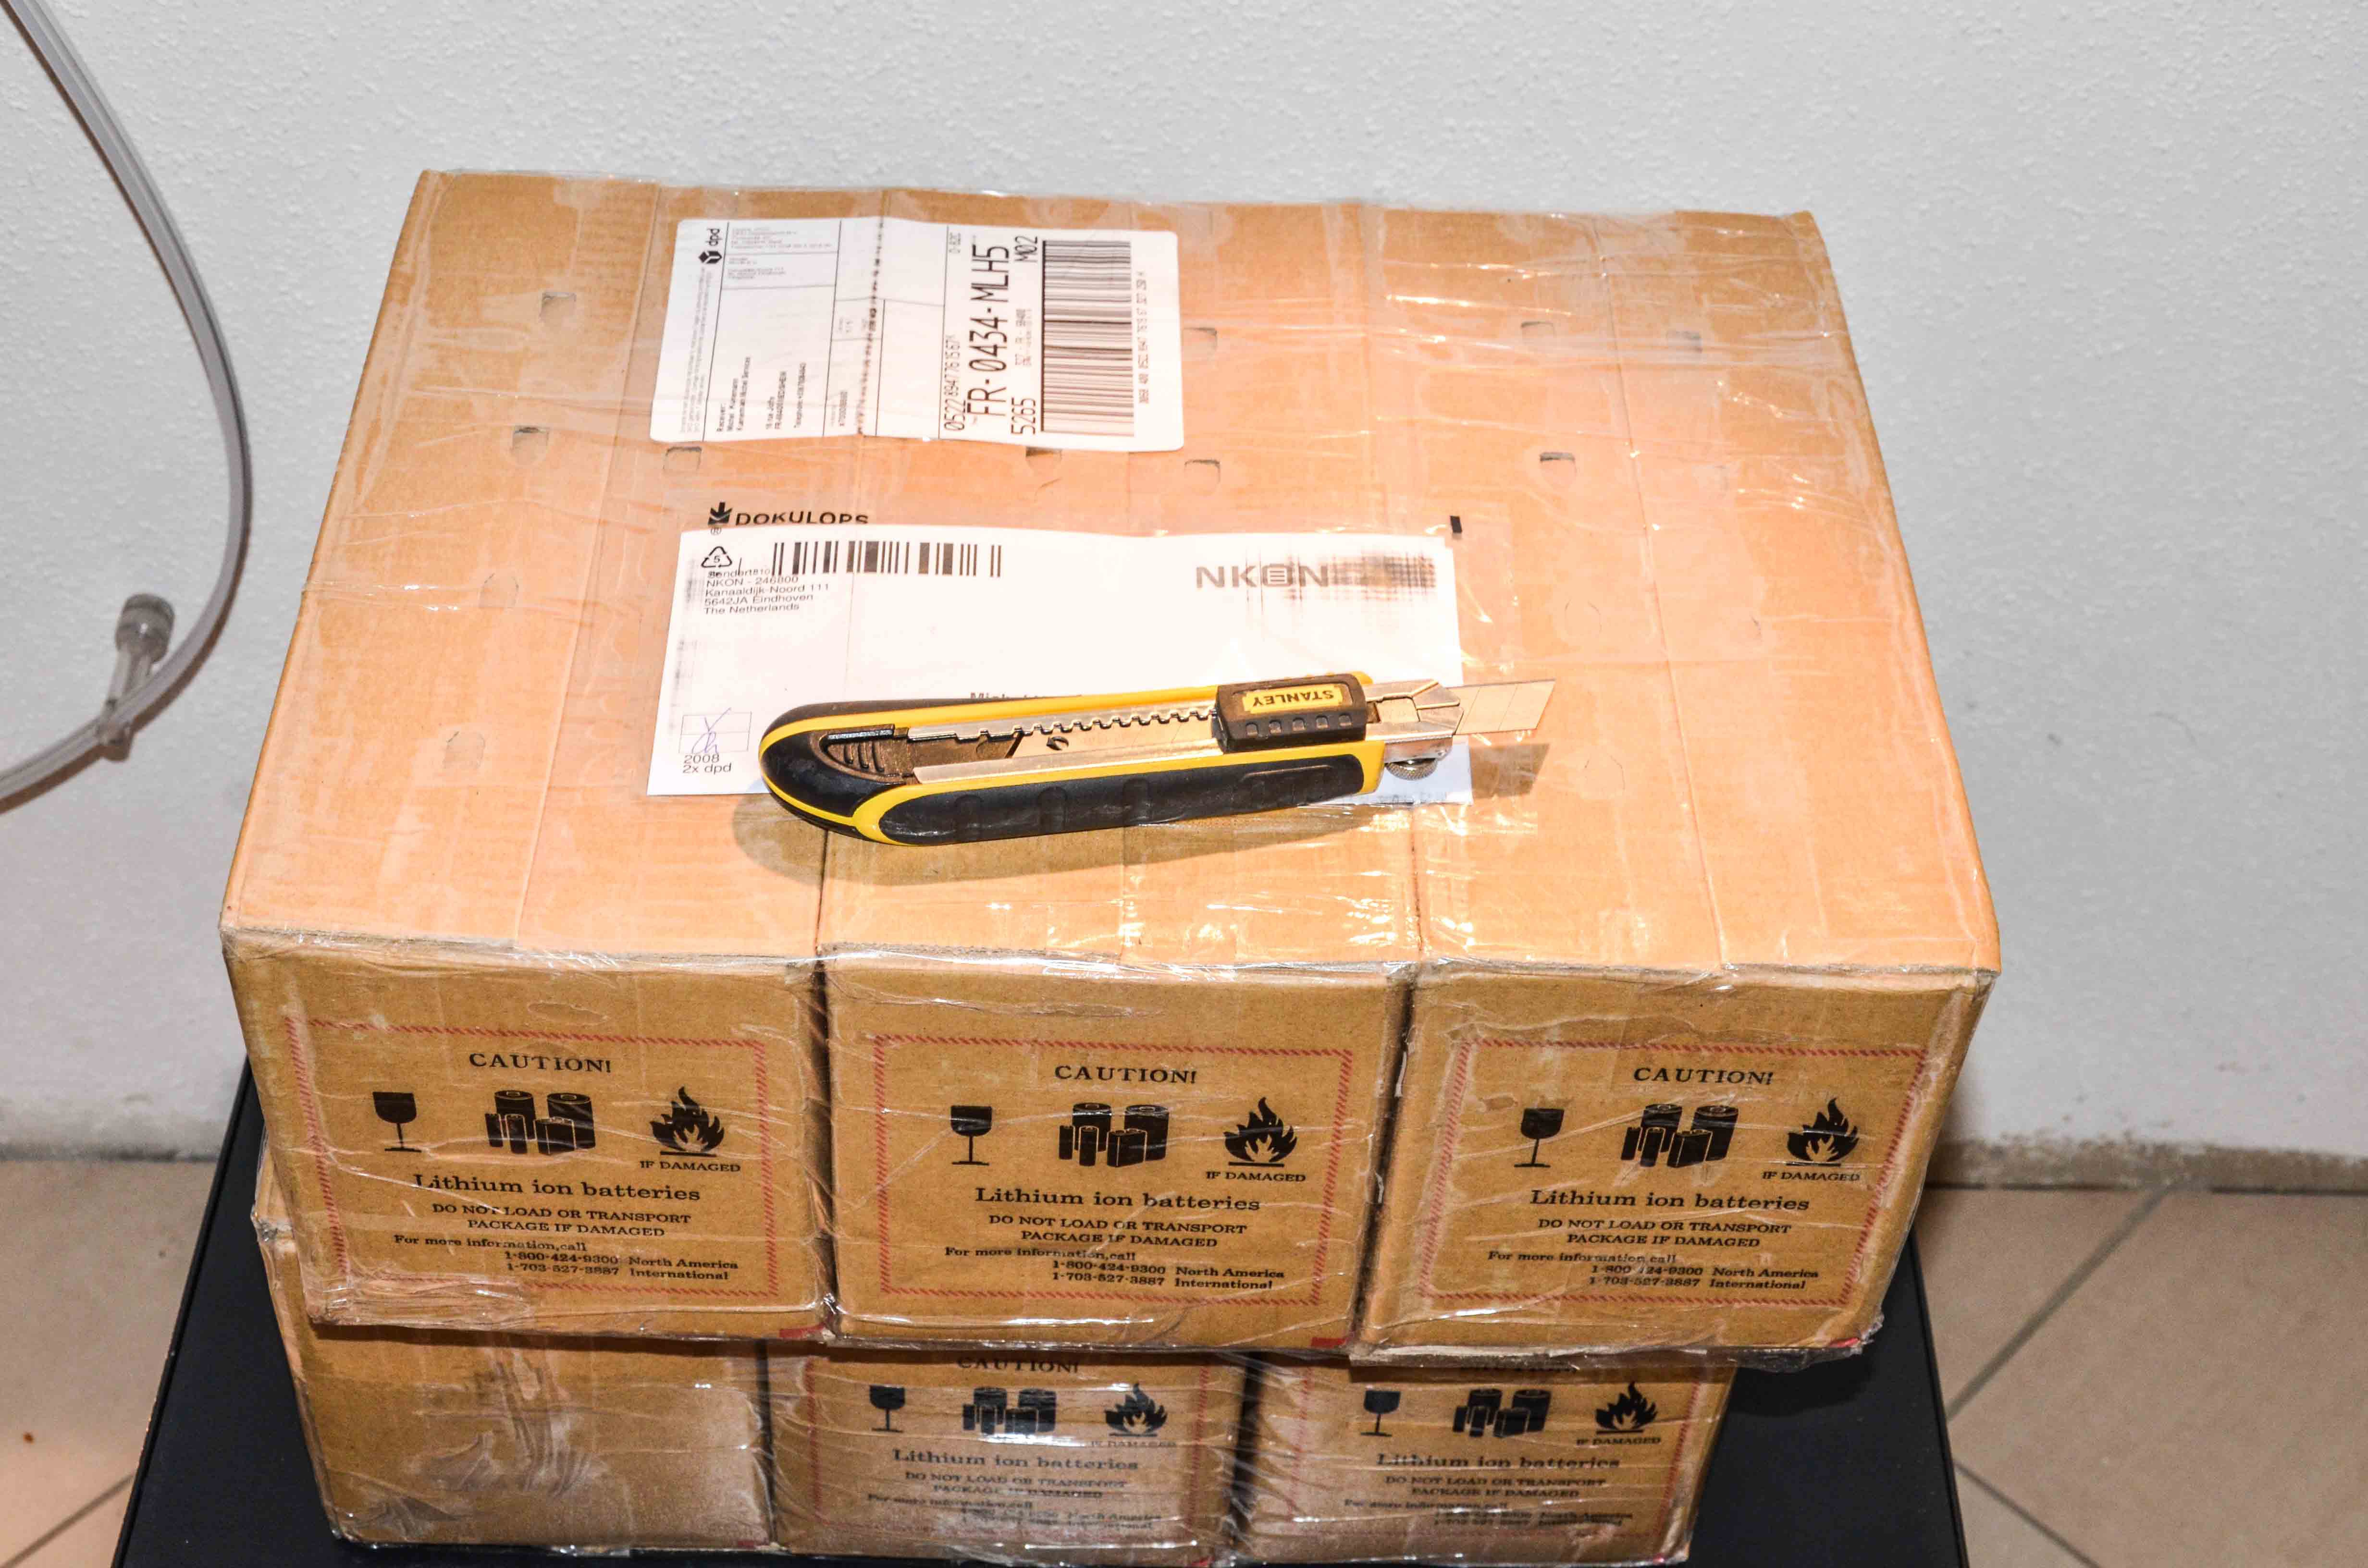
The cells were bought at NKON and were delivered them within a few days. Thanks you Arjan and congratulations !
2 Parcels delivered in perfect shape on Thursday, 24th August 2017. Each package weighs about 25 Kg.
![]()
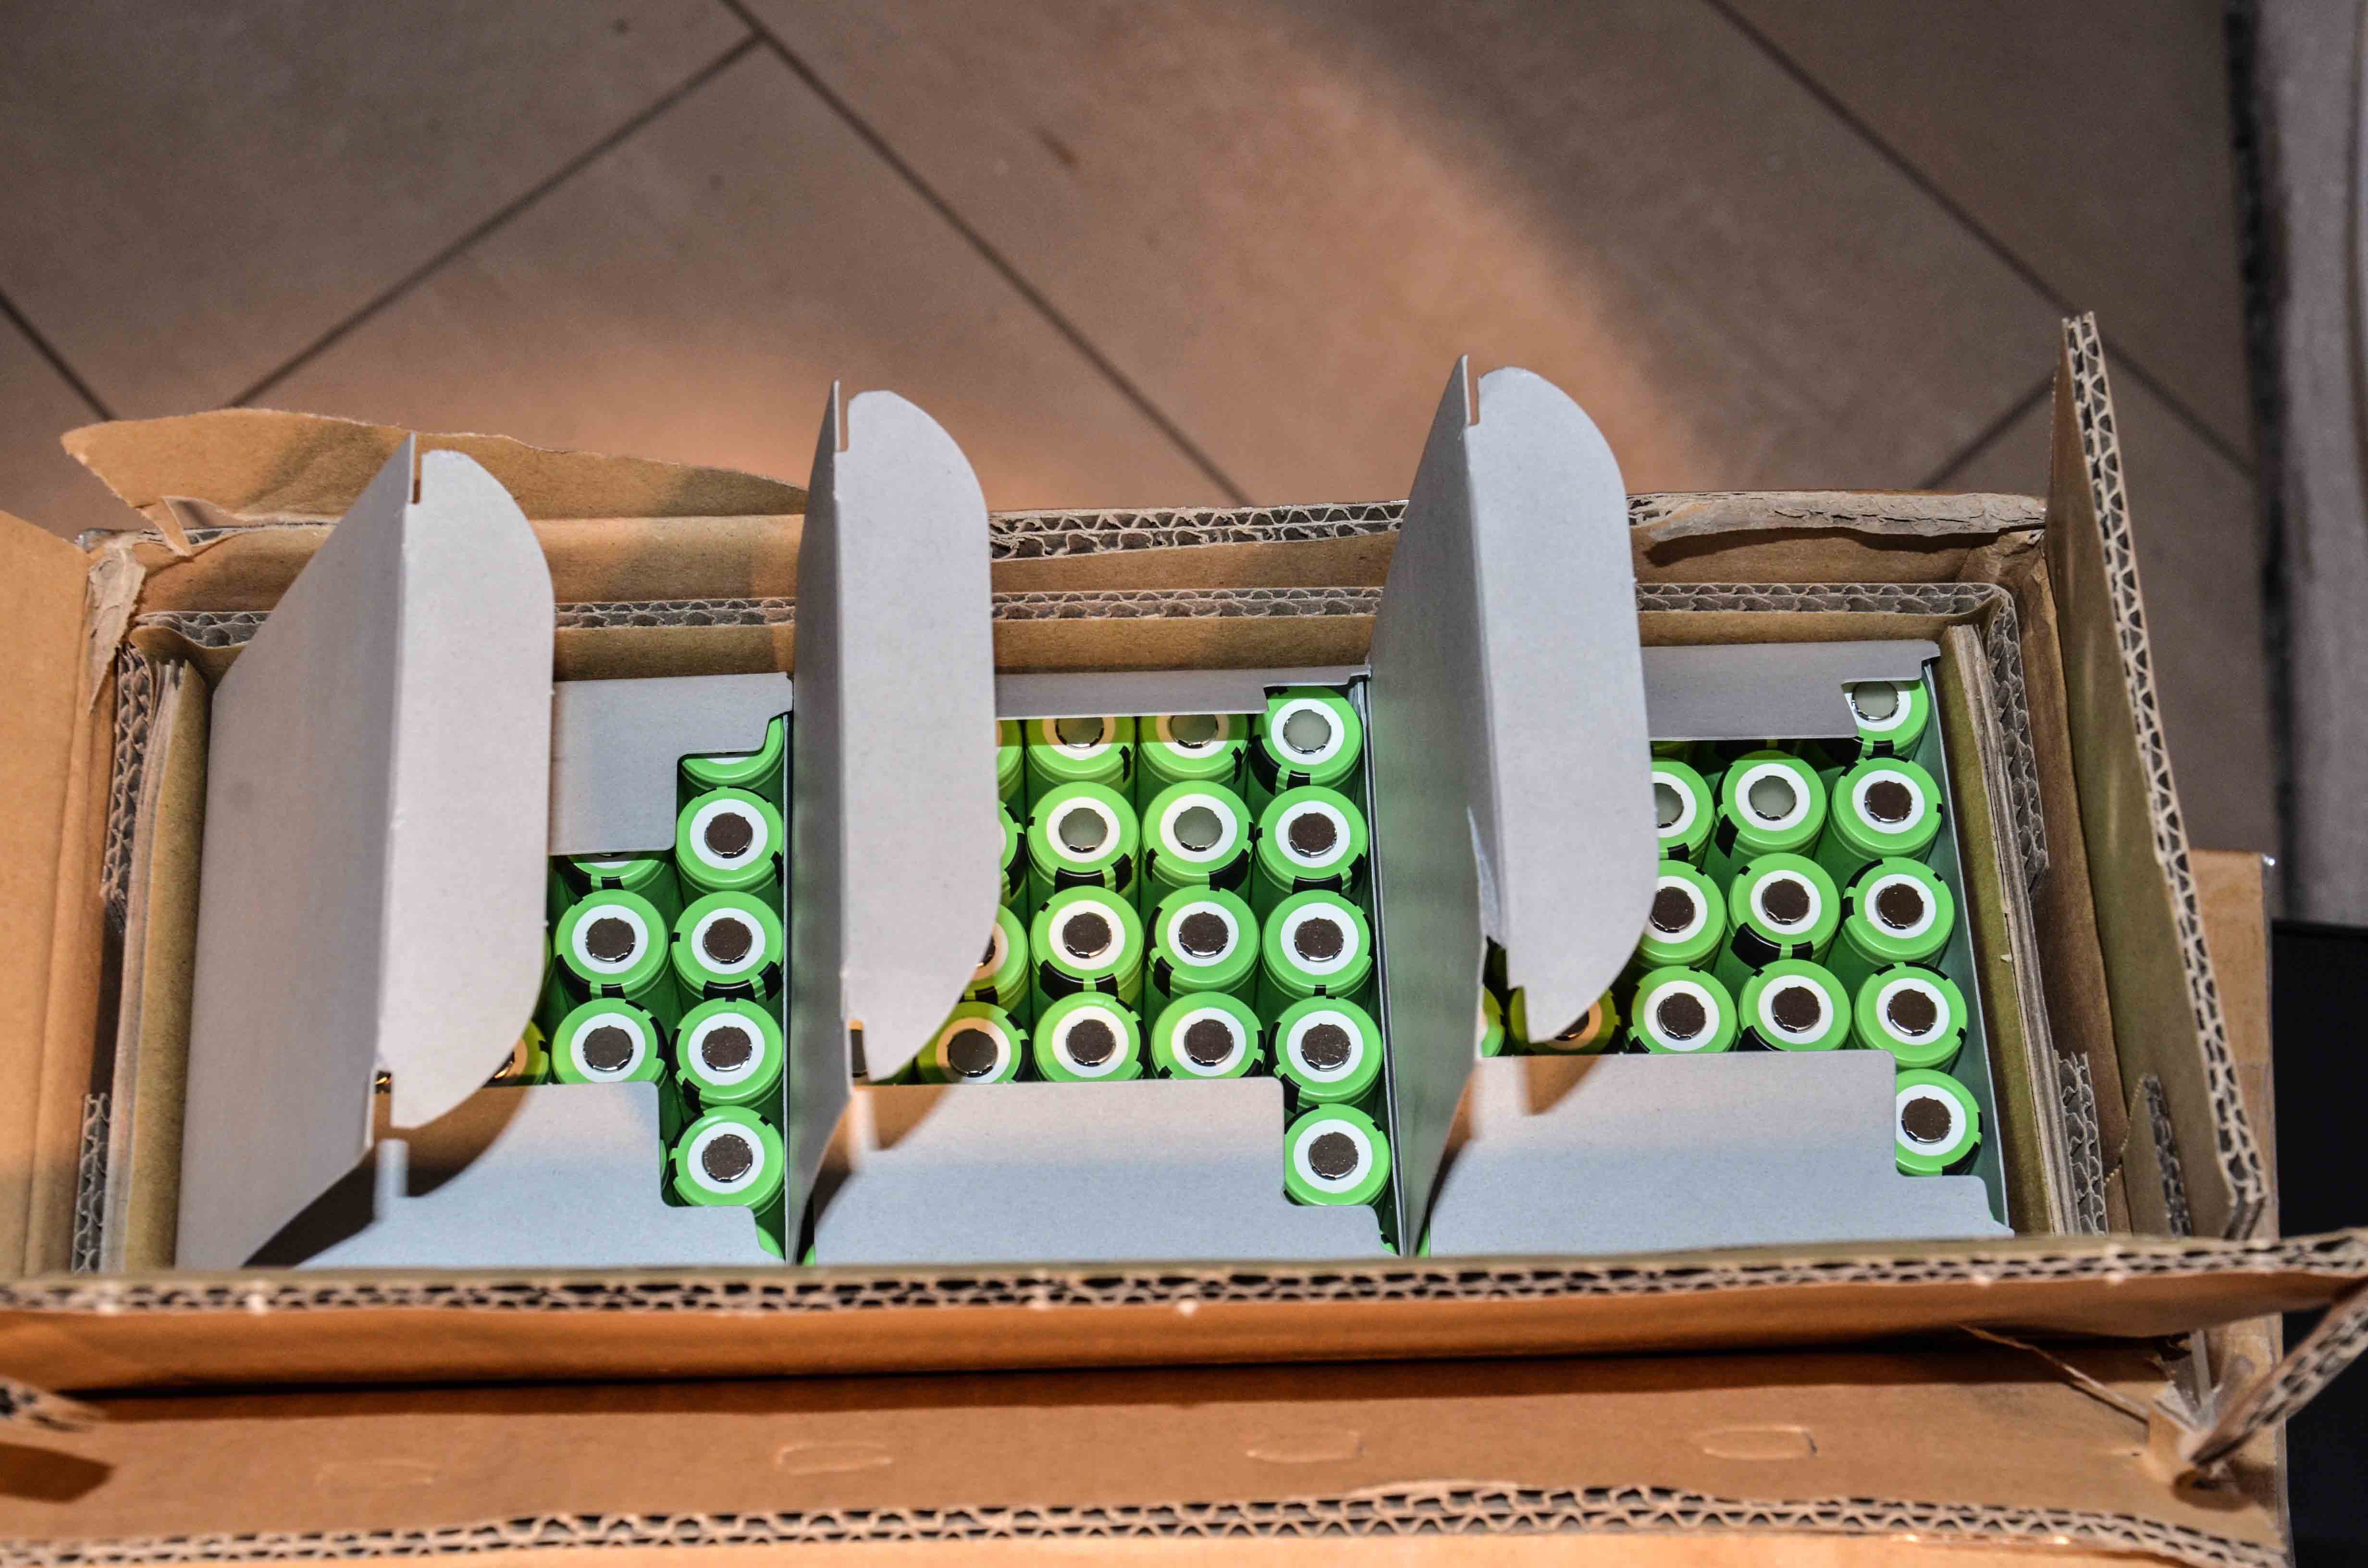
Brand new premium quality cells perfectly packed and protected
![]()
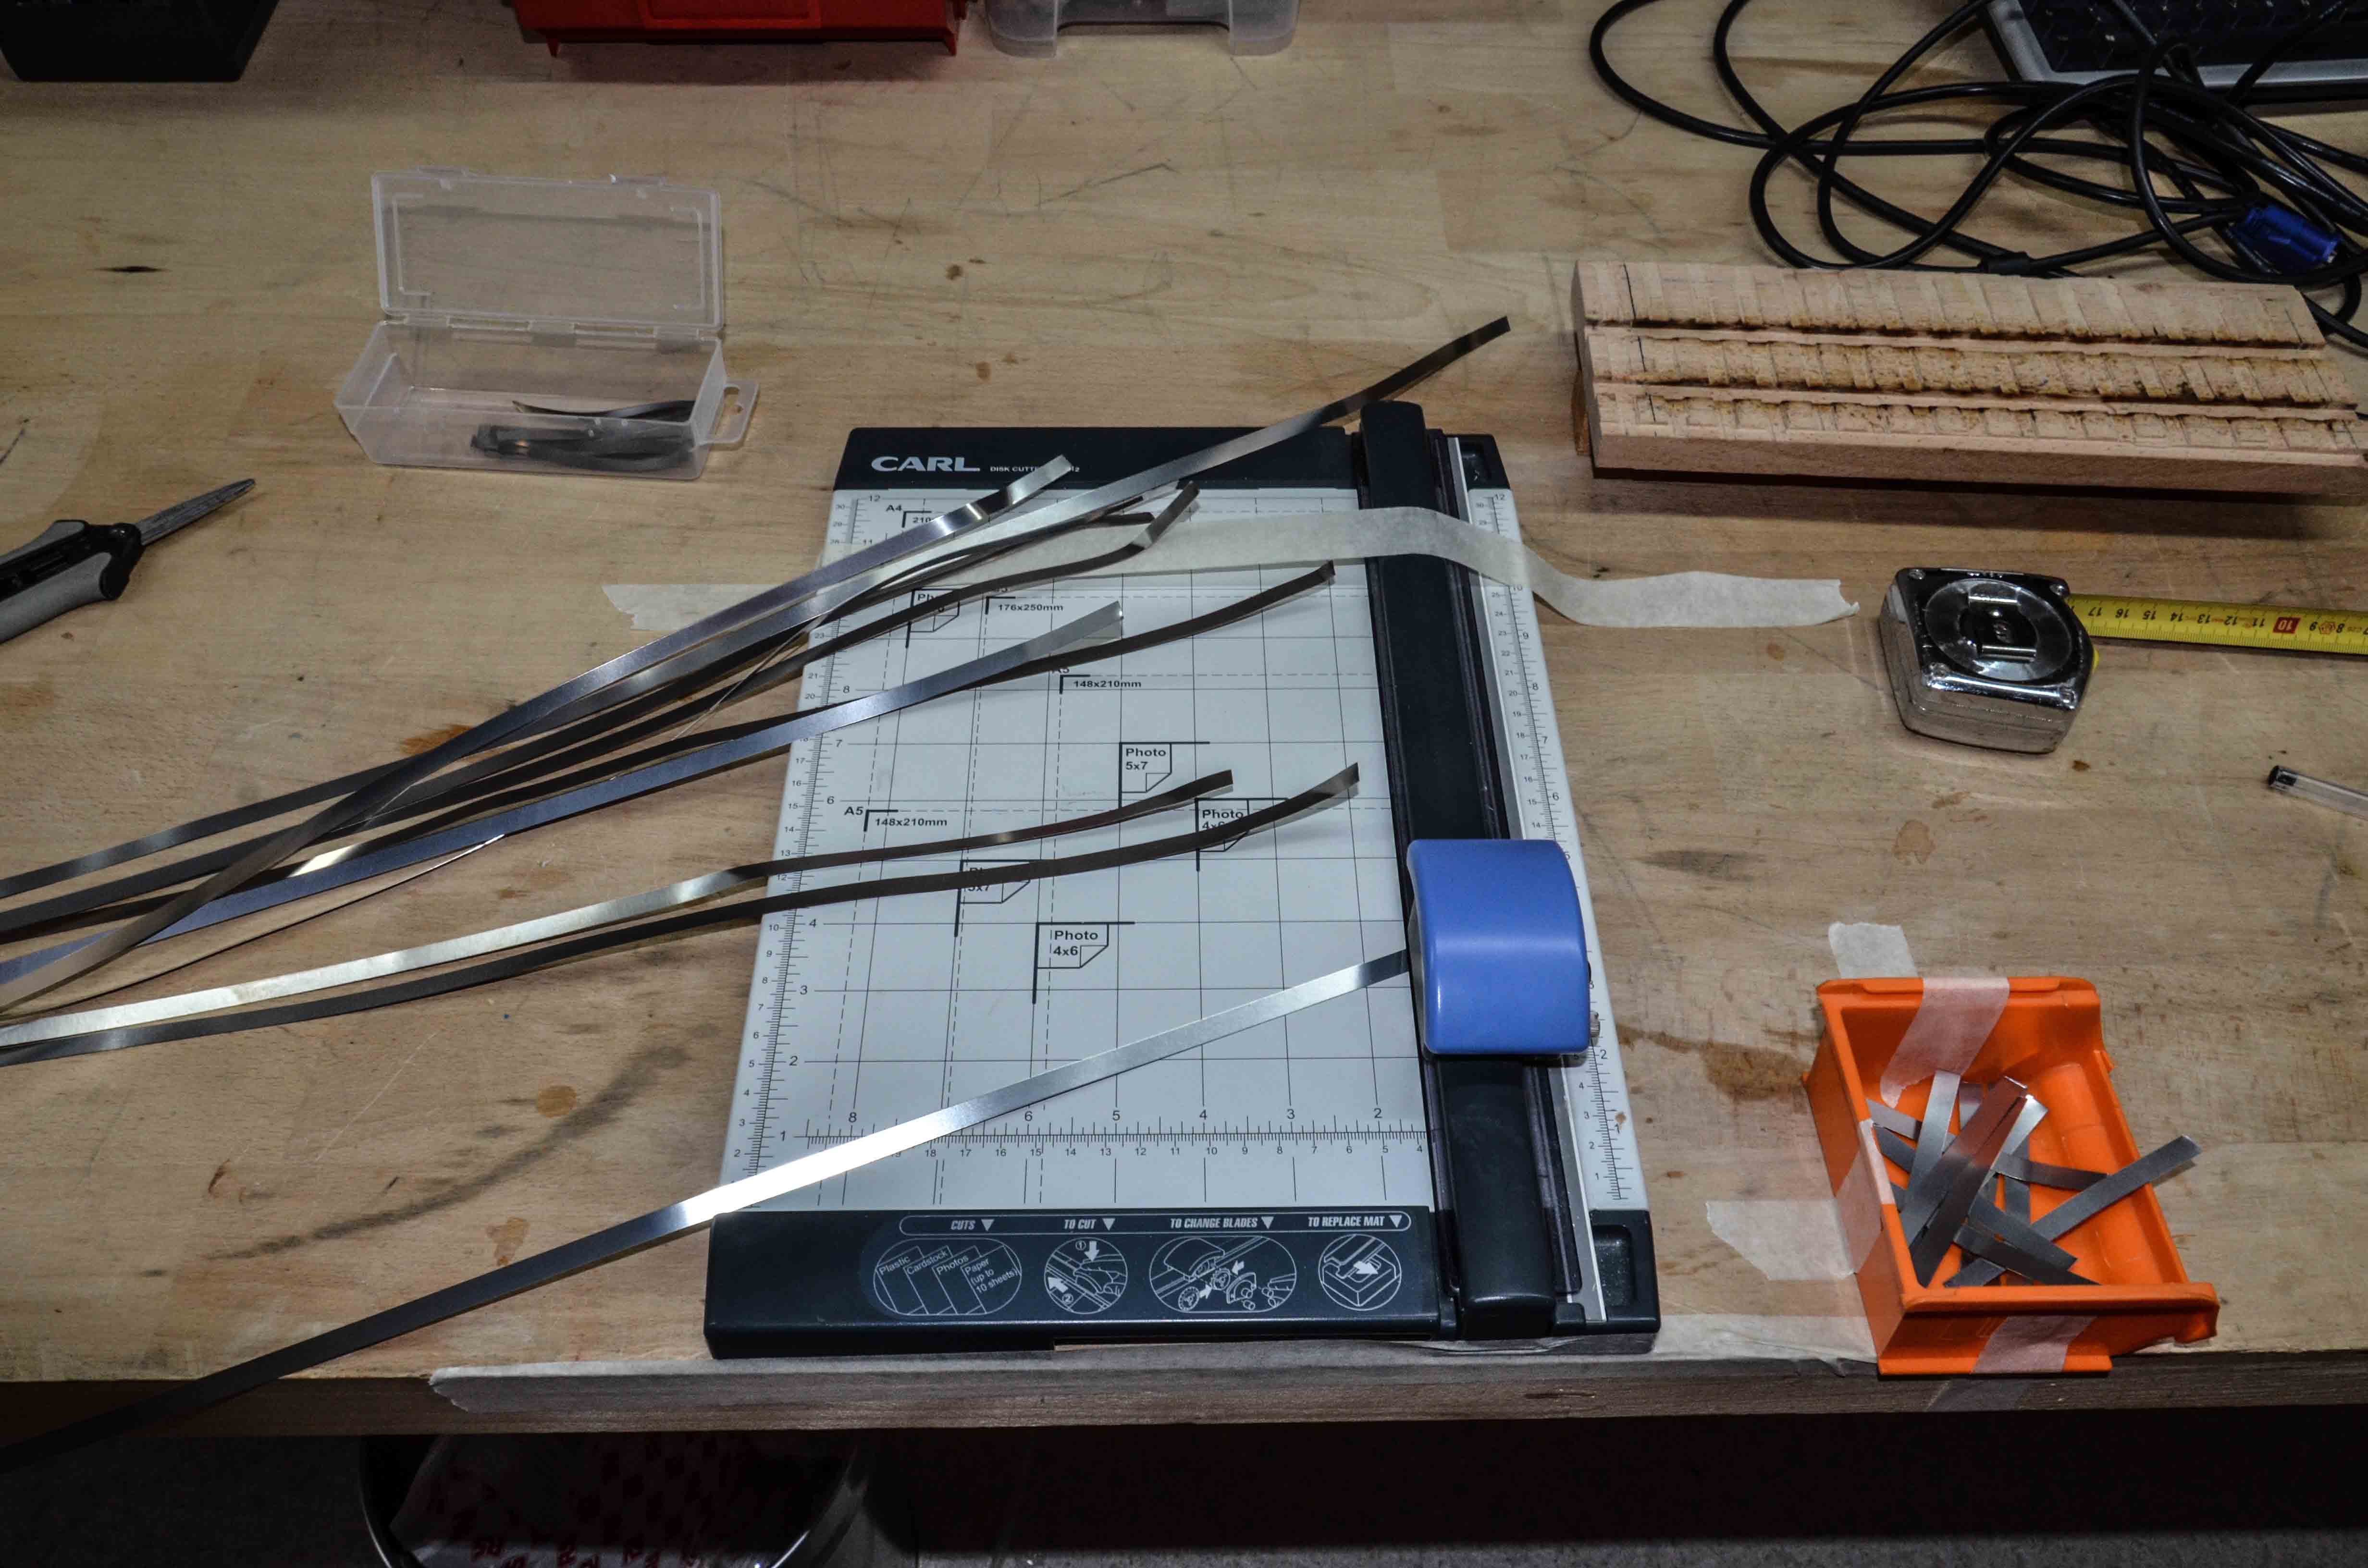
In order to build the 15 modules containing 70 cells each, I had to prepare the following stuff:
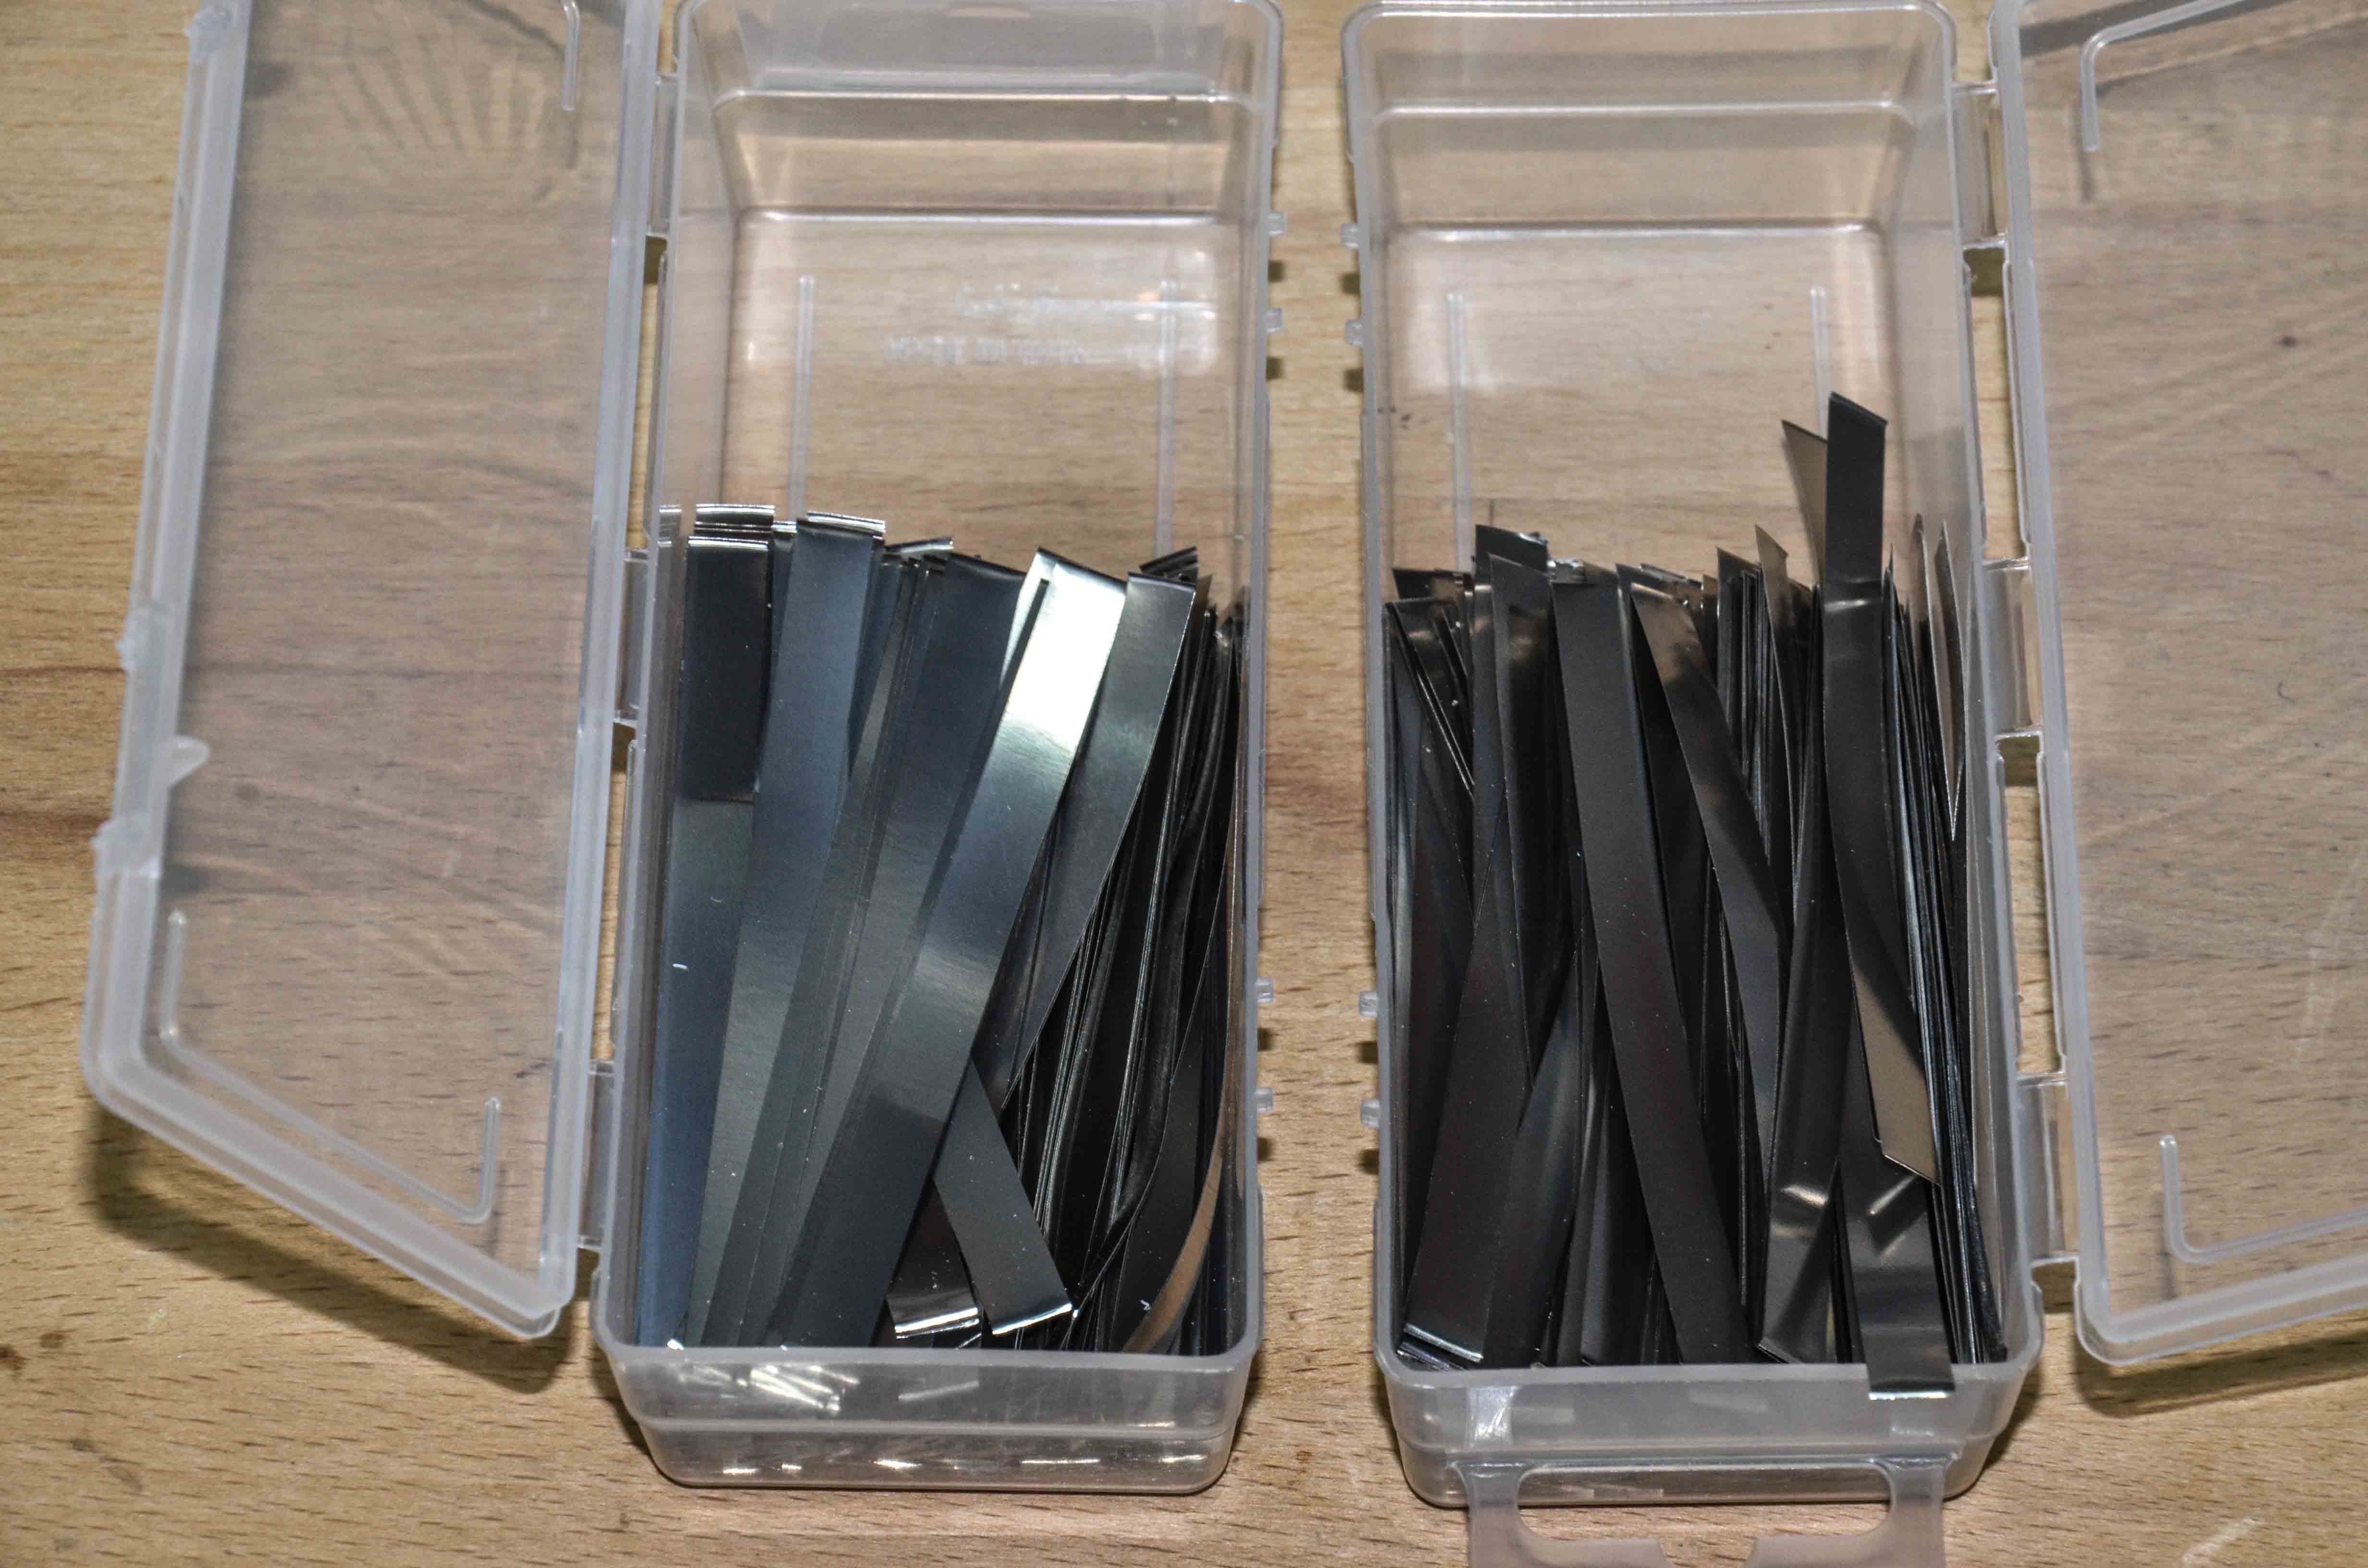
- 450 pieces of Nickel Strips - 84 mm length each - Total: 38 m of strip
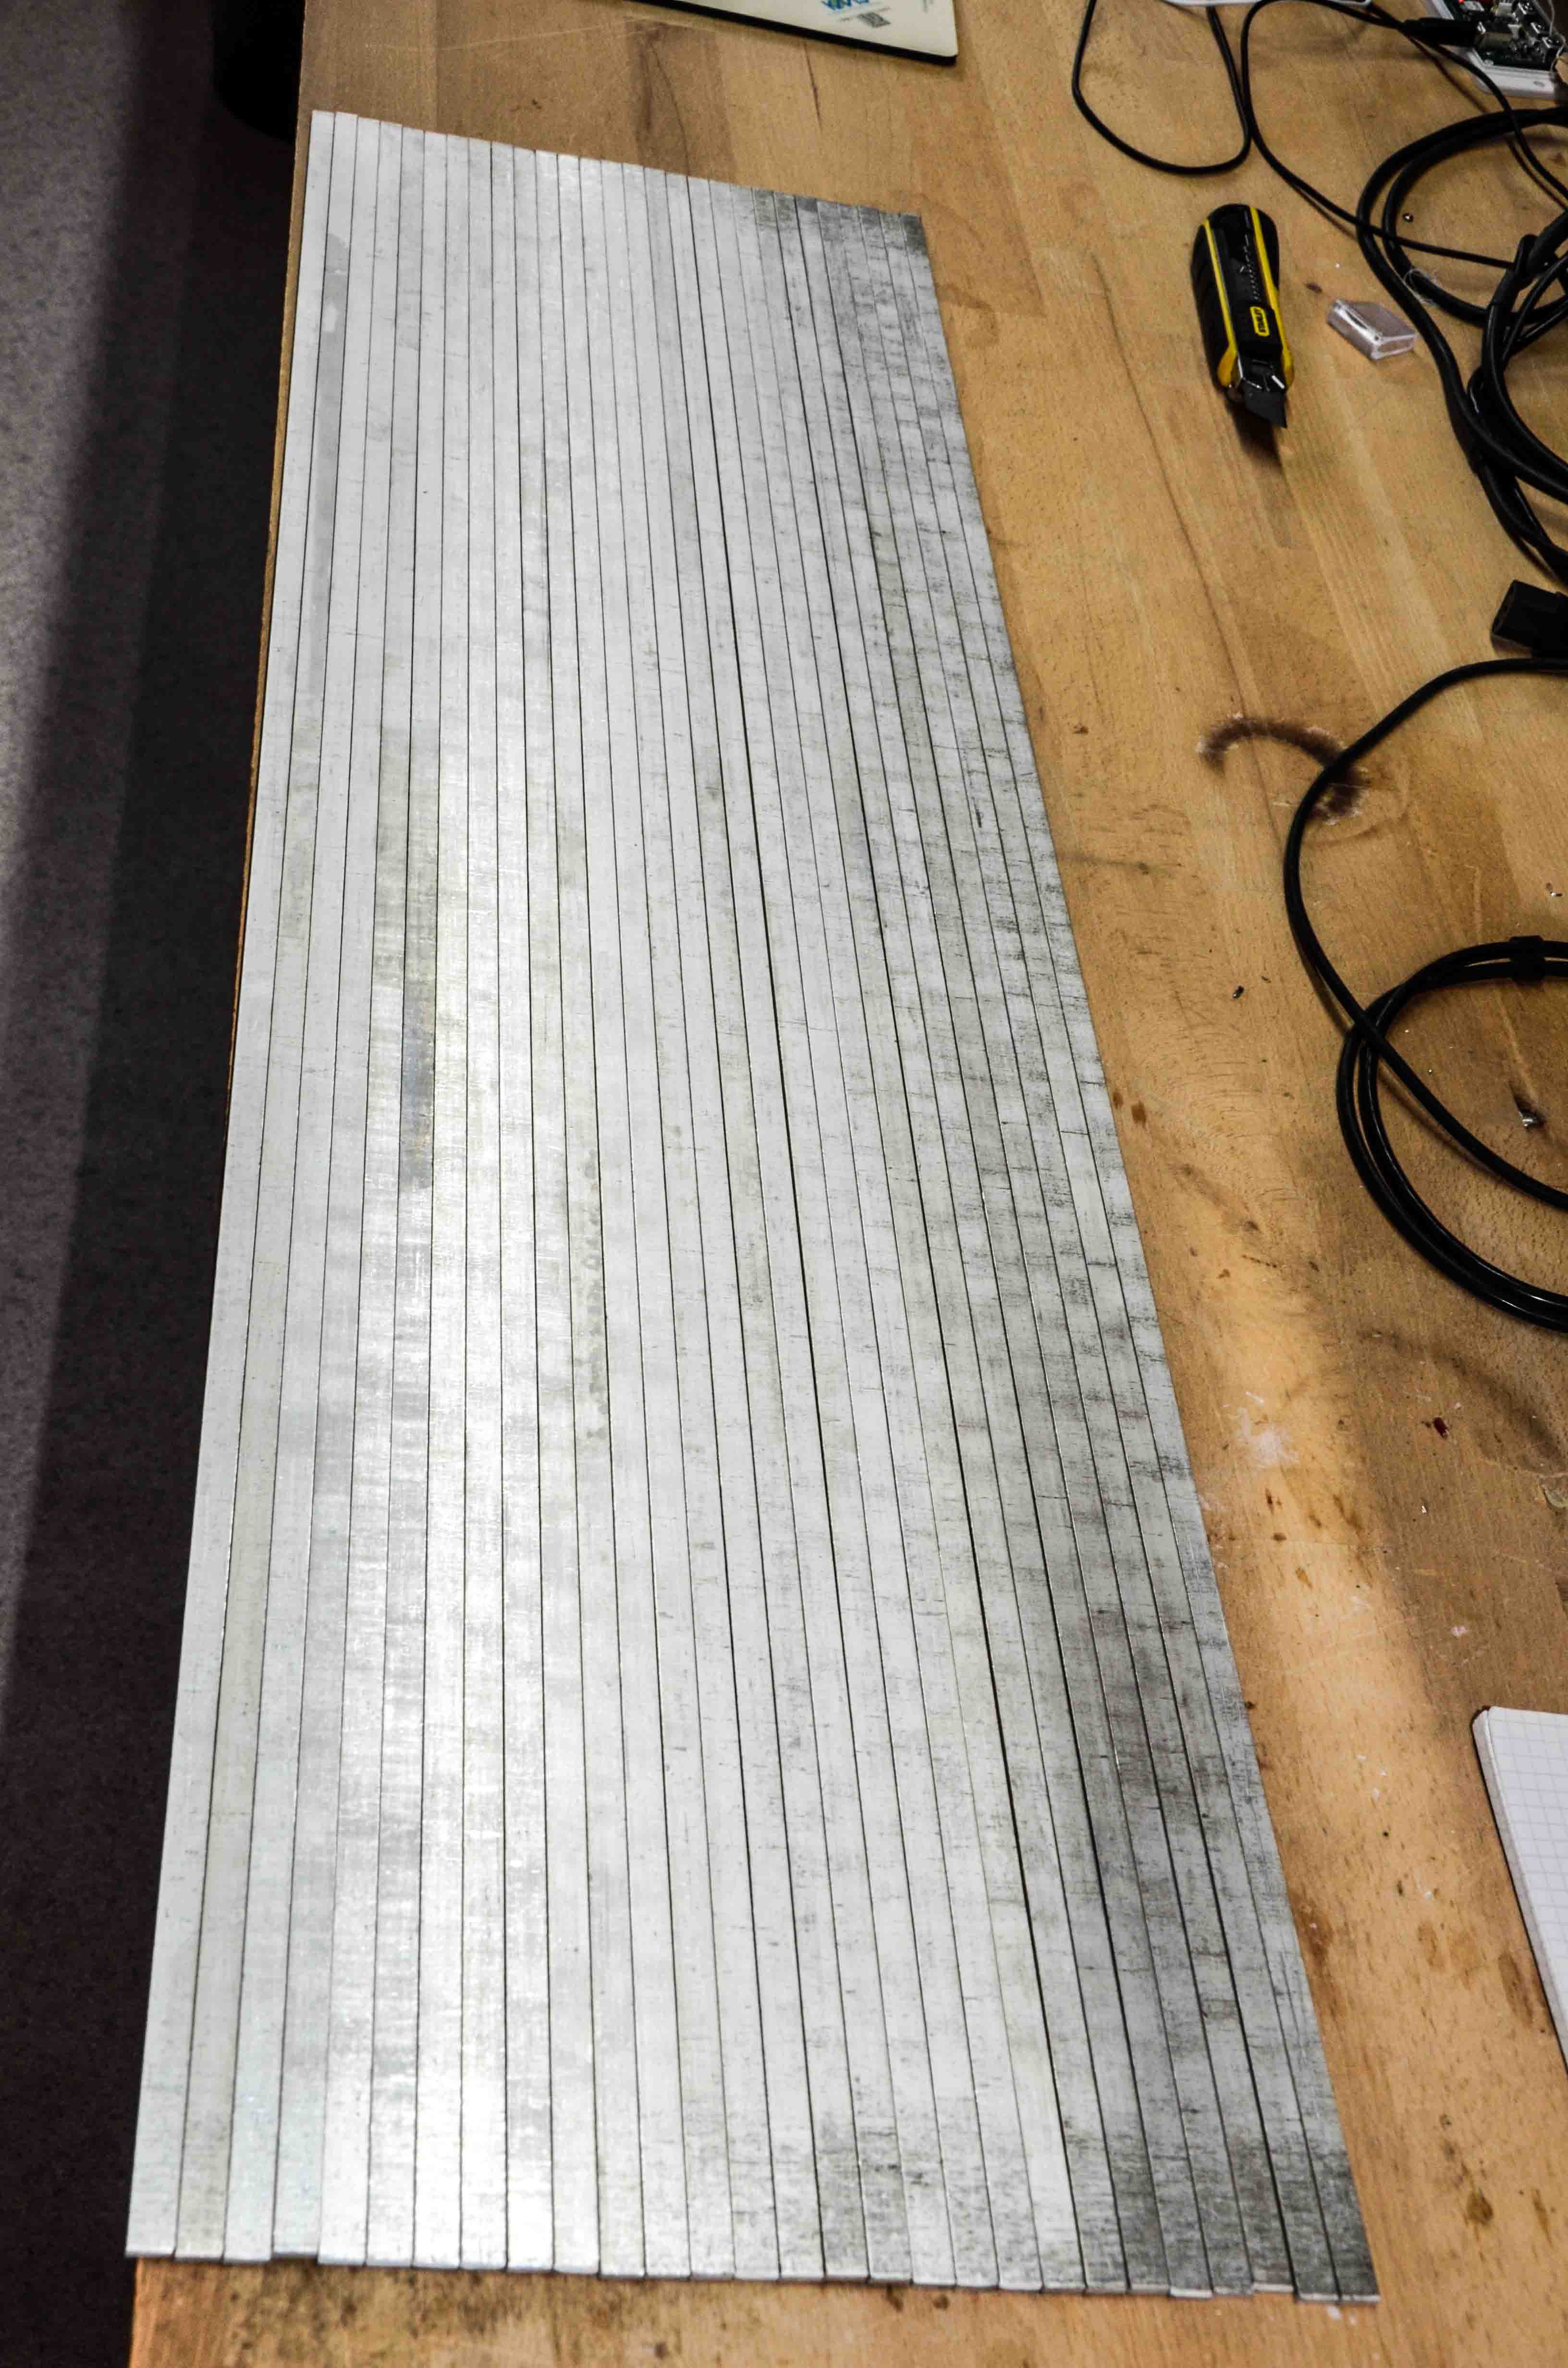
- 60 copper bus bars - 31 cm each - Total: 20 m of bus bar
Cutting the nickel strips with a disk cutter - The strip is wery thin and does not damage the cutter. Easy but boring work :-)
![]()
Strips ready for use
![]()
Bus bars before cutting - Theses are high end 10 X 3 mm tinned copper busbars
![]()
Cutting the bars with my radial saw
![]()
Bunch of 31 cm long bus bars ready for use
![]()
Assembly Step 1: instert 2 BB's in the jig
![]()
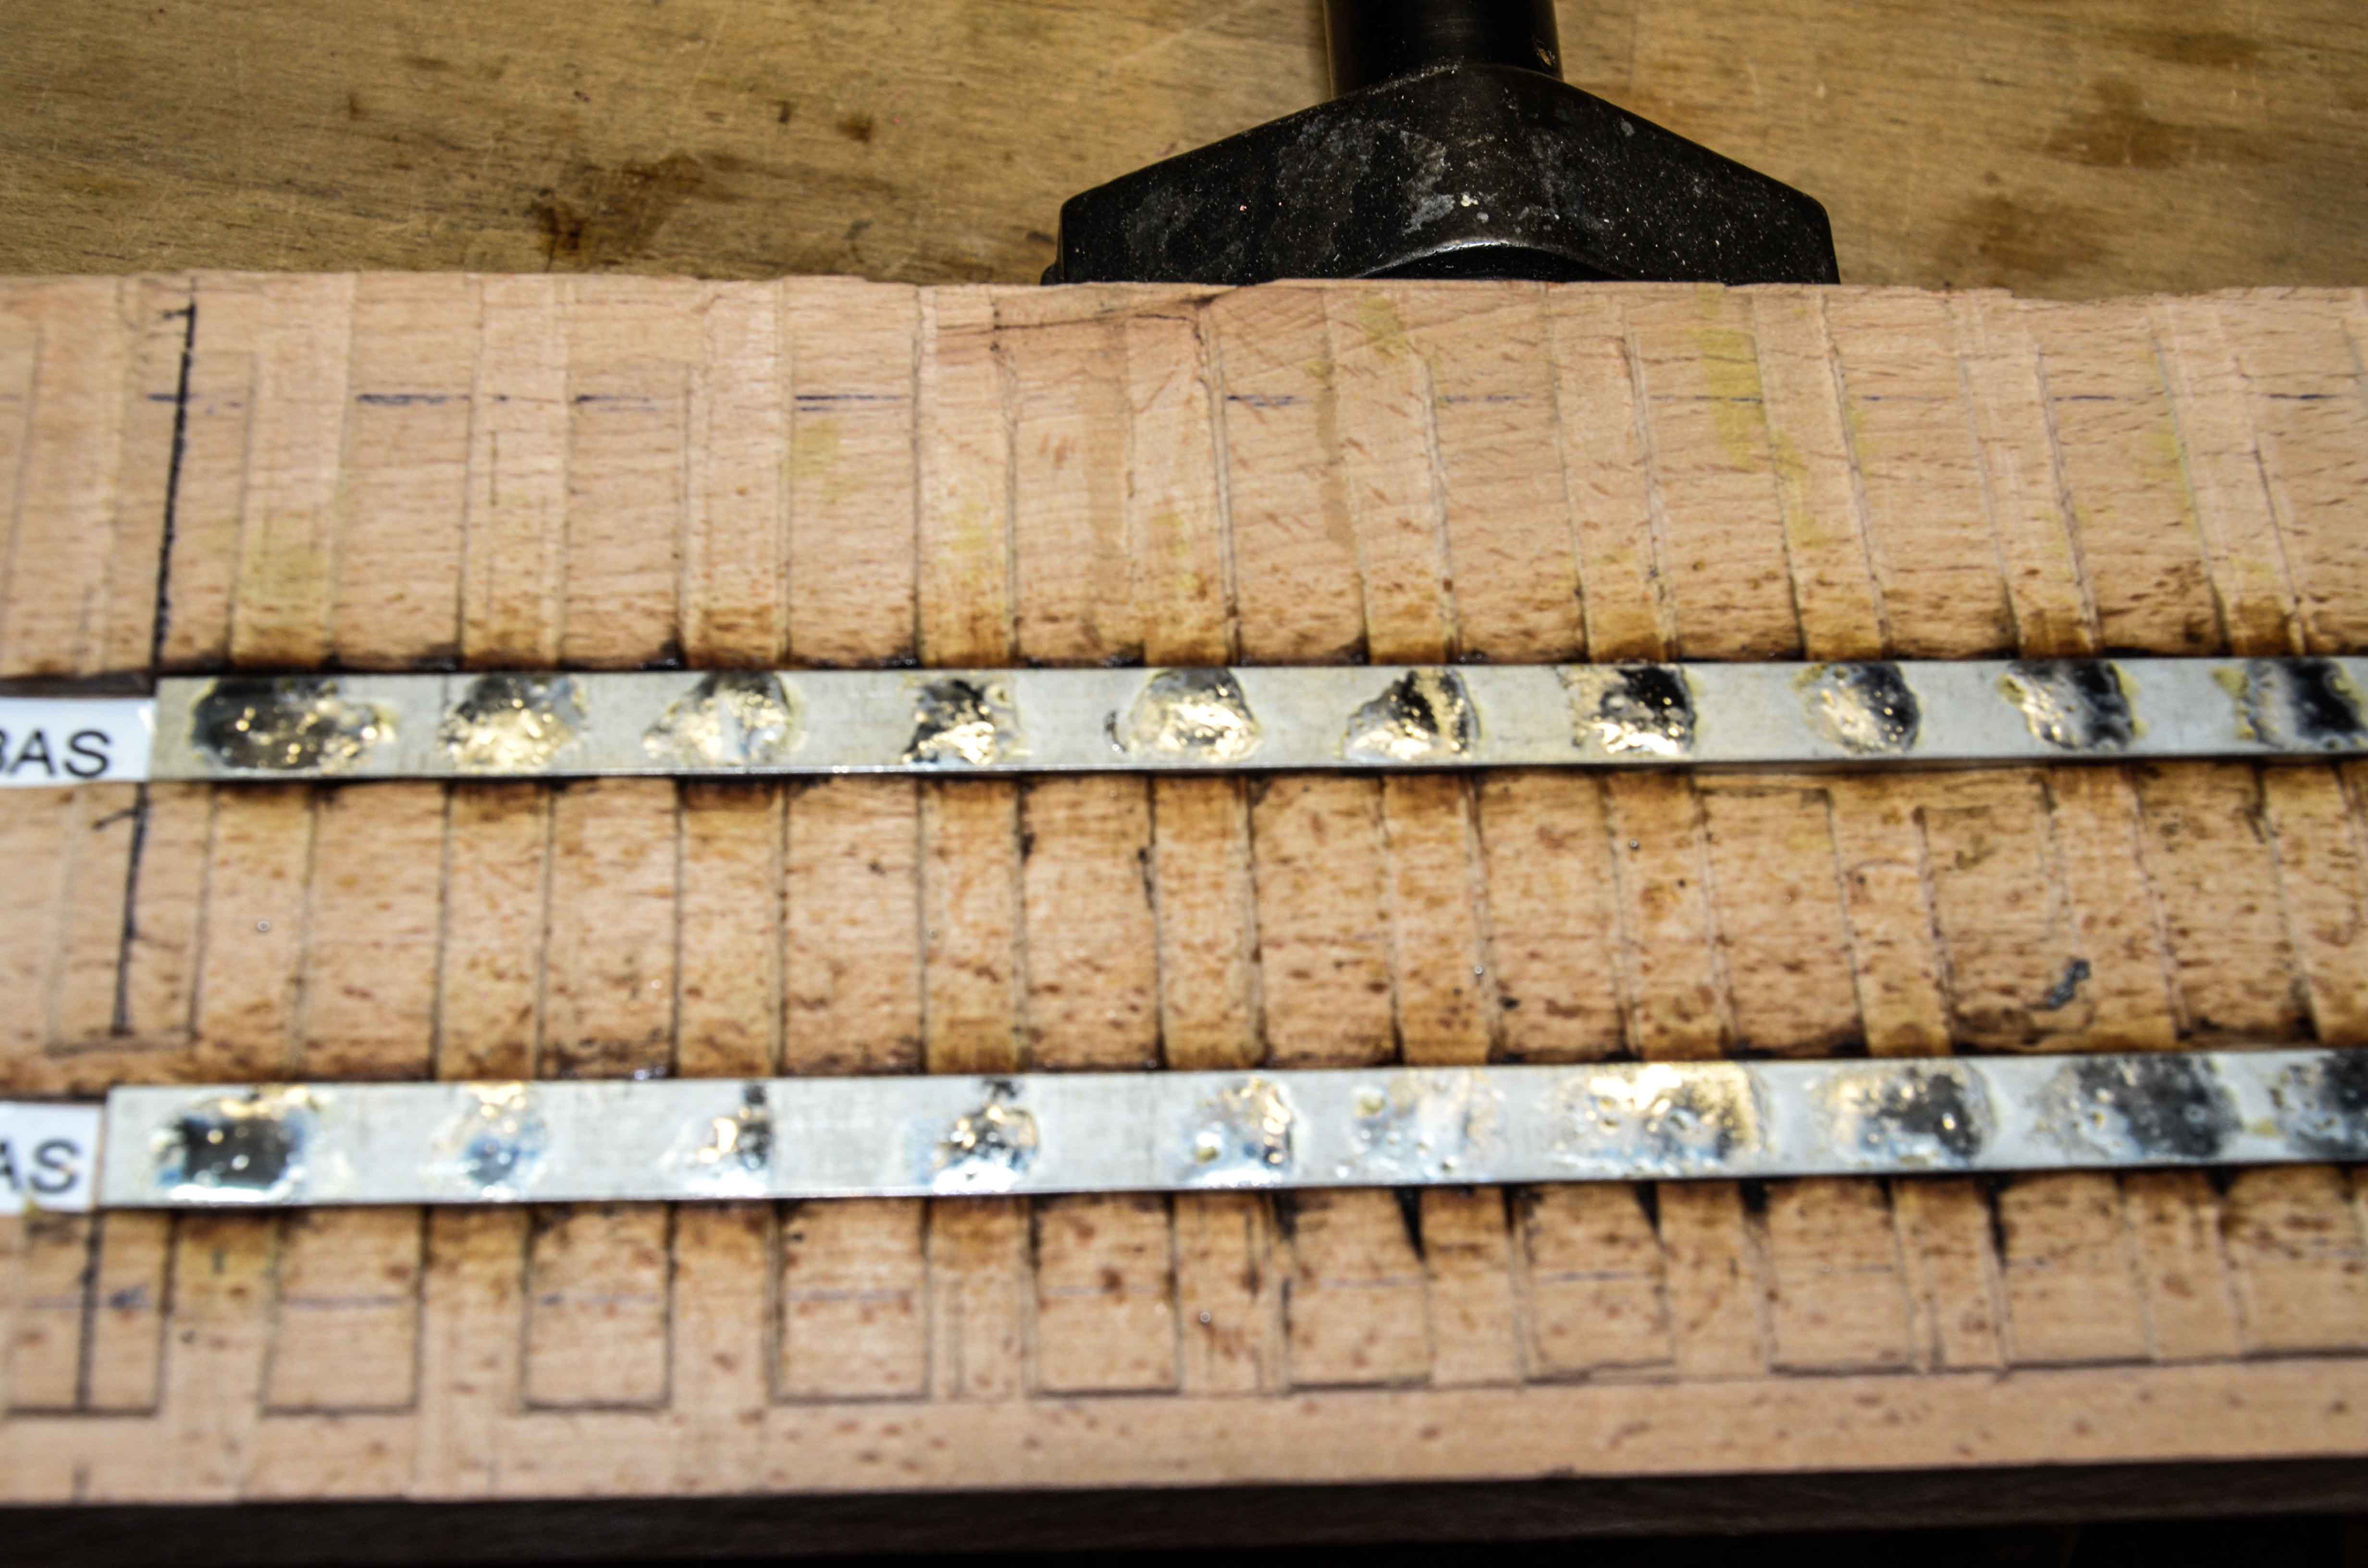
Assembly Step 2: Adding some extra tin on the bars. I use flux to improve the solderability
![]()
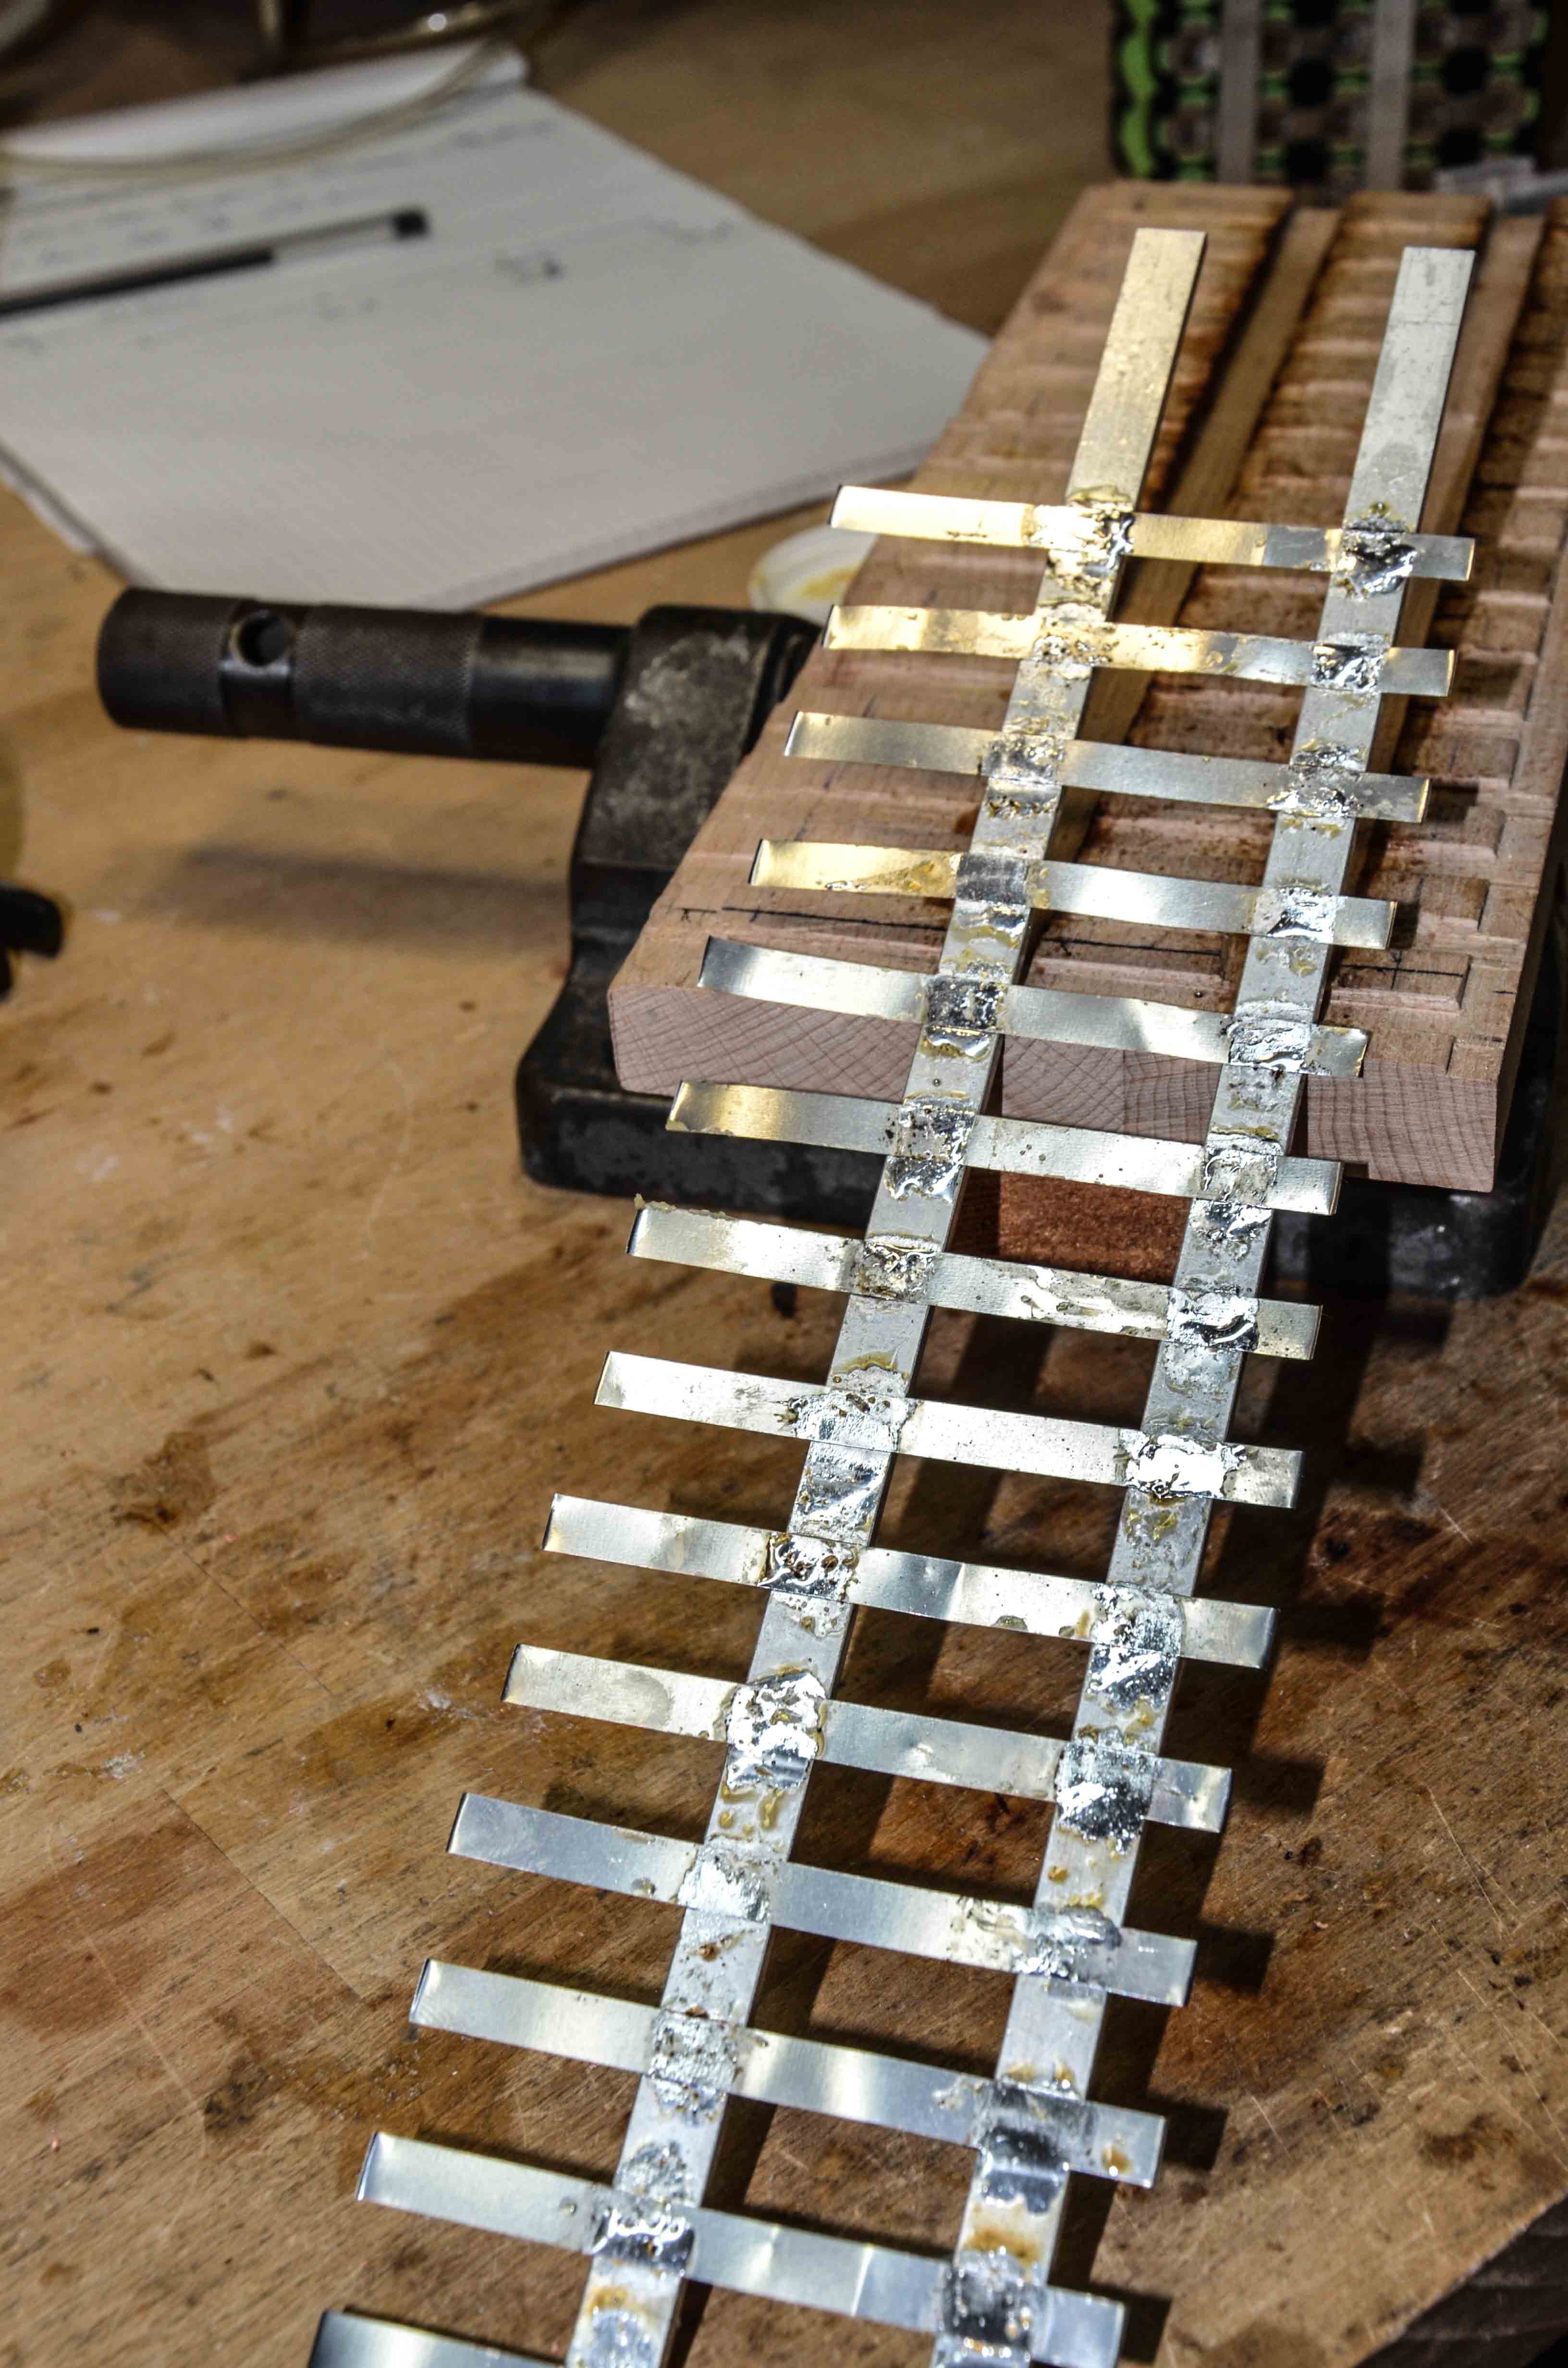
Assembly Step 3: Soldering the Nickel trips on the bus bars. I am using a Weller Jumbo soldering iron with a huge tip for this operation.
![]()
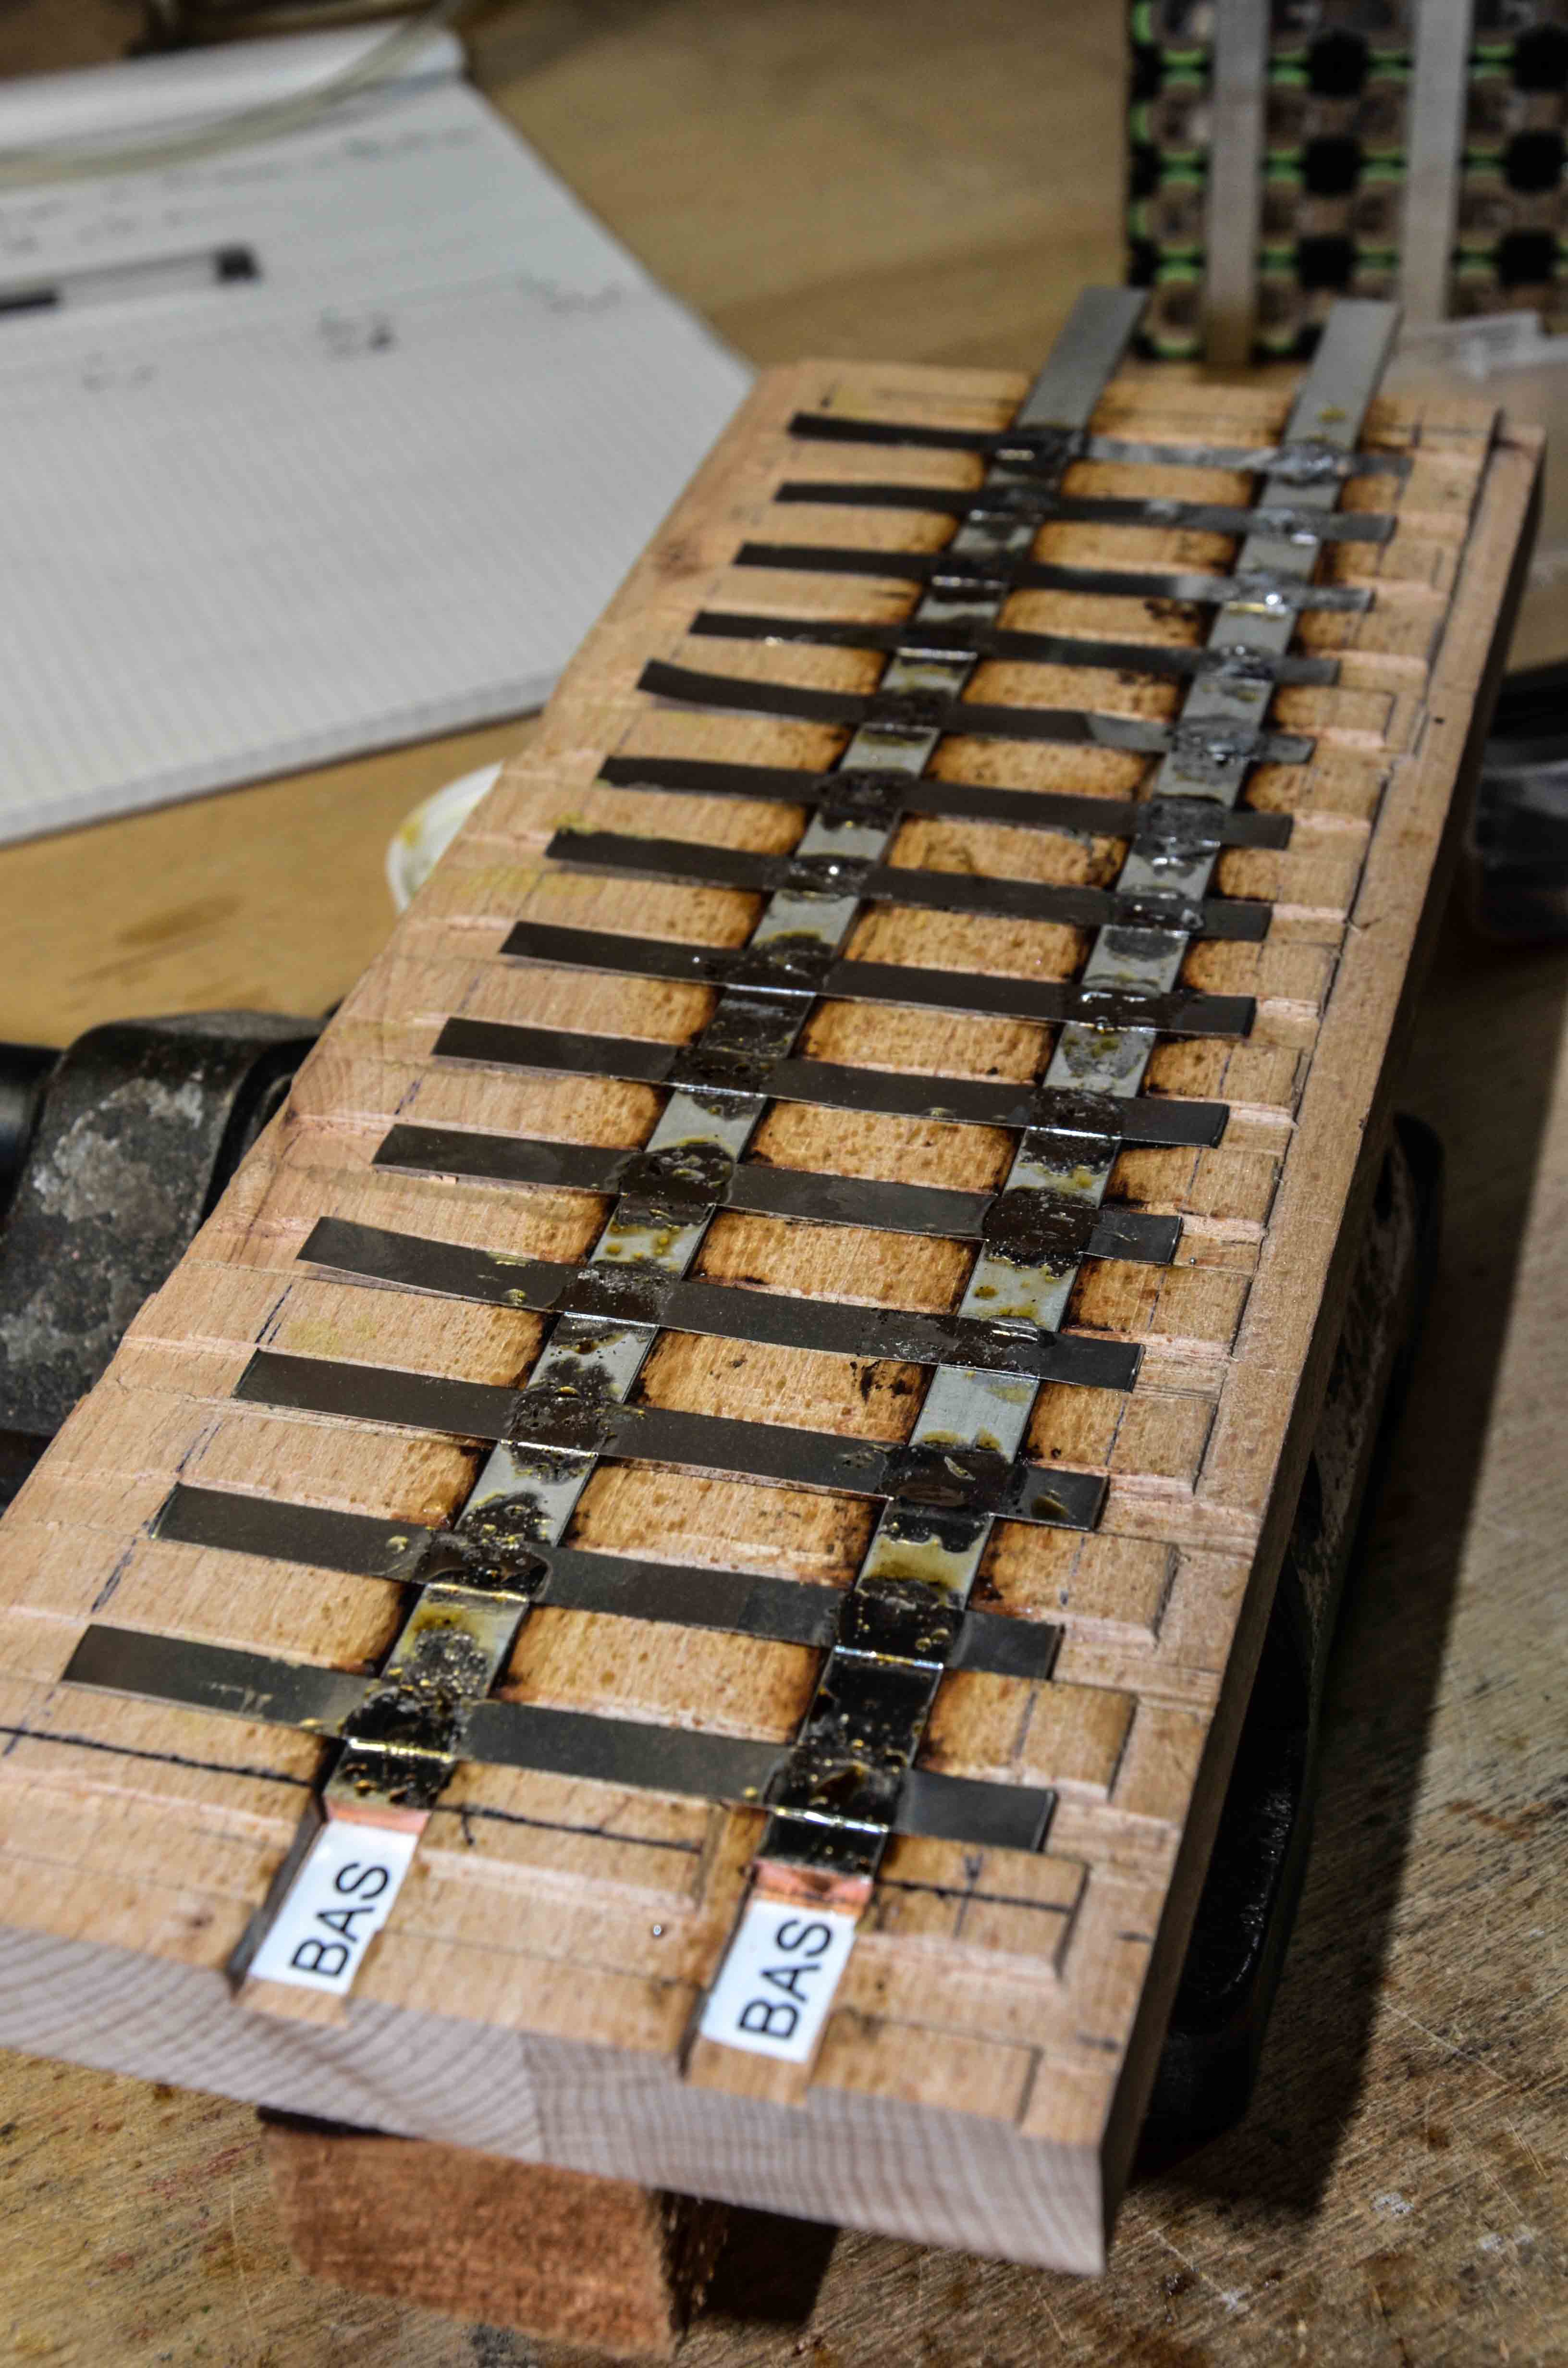
Once removed from the jig, the "fishbone" looks like this:
(Two such fishbones are needed for one module, one for each pole)
![]()
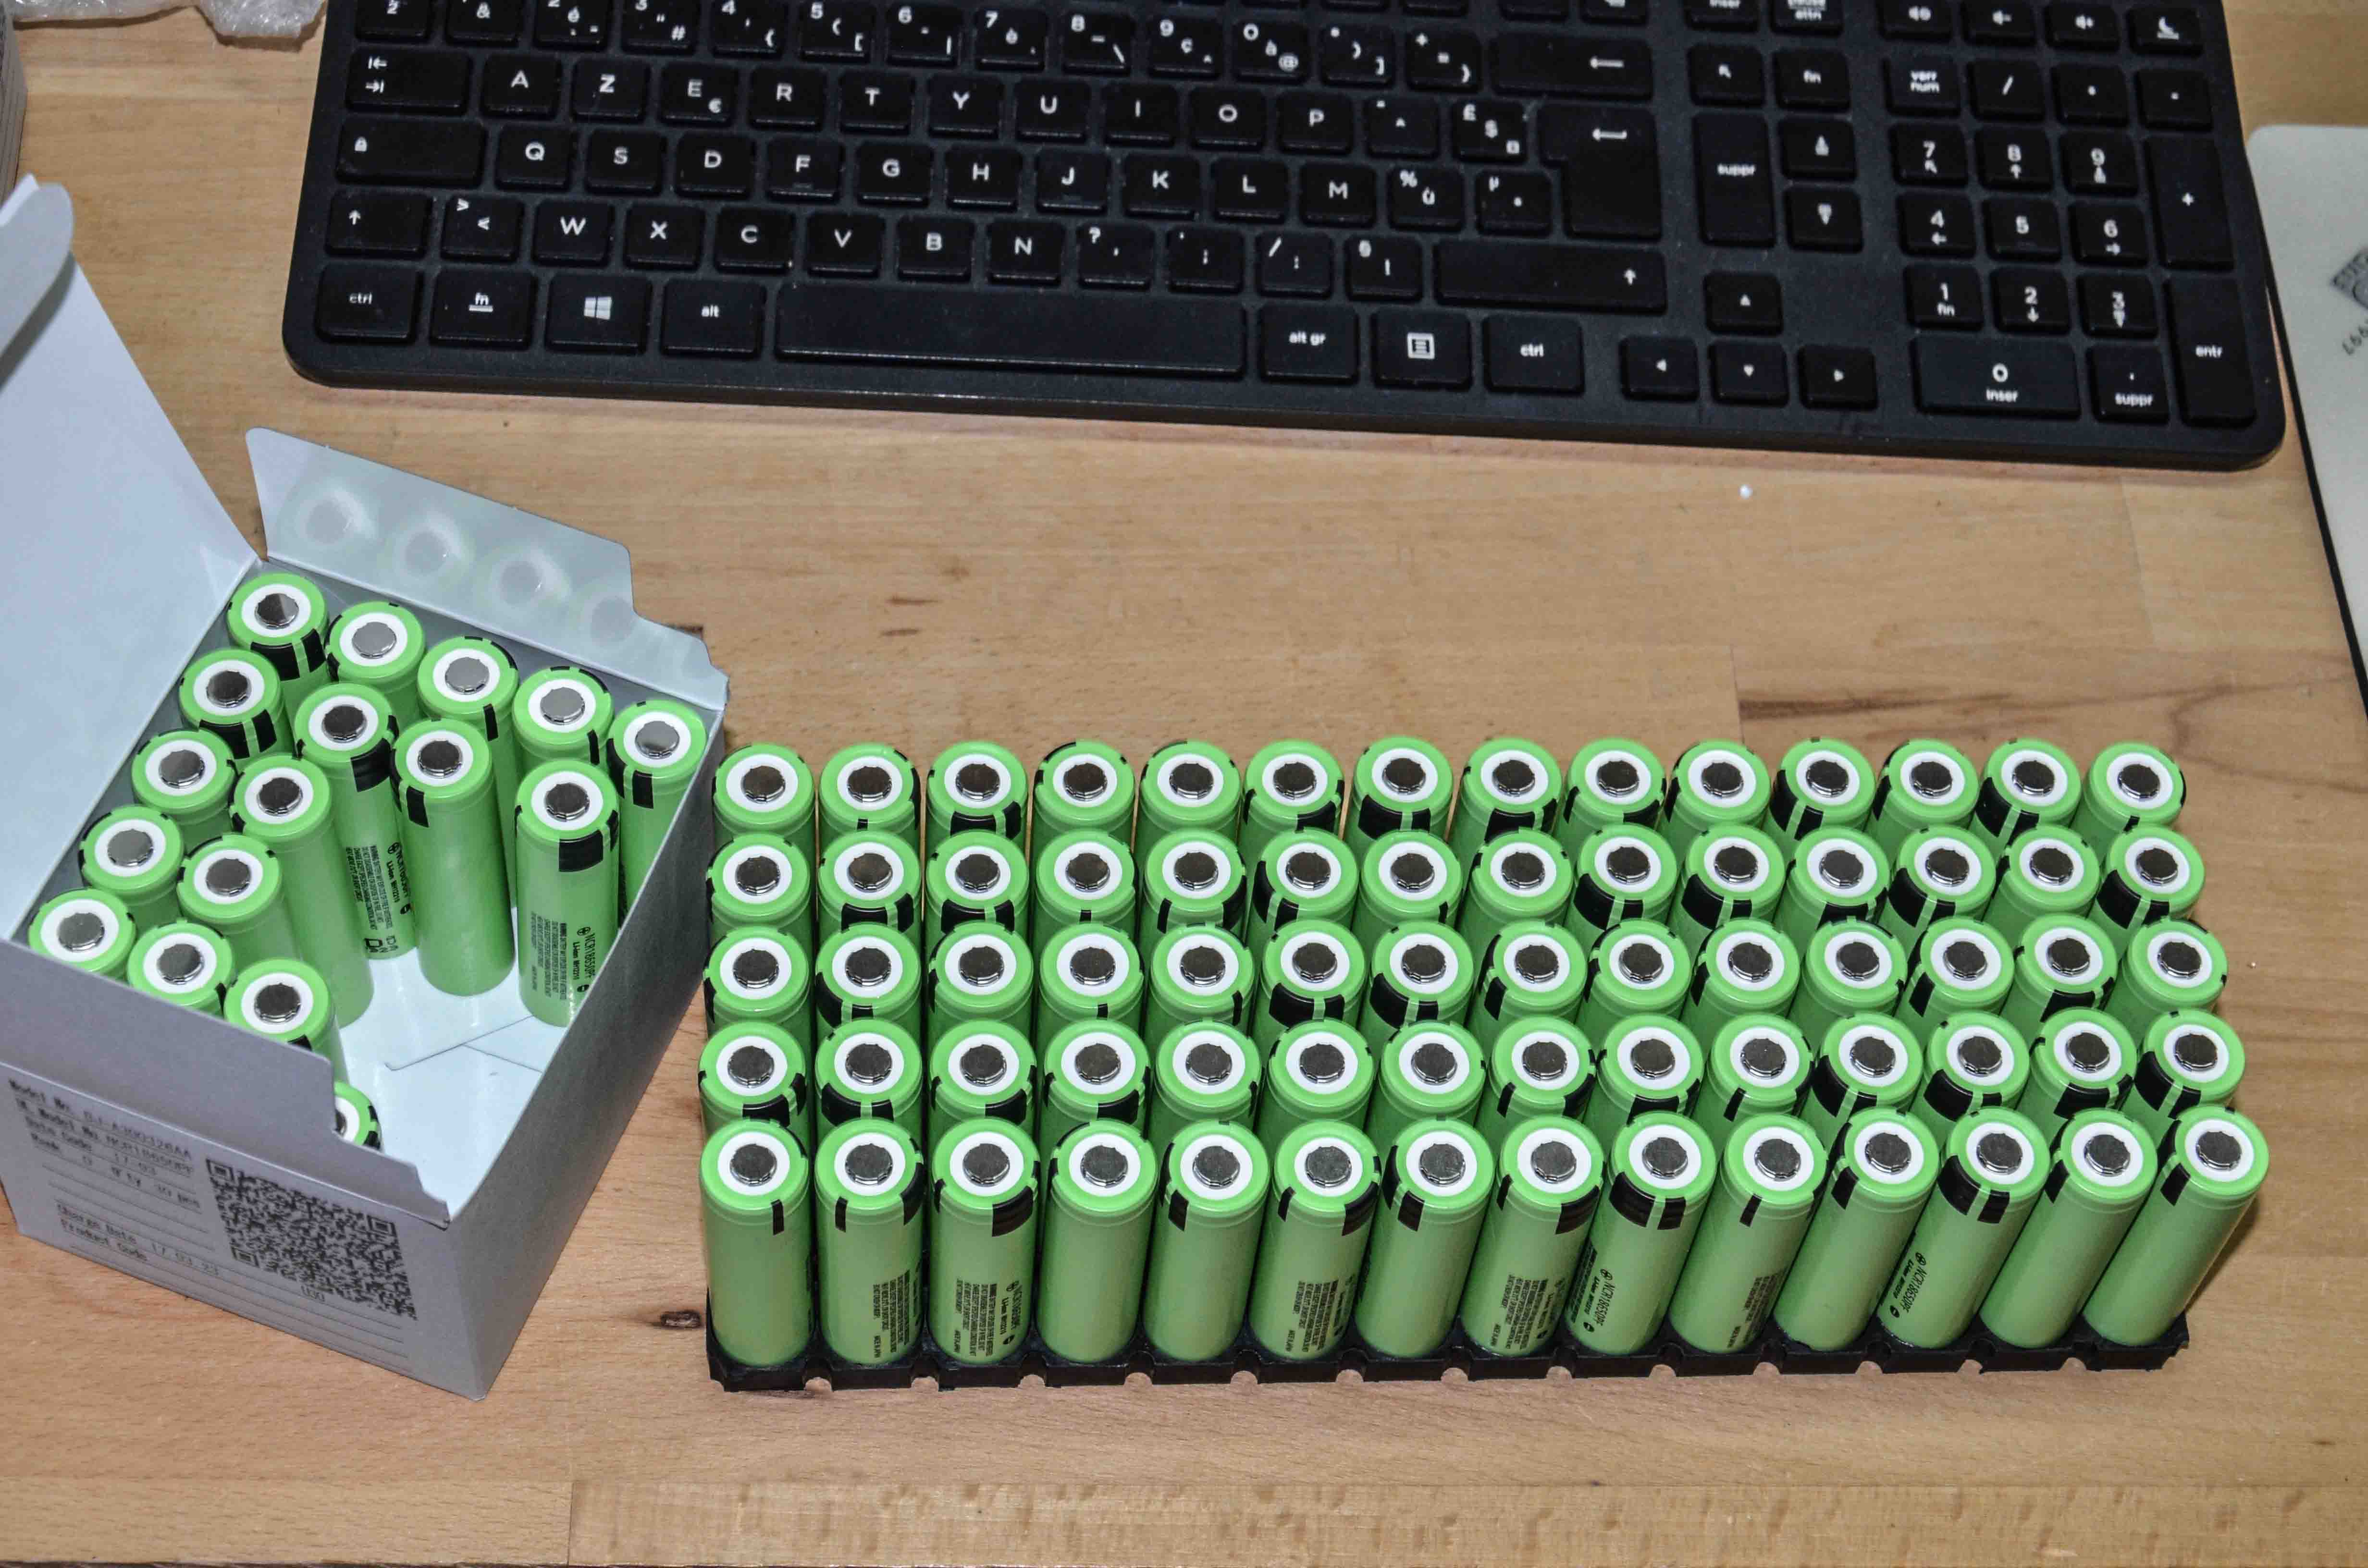
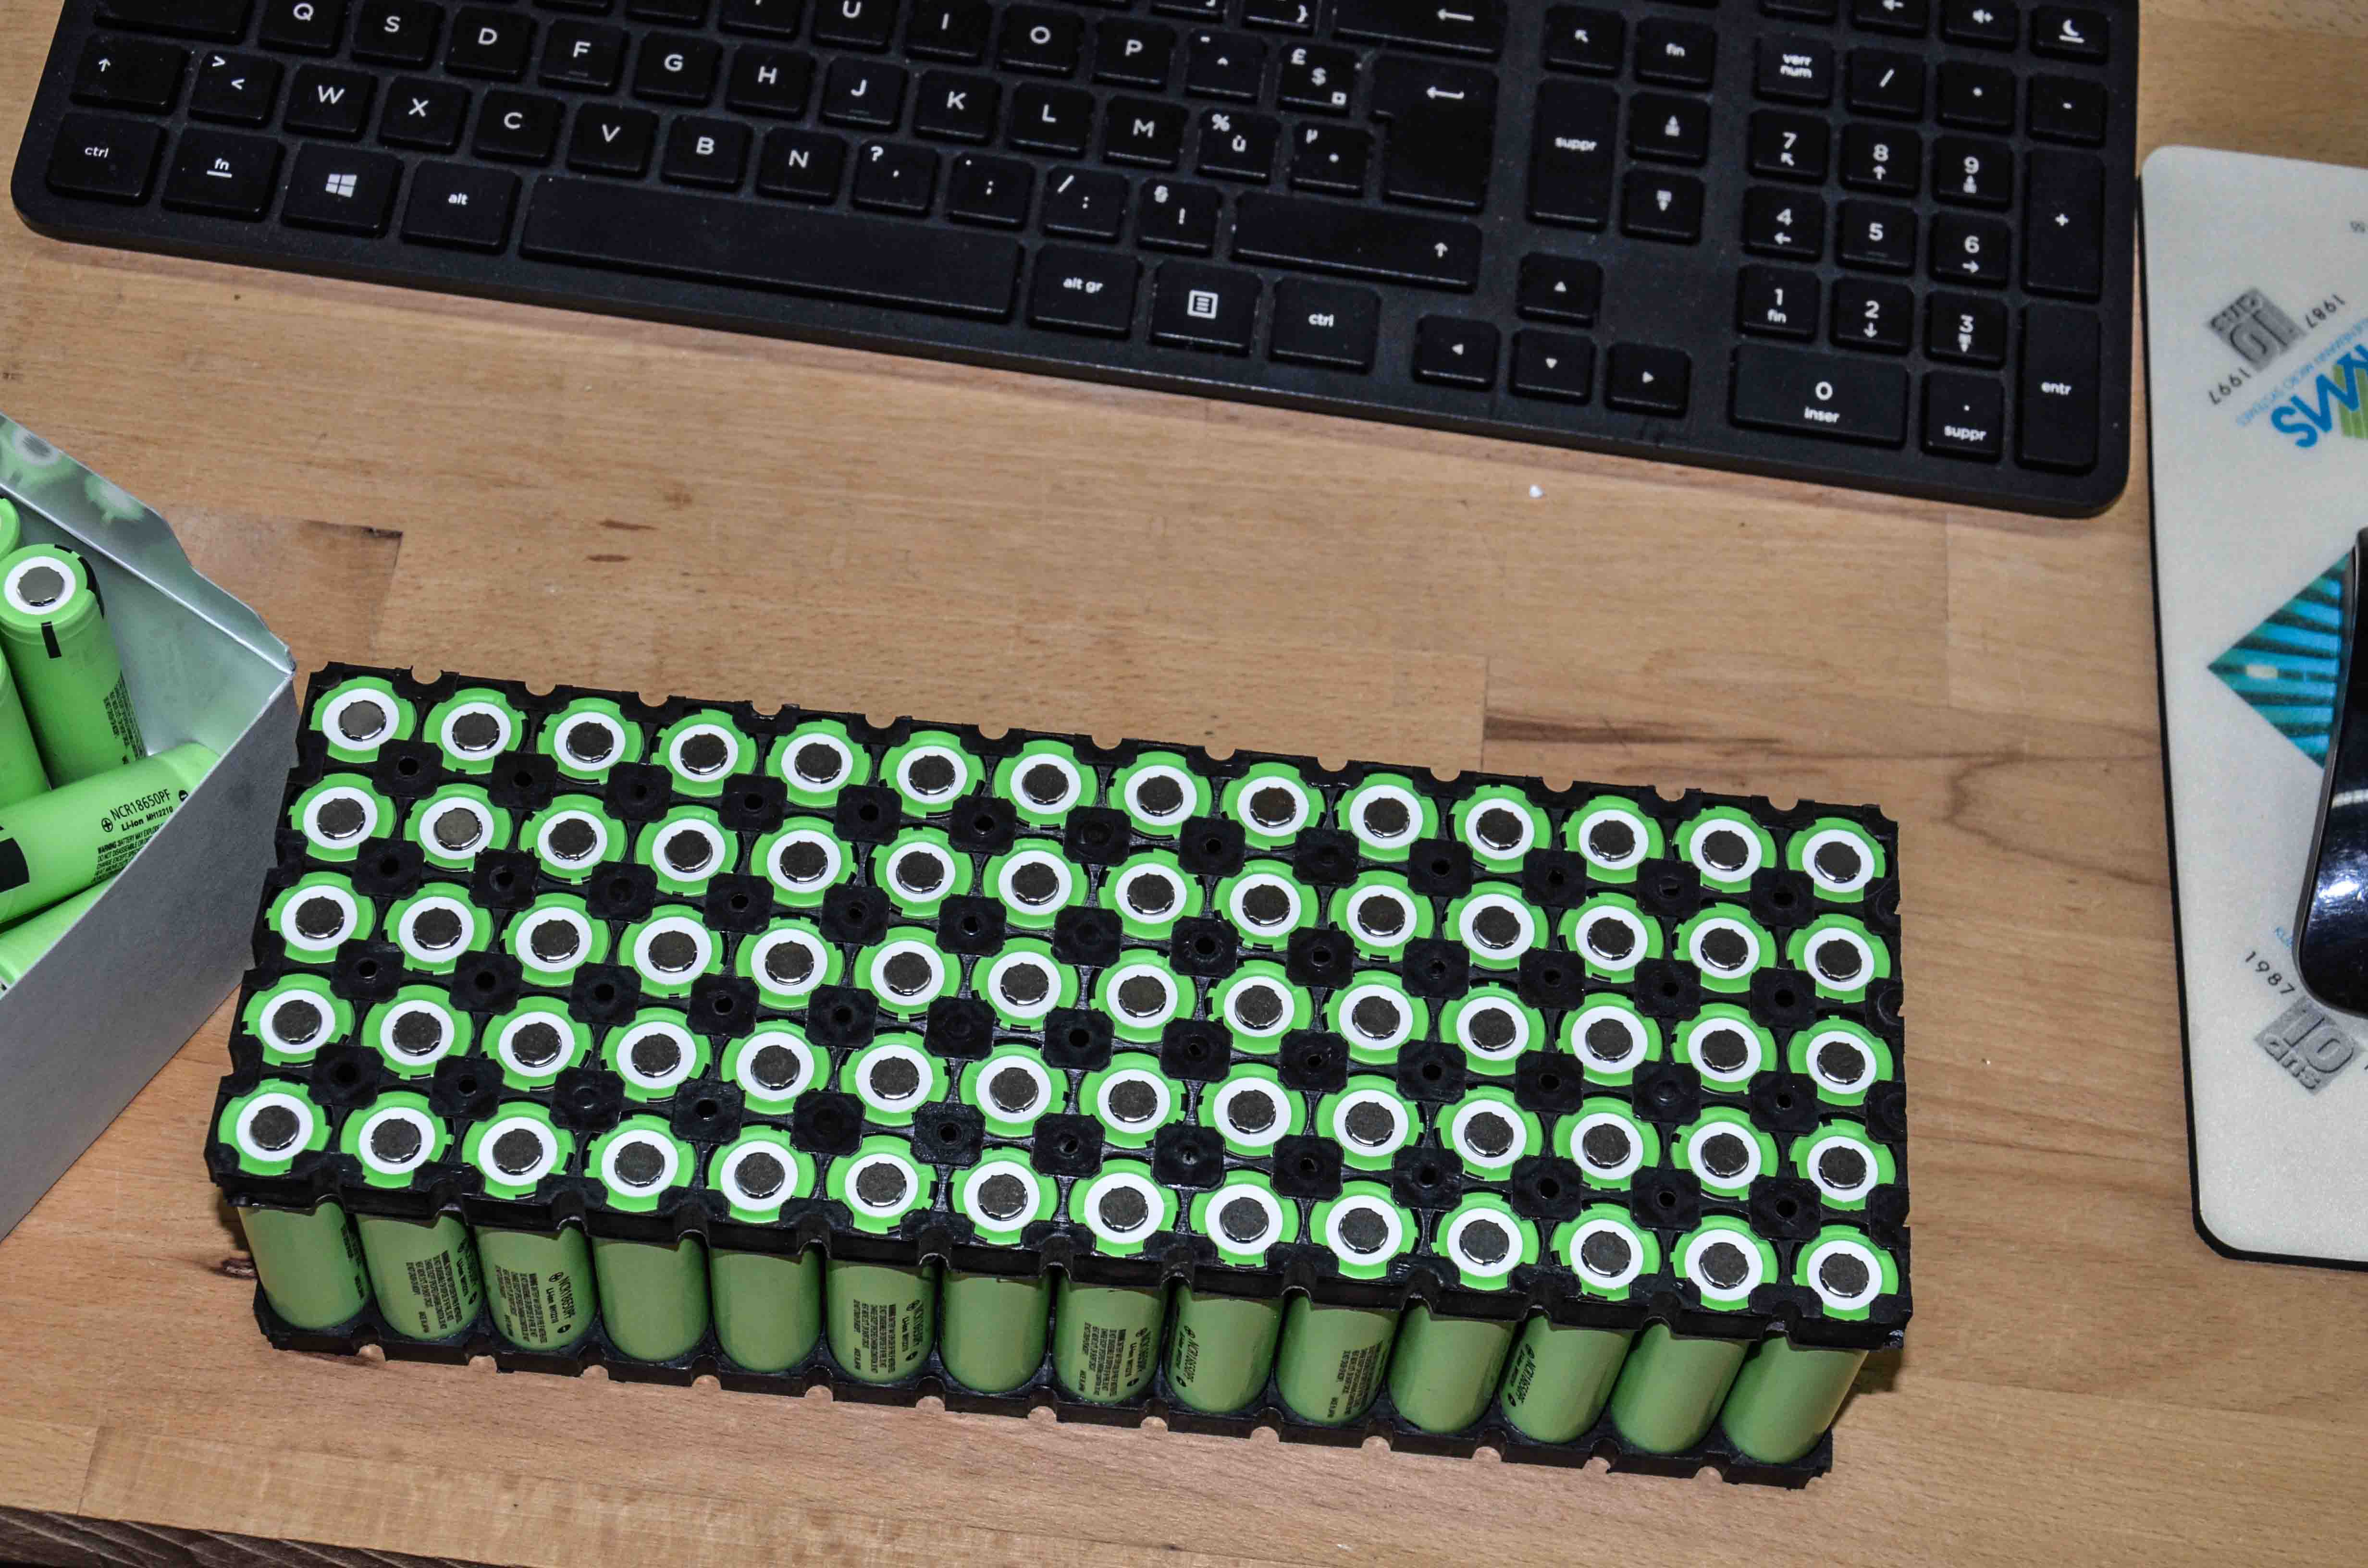
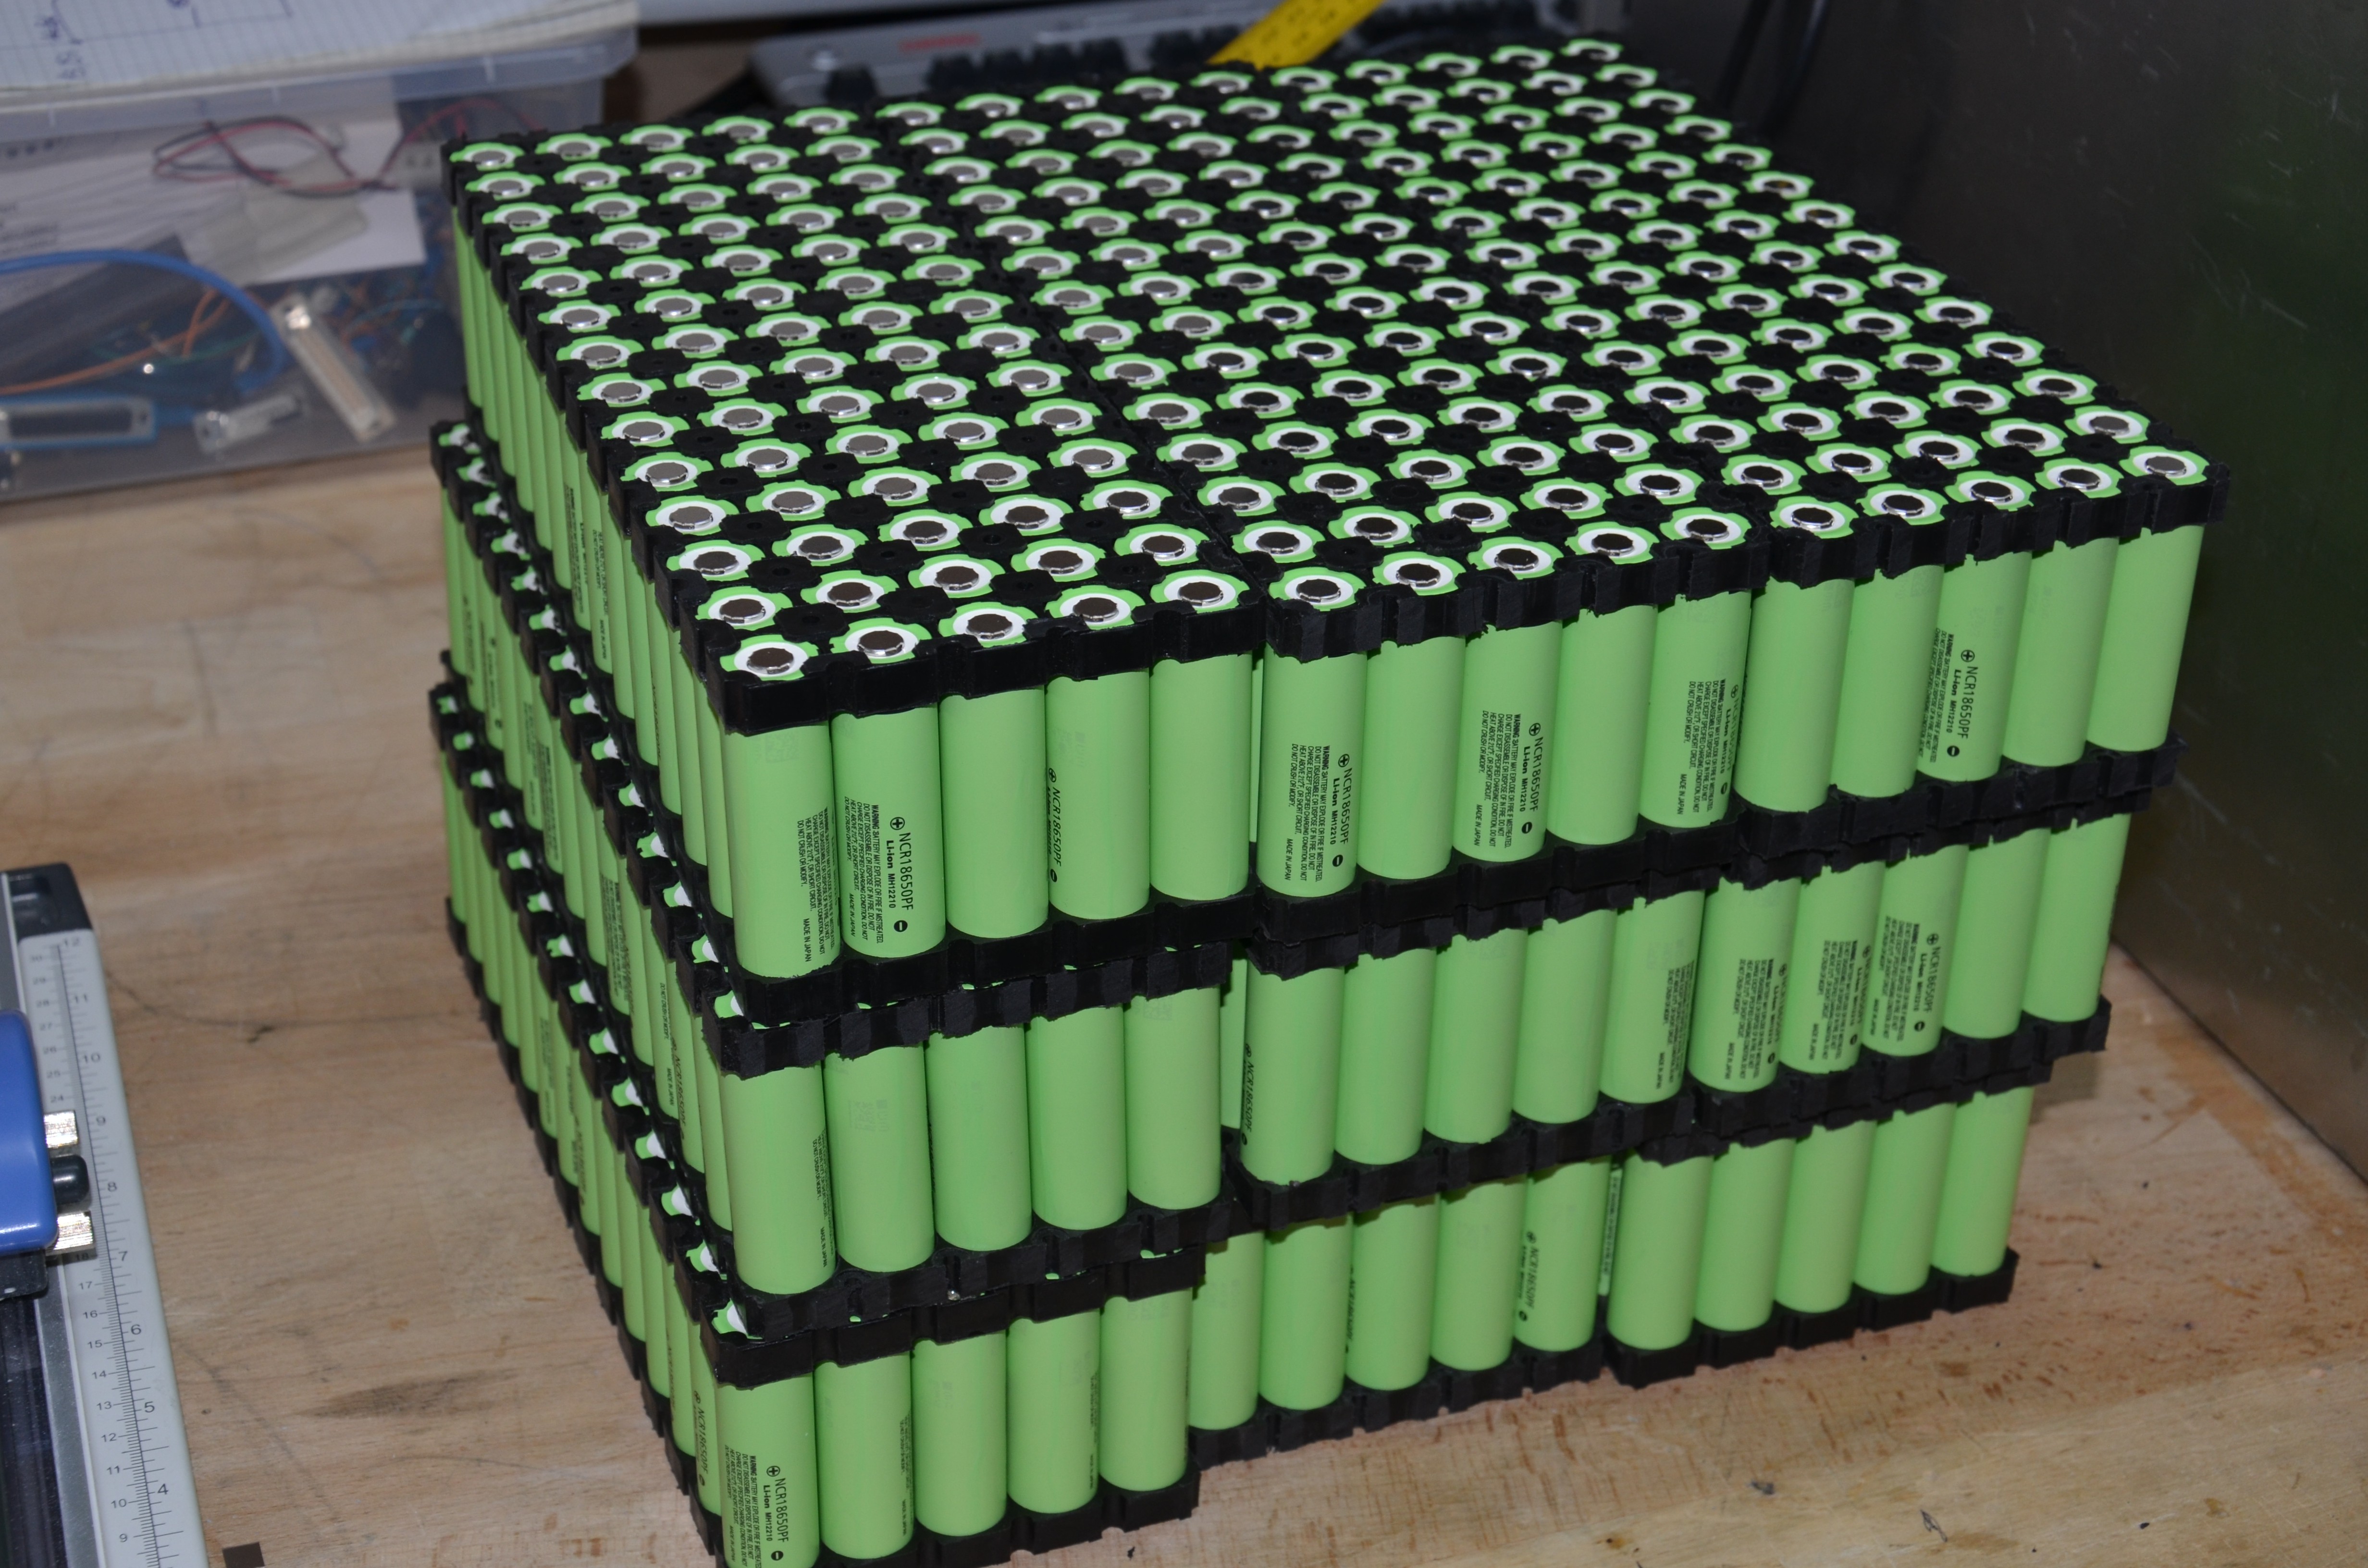
Assembly Step 4: Populate battery holders
![]()
![]()
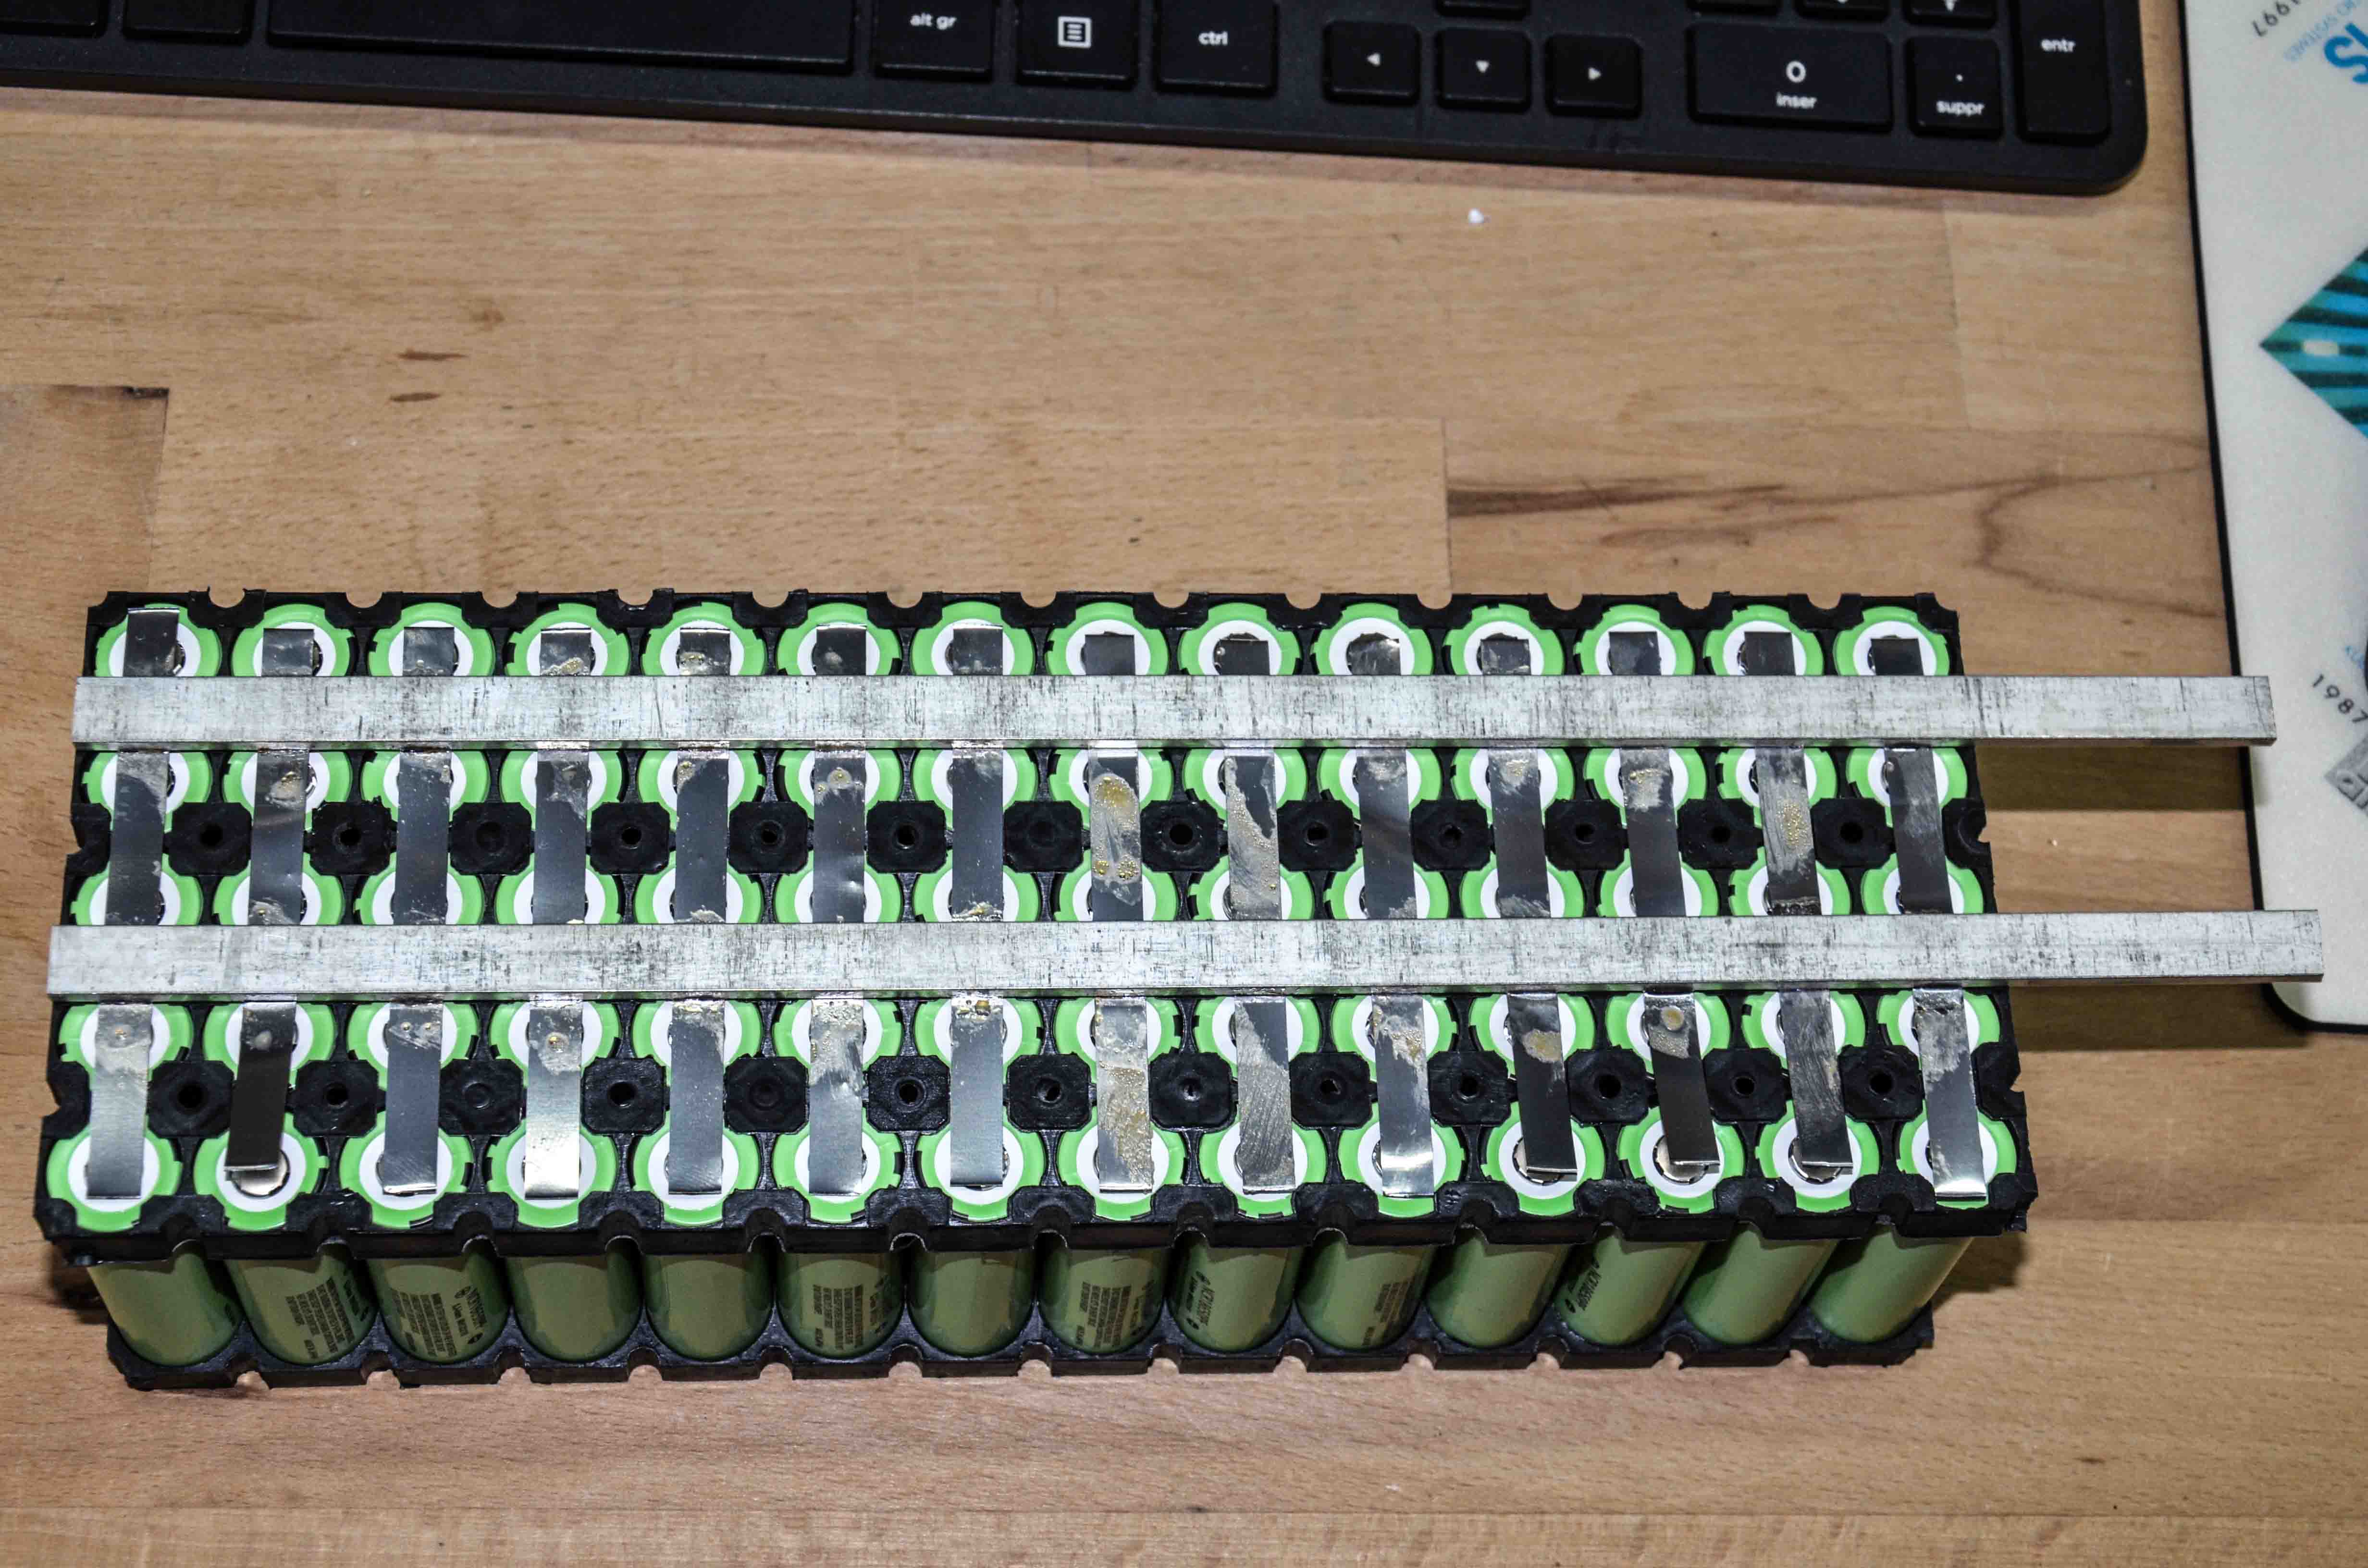
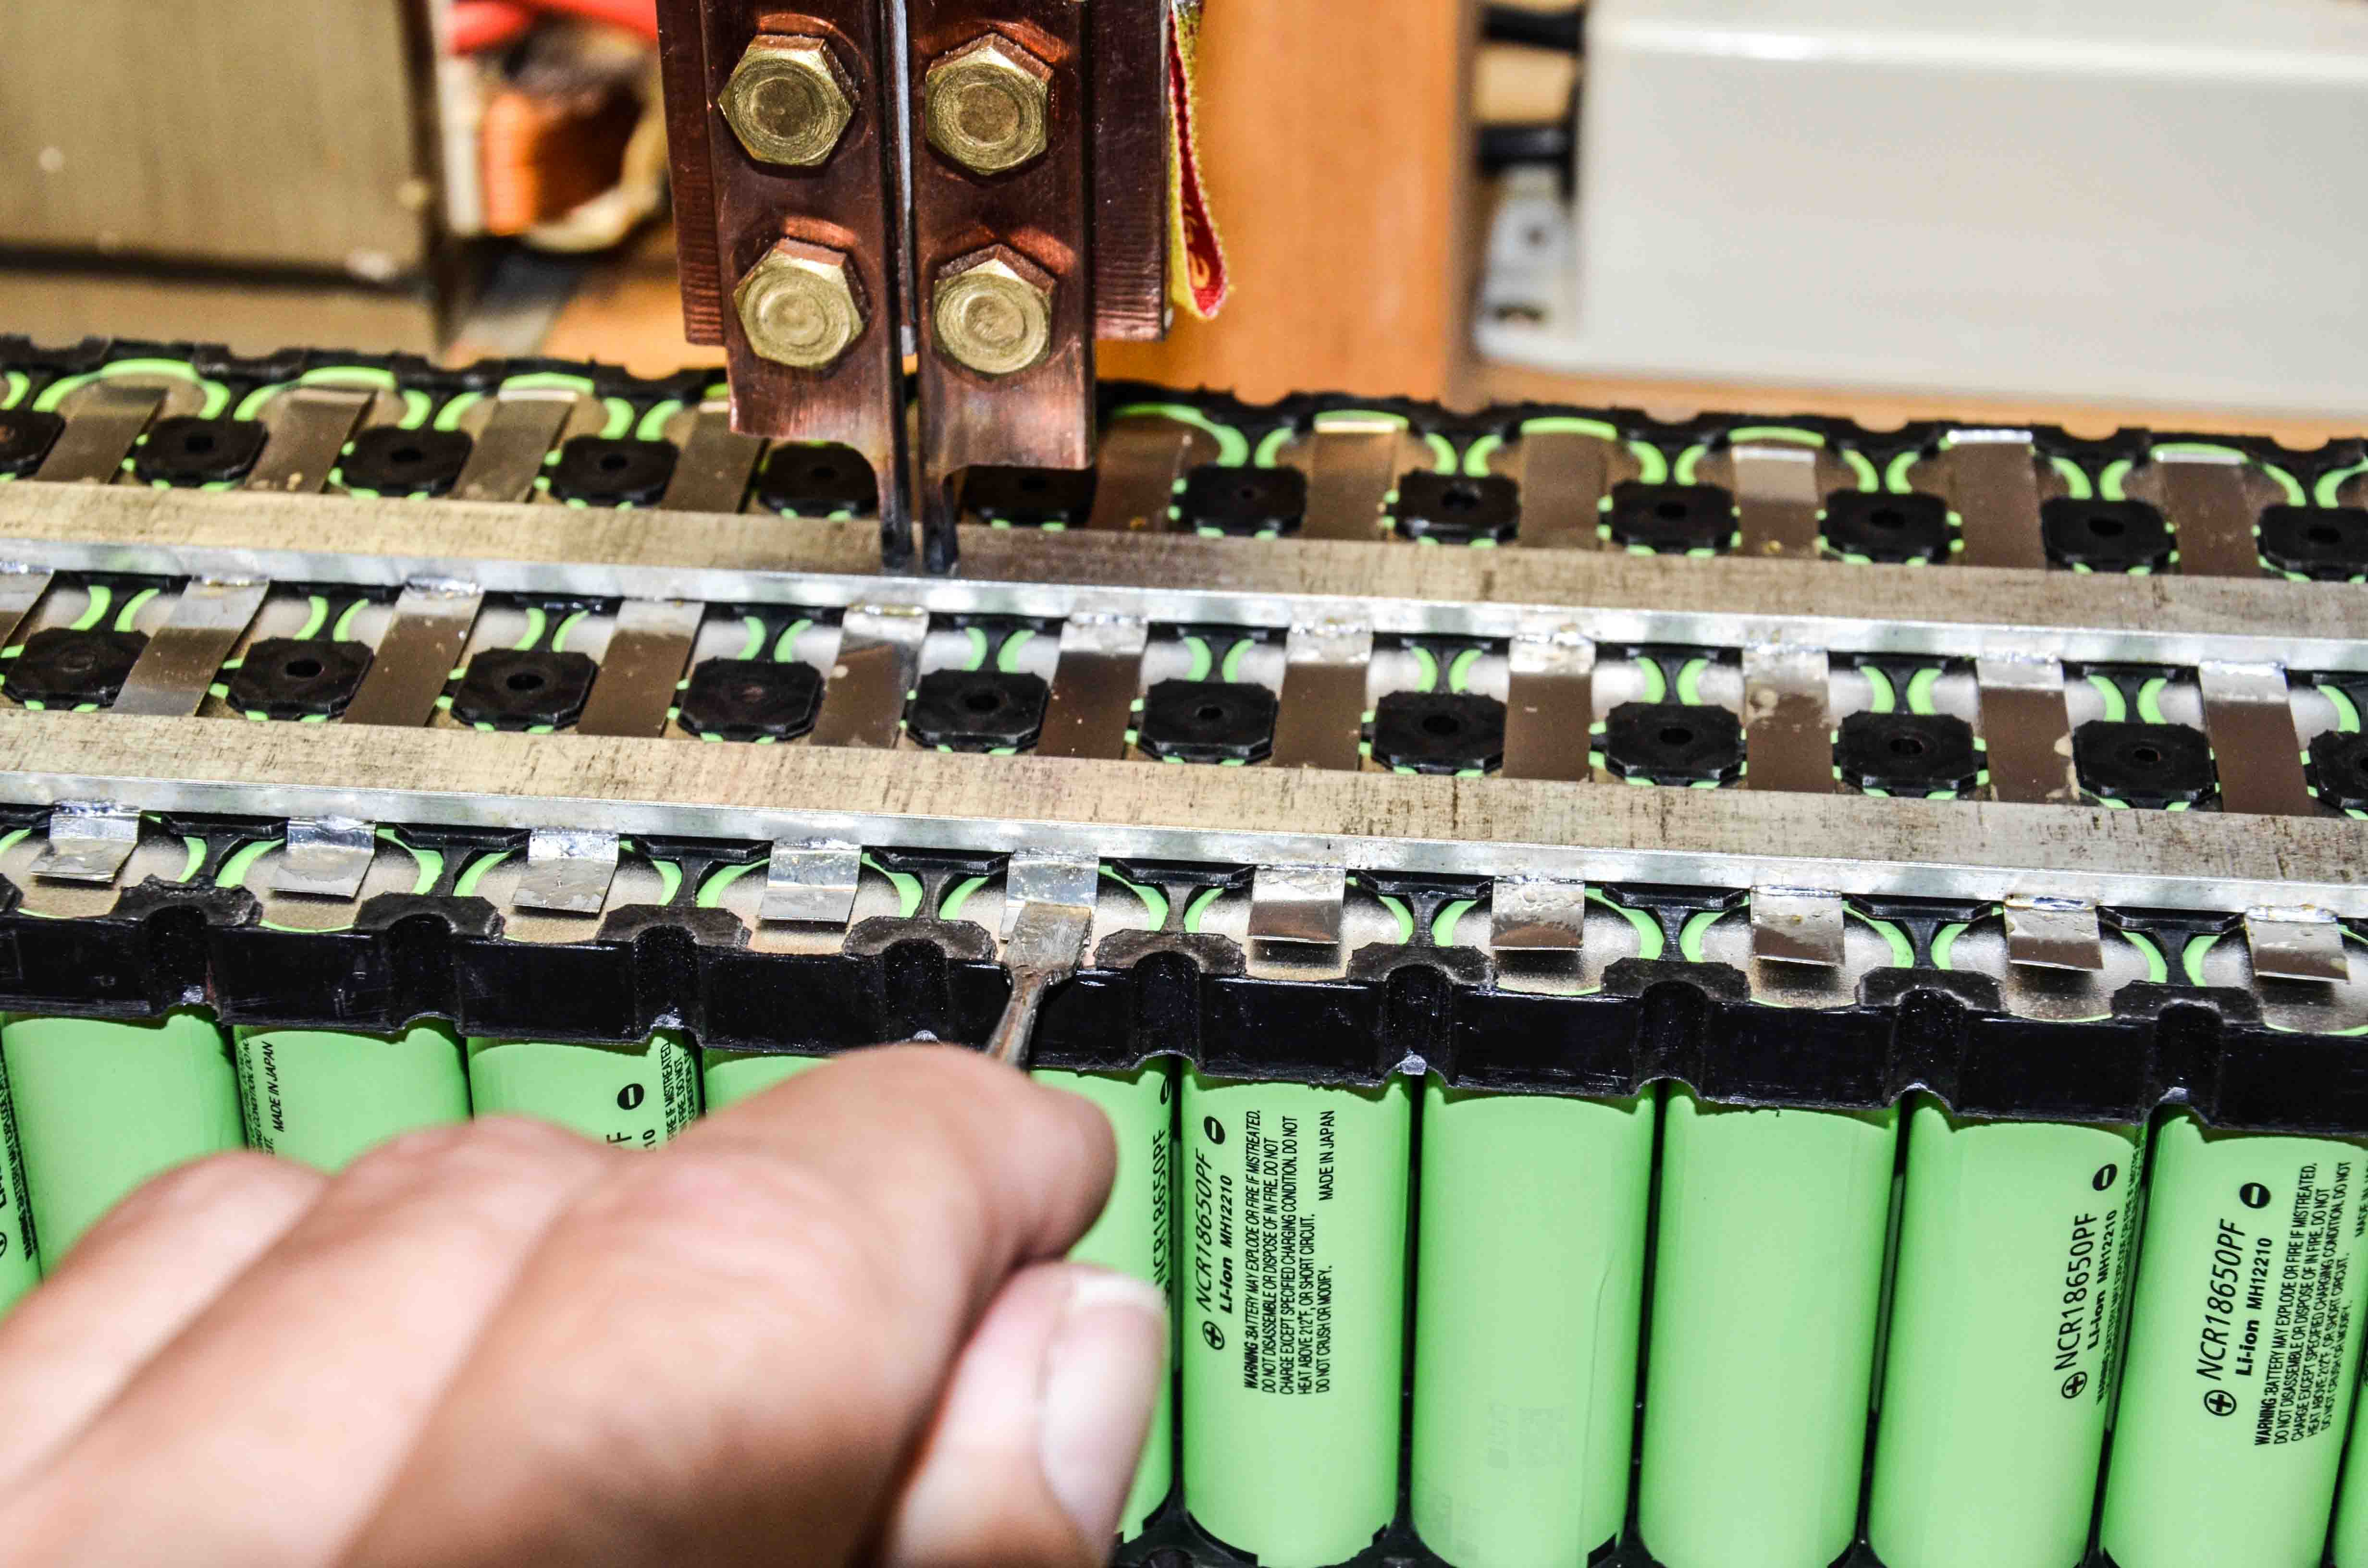
Assembly Step 5: Spot welding the positive and negative fishbones
The fishbones must be precisely positionned on the battery frame before welding starts.
![]()
The strips are manually pushed down on the batteries terminals to facilitate welding
![]()
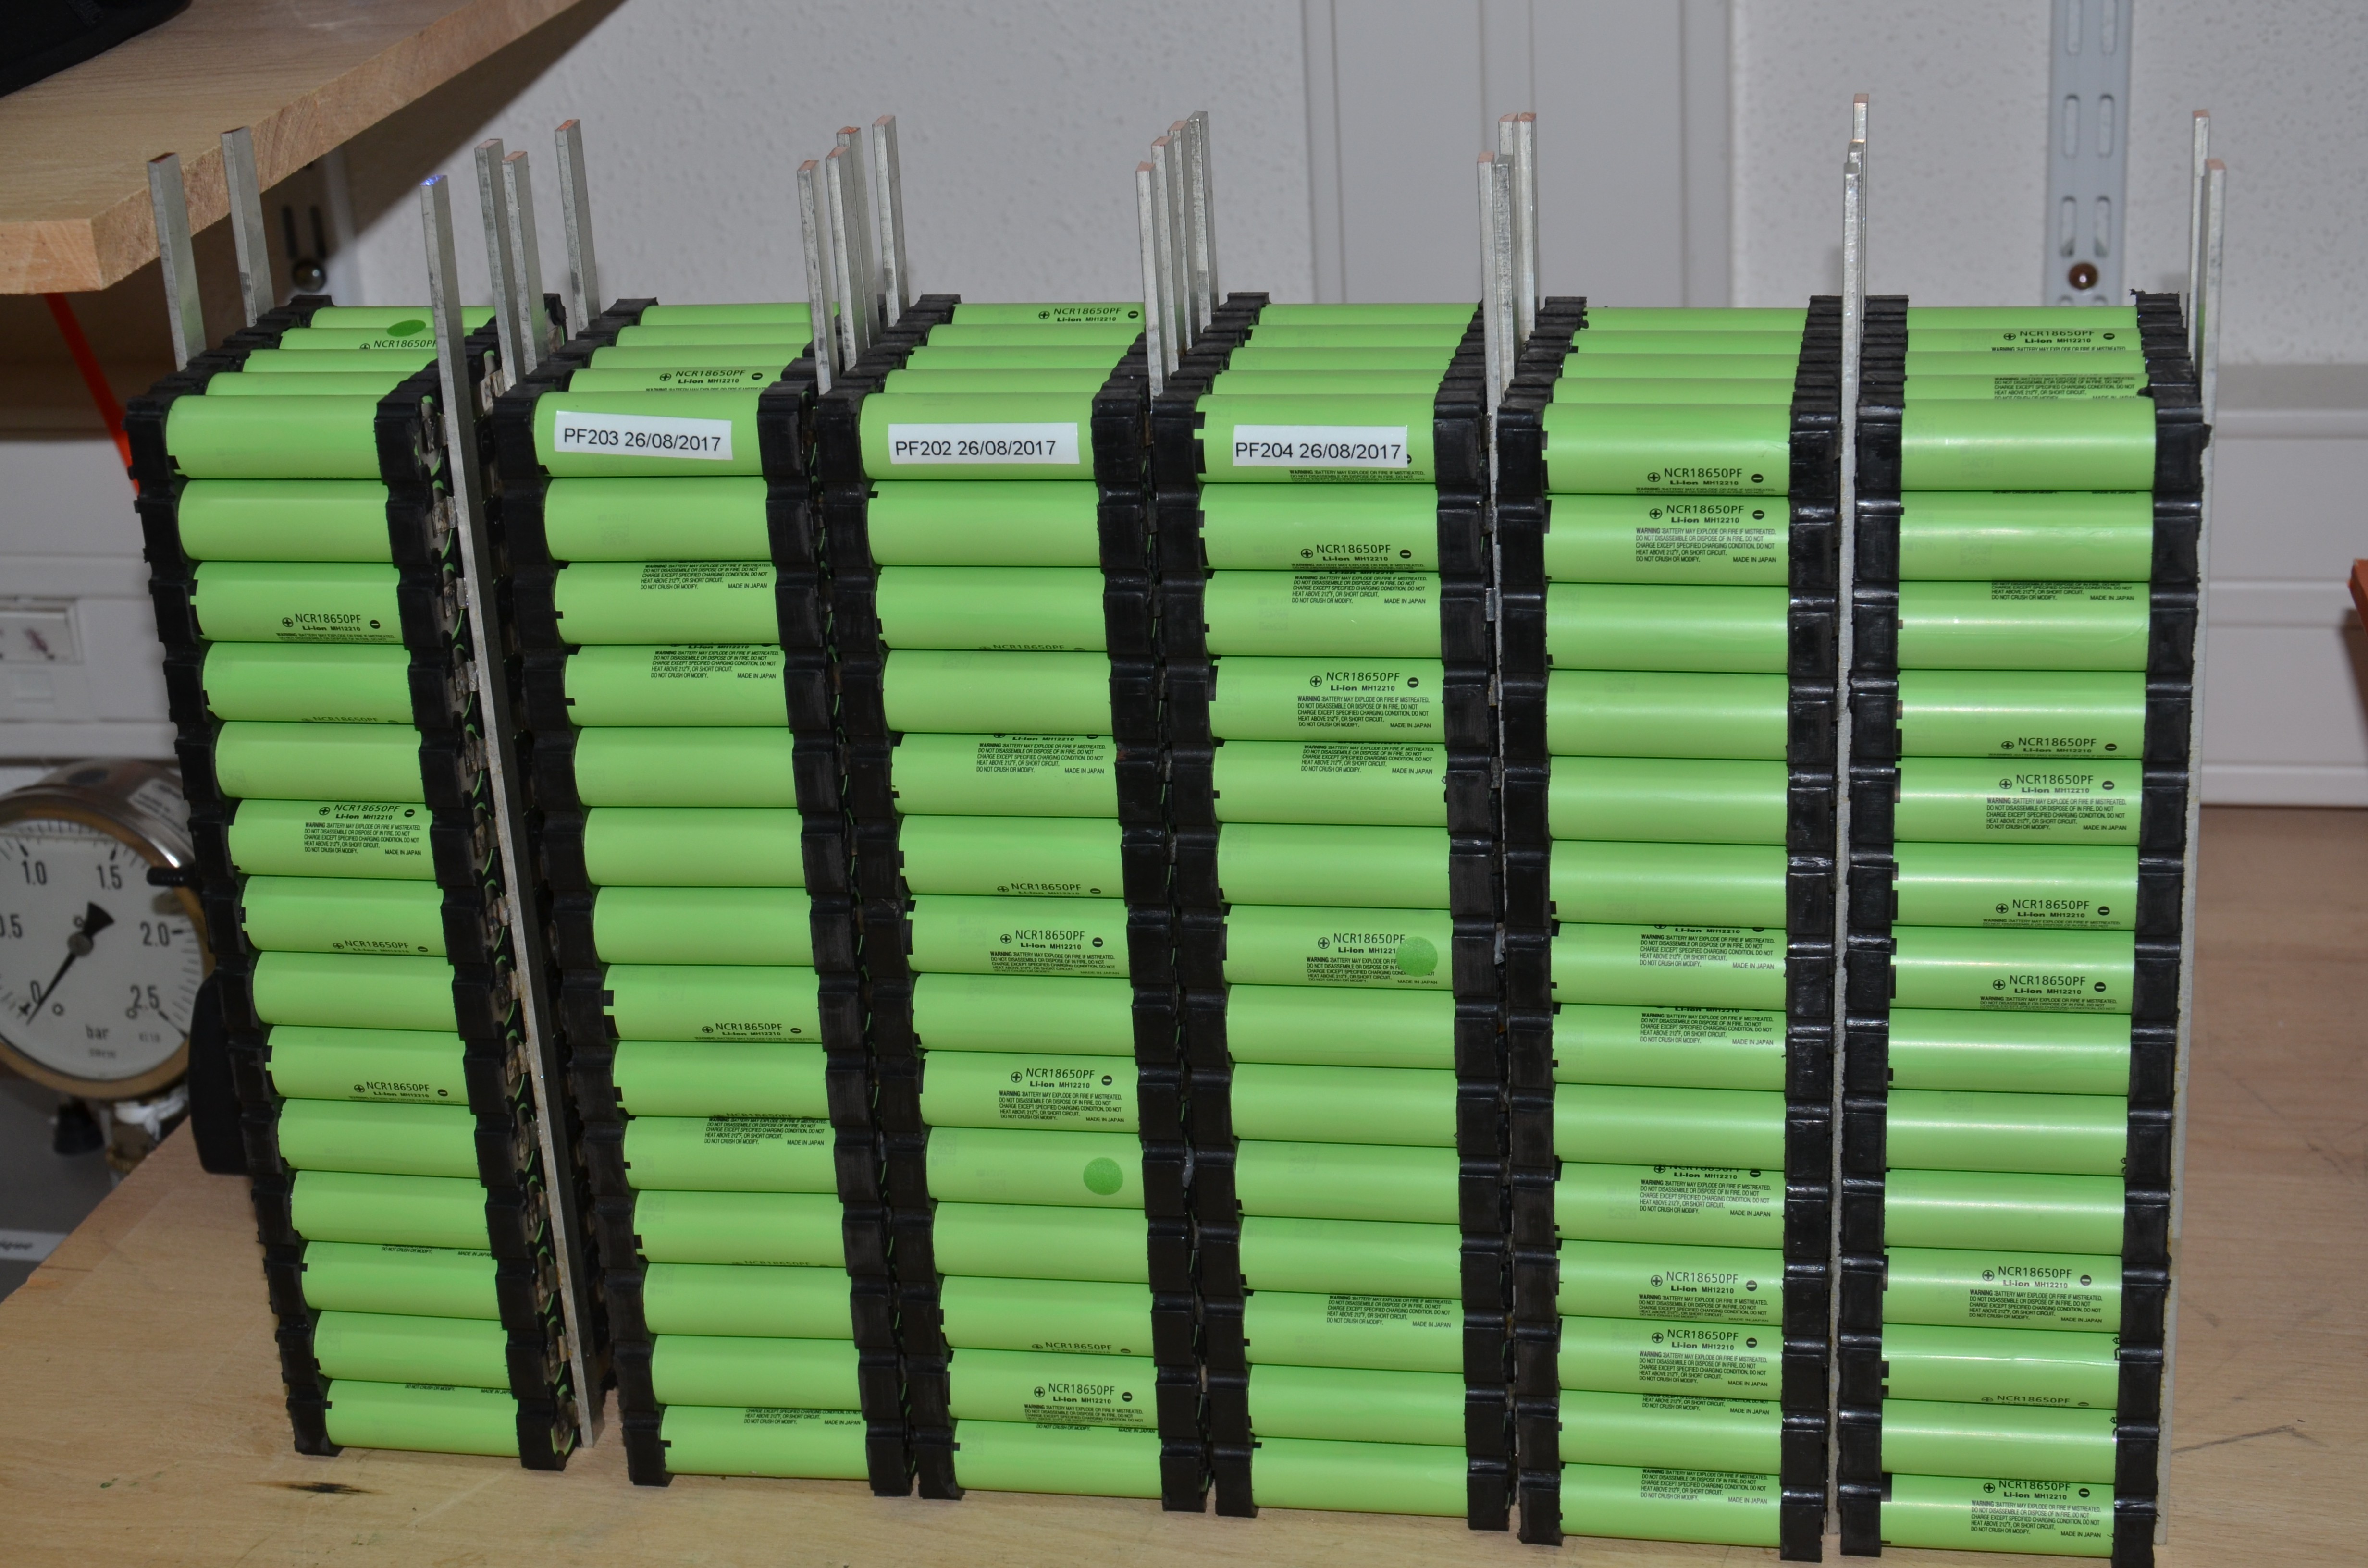
6 finished modules, ready for use
![]()
9 Modules ready for welding
![]()
-
NEW PANASONIC NCR18650PF Module Capacity Test
08/20/2017 at 04:36 • 0 commentsI have run a charge/discharge test on a module made of 70 brand new PANASONIC NCR18650PF cells. The cells were purchased at NKON in August 2017.
The measurements were made with my modular Lithium Battery Manager used in "Discharge Mode"
The parameters were the following:
Parameter Value Unit End of charge voltage 4.1 Volt Charging current 10 Ampere End of discharge voltage 3.0 Volt Discharging current - whole module 10 Ampere Discharging current - one cell 143 milli-Ampere
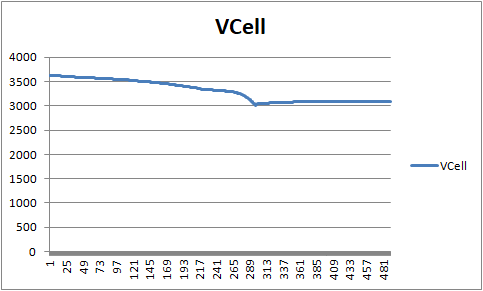
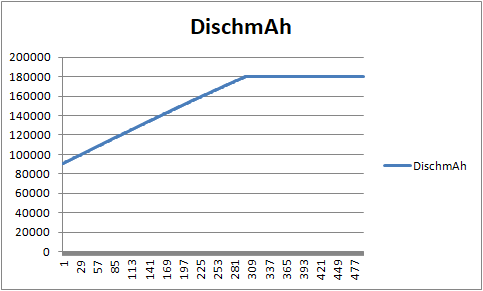
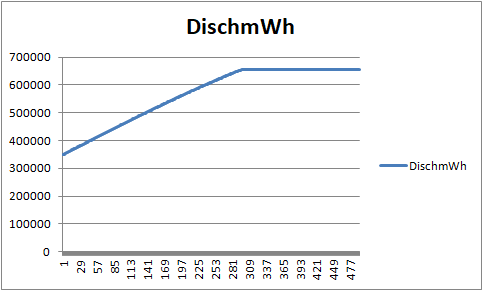
It took approximately 16 hours to discharge the module down to 3.0 Volts and the results are the following:
Parameter Value Unit Module capacity 180 Ah Capacity per cell 2570 mAh Restituted energy - complete module 656 Wh Restituted energy per cell 9.37 Wh
Conclusion:
The PANASONIC NCR18650PF cells are rated for 2900 mAh when charged up to 4.2 V and discharged down to 2.5 V. Taking into account that the end of charge voltage in my case was only 4.1 V and the end of discharge voltage was 3.0 V, the measured capacity of 2570 mAh is really great. This also proves that the batteries sold by NKON are guenuine PANASONIC cells.
The following curves show the last hours of the test
Module equipped with the Modular BMS:
![]()
I will perform the same test on a module which as made approximately 250 cycles in my solar system.
-
Balancing test video
05/28/2017 at 08:15 • 0 commentsI have made some tests to check the precision and efficiency of the balancing modules. Check the video out here
-
Balancing modules installation completed today
05/21/2017 at 20:43 • 0 commentsI managed to make a "mass prod" of 15 balancing modules - at last. They are installed on the modules now - see the details here
![]()
-
About Battery Temperature
02/18/2017 at 08:38 • 0 commentsSeveral hackers asked me about temperature management of the powerbucket, so let me give some info about this aspect.
Currently, I have put one sensor in the middle of the string. This sensor is attached to a 35 mm² bus bar, tight to the stack. I have a very good confidence in the measurements it provides. Of course I assume that the individual temperature variations between the 1000 cells are very small and can be neglected. This assumption has to be discussed, of course.
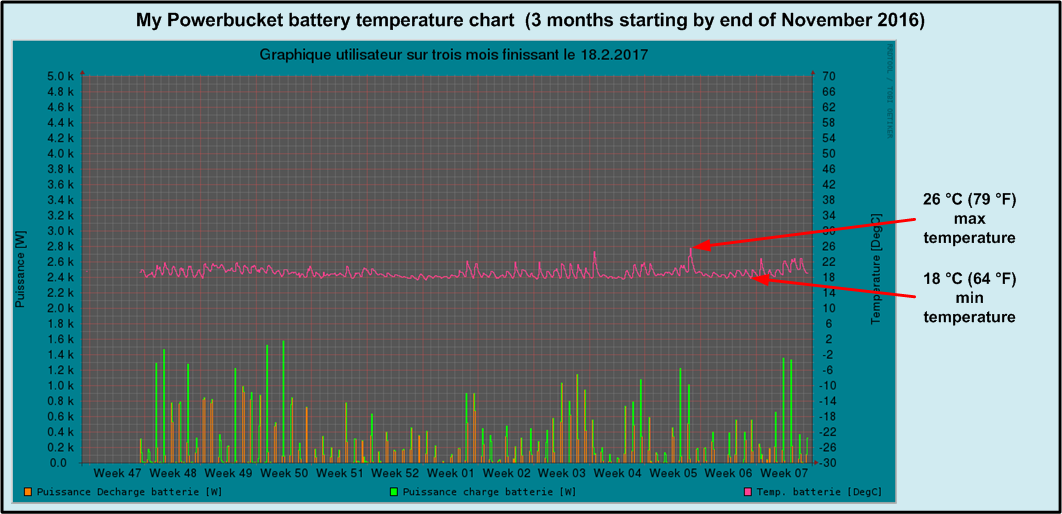
Thanks to my Raspberry Pi based solar data base I have produced a chart showing the temperature of the stack since its start of service in novembre 2016.
![]()
This chart shows clearly that the battery temperature remains close to the average room temperature of my house, namely 21 °C (70 °F). One can say that these temperature conditions are very safe for the stack. One can also assume that none of the 1000 elements gets a lot warmer or colder than the measuring point.
Why are the temperature variations so small ?
Batteries heat up when they are crossed by a current, regardless if it is a charging or discharging current. This heat comes (mainly) from the power (Joule effect) dissipated in the internal resistance of the cell:
P = R * I²
Where
P = dissipated power (Watt).
R = Internal resistance of the battery element (Ohm)
I = current flowing through the element (Ampere)Let us assume a current of 140 A flowing through the stack. This represents a power of nearly 8 kW. In my system, this can last only for a few minutes, due to inverter power limitation.
The internal resistance of a module, composed of 70 cells wired in parallel is about 1 milliOhm.
Power dissipated by one module = 0.001 * 140 * 140 = 19.6 WattPower dissipated by one 18650 cell = 19.6 / 70 = 0.28 Watt. This is the power rating of a small through hole resistor. Such a small power cannot heat up a 18650 element significantly.
Keep also in mind that if the current is of 70 A (half of 140), this power is divided by 4 !
This is why my Powerbucket needs no cooling system.
-
A perfect cycle
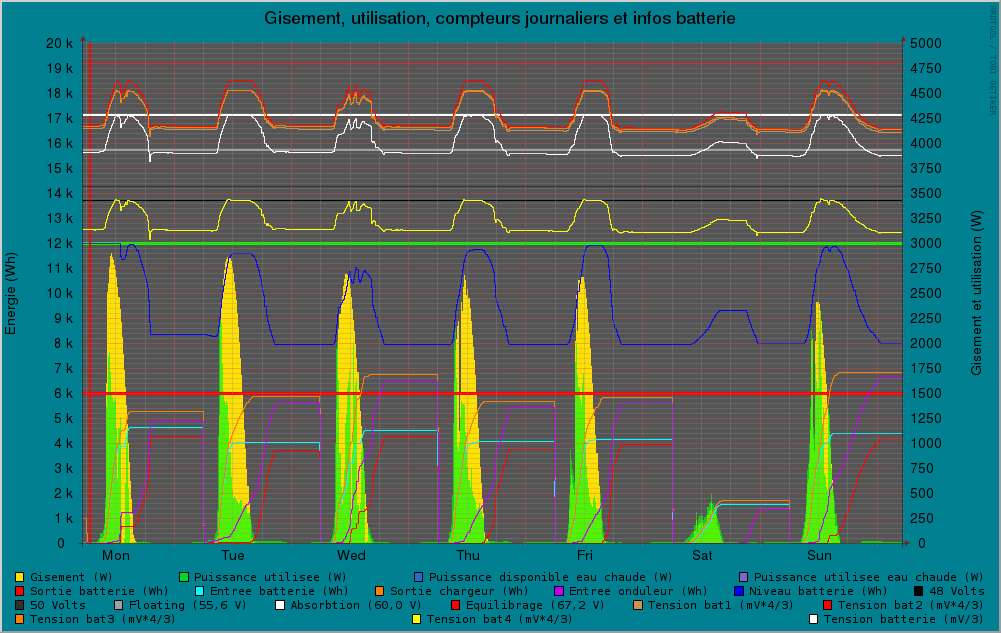
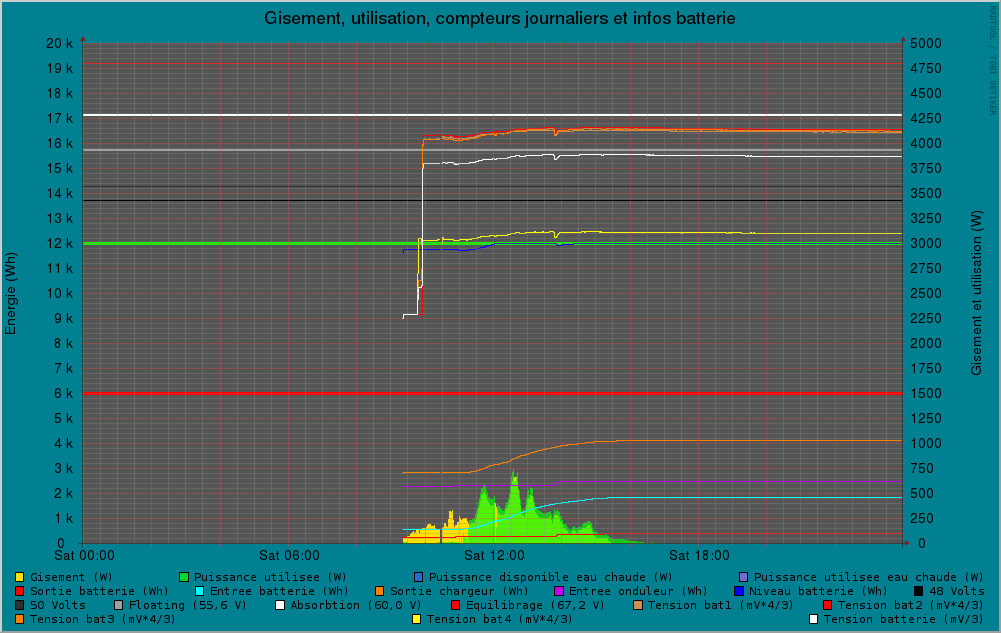
12/09/2016 at 04:16 • 0 commentsThe power/energy curve of yesterday December, 12th 2016 is the following:
![]()
First thing: one can see that the most part of the available energy (yellow area) has been used (green area) by the PV system. That's very positive. The flat top of the green area is due to the charging current set to 40A. I will change this parameter to 60 A today (maximum of the charger is 70 A).
The battery state of charge (blue curve) has changed direction serveral times during the day, indicating a heavy and rapidly changing power usage.
The interesting curves are the following ones (all of them located at the bottom of the chart, below the thick green line ):
- Orange: energy delivered by the charger
- Magenta (pink): energy absorbed by the inverter
- Cyan (green): energy absorbed by the battery
- Red: energy delivered by the battery
At 8 AM, the state of charge (blue curve) was at 8 kWh (scale on the left)
The 4 energy curves were at 0 kWh.
At 8 PM, the state of charge (blue curve) was again at 8 kWh (scale on the left)
The Orange curve and the Magenta curve are both at 11.5 kWh approximately. That means that all the power delivered by the solar panels has finaly been used by the house.
The Cyan curve and the Red curve are also superposed at about 5.5 kWh. That means that from 8 AM to 8 PM, the battery managed to absorbe and deliver again the same amount of energy.
Among the 11.5 kWh delivered by the sun:
- 11.5 - 5.5 = 6. kWh were directly used by the inverter (approximately)
- 5.5 - 4 = 1.5 kWh were stored and delivered again by the battery during day time (approximately)
- 4 kWh were deliverd by the battery after sunset
The fact that the in/out curves are so nicely superposed at the end of the day shows the astonishing efficiency of the lithium technology. I never got this kind of curve whith the lead-acid batteries.
-
My first week with Lithium - an overview
12/05/2016 at 04:23 • 0 commentsMy Powerbucket has been working for a week now and it's time to have a first look at the curves and figures.
By chance, the last week was globally very sunny, and I had enough power to fill up the stack with photon juice nearly every day.
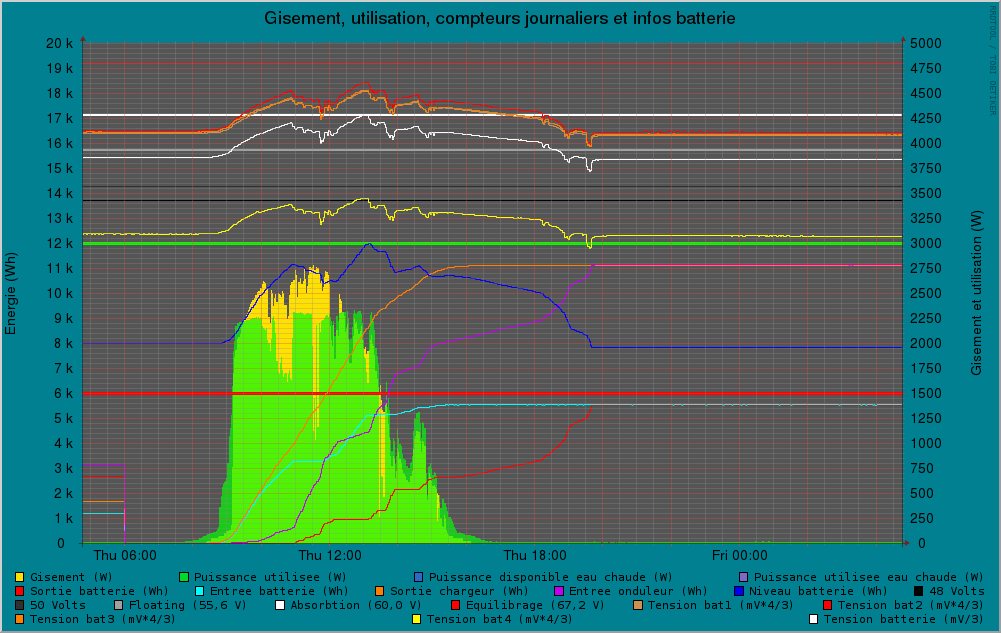
The following chart shows the data between Monday, November 28th and Sunday, December 4th 2016.
![]()
The white curve near the top shows the battery voltage. It varies between 54V (3.6 V/cell) and 60.0 V (4.0 V/cell) , which is quite good and safe for the cells.
The blue curve in the middle is the fuel gauge. It shows that the battery gains and looses 4 kWh during each cycle. This represents 4/11 = 36 % of its nominal capacity. This is also very conservative. I will probably increase the depth of discharge to at least 50 % once the new ballancing BMS is installed.
For the moment the parameters are good and I will go on running with these settings for a while.
-
First Charge / Discharge Cycle
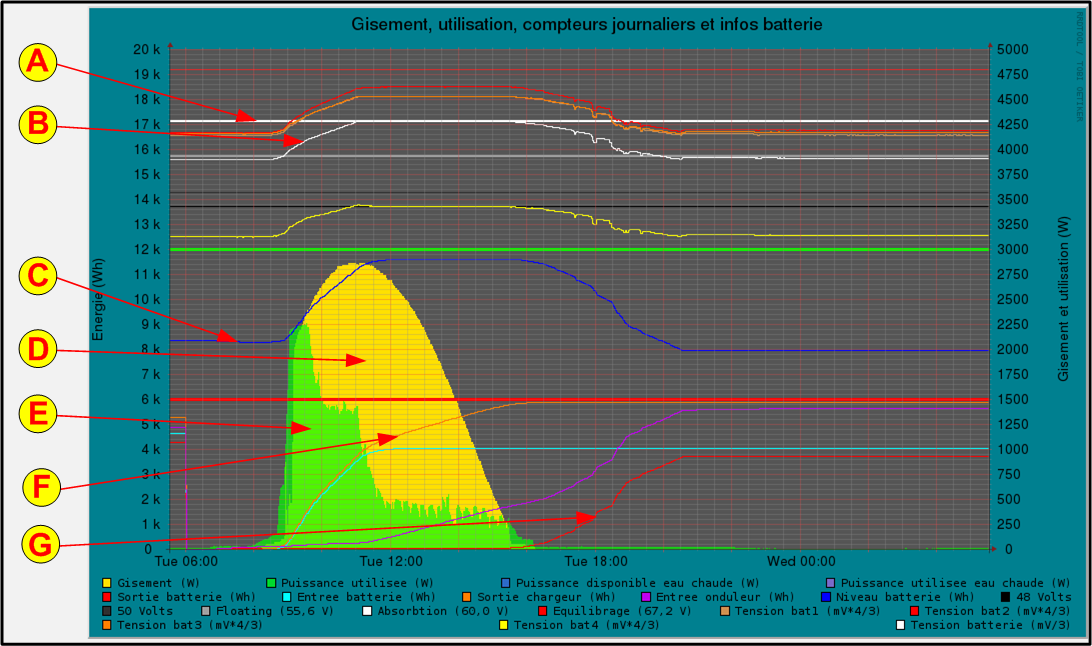
11/30/2016 at 05:36 • 2 commentsThanks to the bright and sunny day, the batteries could perform their first charge / discharge cycle yesterday:
![]()
- A - This thick white horizontal line indicates the end of charge voltage. Currently set to 60 Volts. This corresponds to 60 / 15 = 4 volts per element. This is a very safe end of charge voltage for LiIon batteries.
- B - This white curve is the voltage of the stack. During the night, this voltage was of about 54 V (3.6 Volts / element). At 8:50 AM the sun began to shine (brutaly) on the panels and the charge started. The voltage rose up to exactly 60.0 V which was reached at 11:00 AM.
- C - This blue line is the State Of Charge (Fuel Gauge). Its max is set currently to 12 kWh. (Thick green horizontal line) and min to 6 kWh (Thick red horizontal line). During the cycle the SOC started at 8.5 KWh, reached approx 12 KWh and decreased to 8 KWh.
- D - The yellow area is the solar potential - eg the maximum solar power available at any time. Its smooth envelope indicates that the sky was perfectly clear during all this day.
- E - The green area depicts the solar energy used. The power reached 2250 Watts (see the scale on the right) during the first part of the charging cycle (constant current phase), then decreased to 1500 Watts (constant voltage phase). and then to approx 350 watts ("noise" floor of the house).
- F - The orange curve indicates the energy delivered by the charger: it reached approximately 6 kWh at 4:00 PM.
- G - The red curve is the energy delivered by the battery. The battery started delivering power when the sun went down at 3:30 PM. The battery had delivered 3.6 KWh when the system switched automatically back to the grid power.
A few comments:
The battery behavior is really great. Its voltage reflects well its state of charge.
The system switches currently automatically back to grid when the battery has lost 4 kWh. This figure could be increased to 6 or 7 kWh to use more of the battery capacity. (Nominal capacity is 11 KWh).
-
First Power On
11/27/2016 at 13:49 • 0 commentsThe first power on occured at 9 AM on Novembre, 26th.
The "old" lead-acid BMS was adapted to accomodate the voltages and thresholds of the lithium battery.
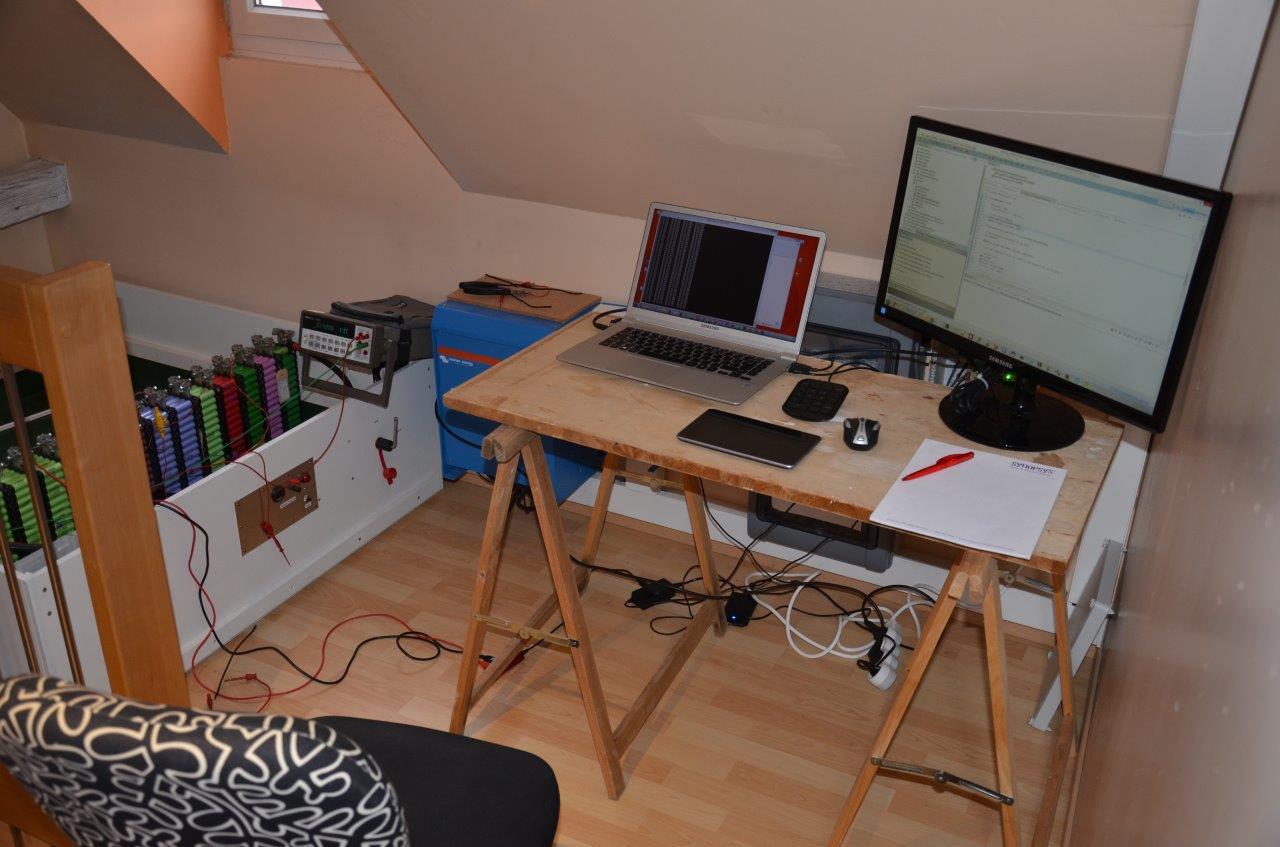
I installed a temporary desk in order to perform the necessary changes in the BMS software:
![]()
Monitoring the voltage with my DMM. The Nexus 7 tablet on the right displays the system real time status:
![]()
The weather was very dull yesterday. The sun gave bearly 1 KWh of energy on the whole day:
Charging of the battery started approximately at 11 AM (when the yellow area turns green). The first tests show that the modules are very well naturally balanced and behave very well under load (minimal voltage drop under heavy load). The batteries are currently at approx 50% state of charge.
In depth electrical test will be performed later.
See the real time curve
![]()
The weather should be much sunnier tomorrow. This will allow a full charge of the stack.
A 110 kWh Powerbucket
The lead-acid batteries of my off-grid solar system are dead. I will replace them by a 18650 batteries stack housed in a big wooden box.