-
We are back!
09/27/2022 at 07:05 • 0 commentsWe are back! This time, I aim to condense the entire device to a very small and comfortable flex-PCB form factor that can be easily customized and worn. More updates to follow! Apologies for the blackout!
-
A Brief, but a Successful Attempt
10/04/2016 at 14:46 • 0 commentsBack in the 1980's, Stephen Laberge pioneered an experiment in which he used a specific set of eye-movements to indicate that he was dreaming lucidly. The result of that experiment was the proof that was needed to show that Lucid Dreaming was, indeed, real.
Since then, this technique of using eye-movements as a signal have been used in various studies. For instance, it has been used to study dream muscular movements (Erlacher et al. 2003), analyze EEG activity of Lucid Dreaming (Voss et al. 2009), as well as Brain imaging studies (Dresler et al. 2011).
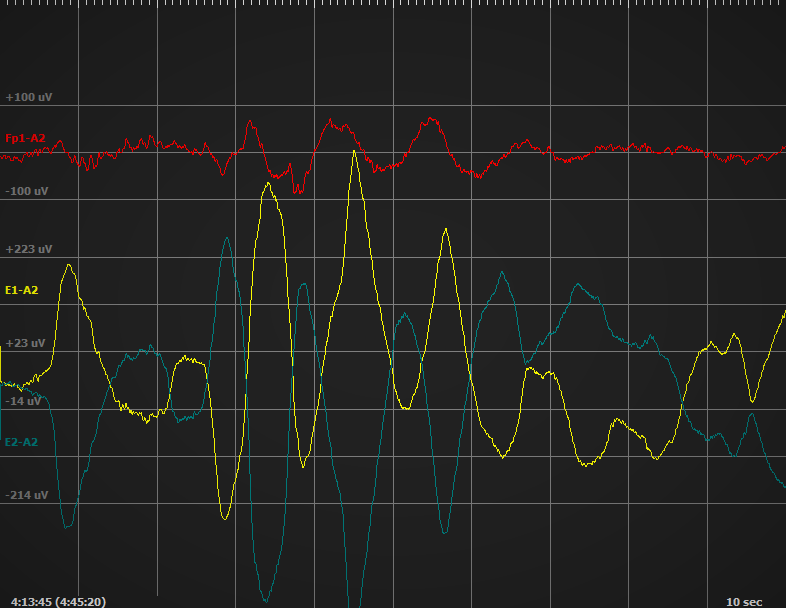
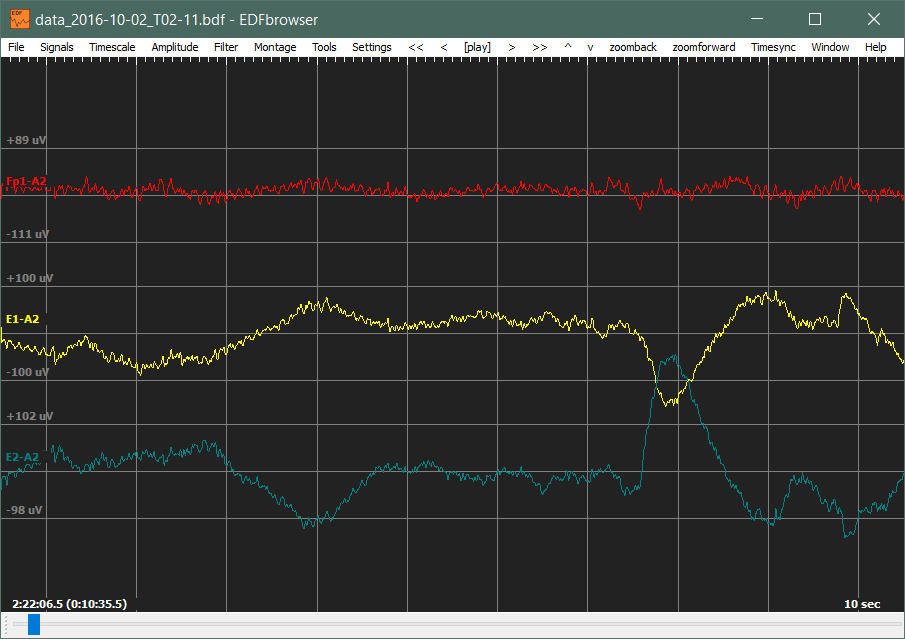
Here, I replicate the above experiments using the OpenLD platform. The results of my eye-movements are shown below:
Here, I moved my eyes left - right for around 2 to 3 times. You can see the out-of-phase deflections from the EOG signals that indicates eye movement.As of right now, it is too early to mark that as a successful attempt, but it is nonetheless a motivating result. I will continue to experiment with the OpenLD platform and post more results in the future. Thanks!
Sources:
Windt, Jennifer M., "Dreams and Dreaming", The Stanford Encyclopedia of Philosophy (Spring 2016 Edition), Edward N. Zalta (ed.),
-
The Software: OpenLD First Analysis
10/01/2016 at 21:14 • 0 commentsResults
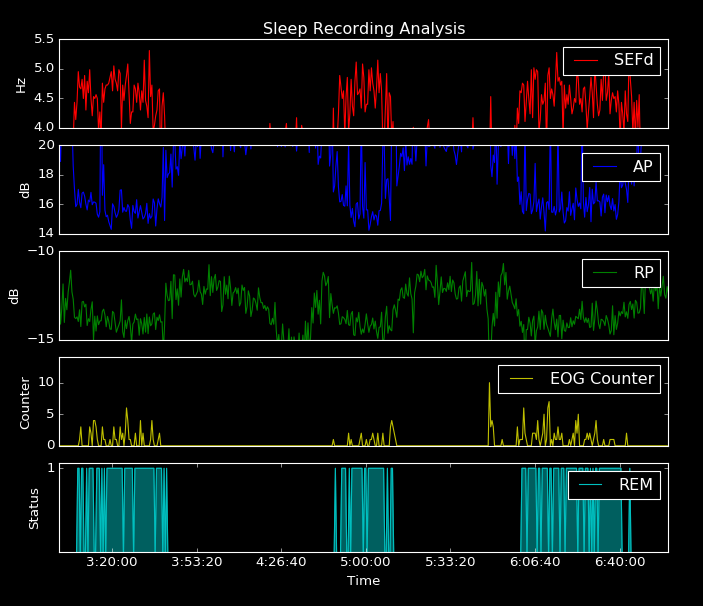
A plot showing the analysis of sleep ranging from around 3:20 AM to 6:50 AM is shown below:
The first 3 graphs show the statistical values for the REM stage detection algorithm (SEFd, AP, and RP). You can see that whenever the REM stage takes place, the SEFd value increases dramatically while the AP and RP values decrease. The results of the algorithm is shown in the last (fifth) plot.
Again, we should remind ourselves that during REM stage, there are Rapid Eye Movements (duh). Therefore if our program is working correctly, then the results calculated from the EEG brainwave signals must be filled with eye movements.
Let's see if that is true: the fourth graph shows the EOG counter, which is the frequency of eye movements detected from the EOG channels. We can see clearly that there is a correlation between eye movements (yellow) and the REM stage (blue)!
Note that the REM stage shown in the graph was calculated only from the EEG electrode and not from any of the EOG channels. Therefore, the correlation between the two demonstrates that our program, is indeed, correctly detecting REM stages!
Example of Sleep Stages
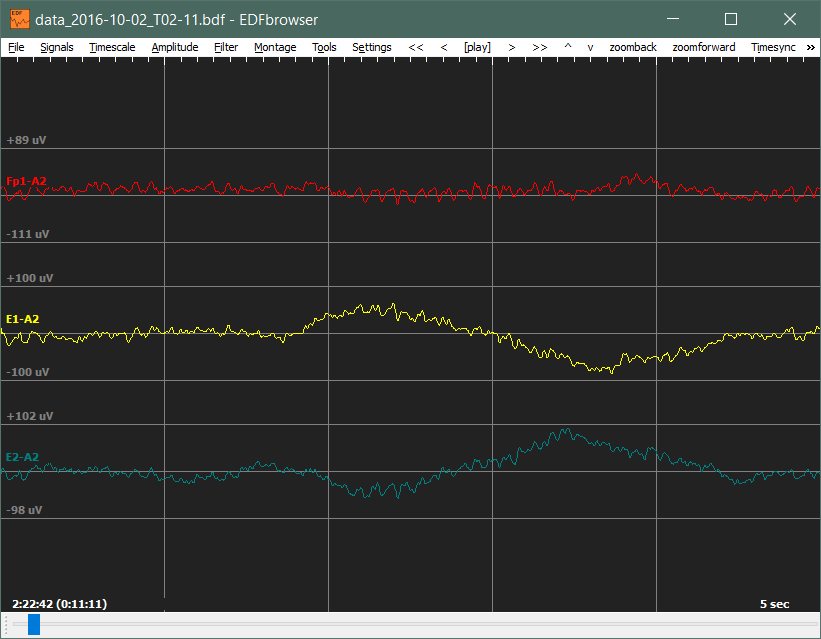
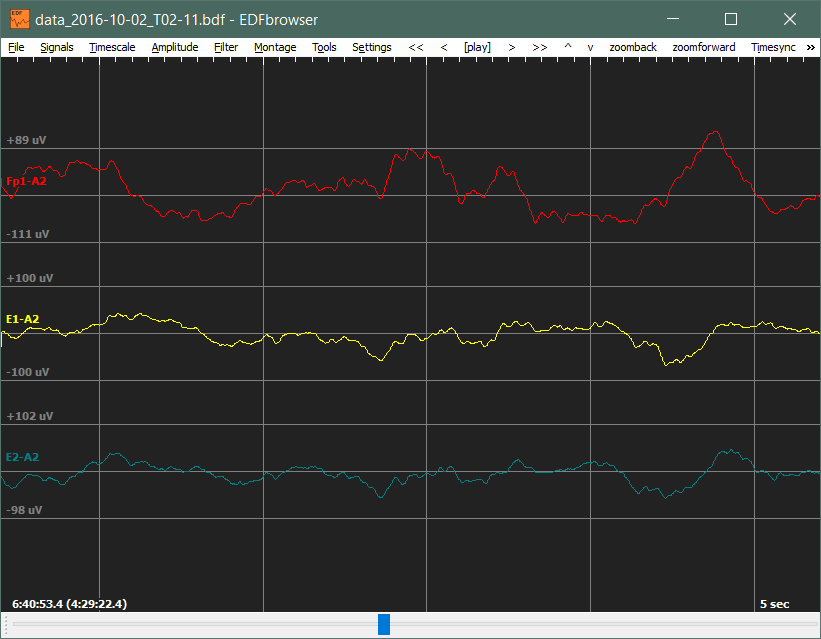
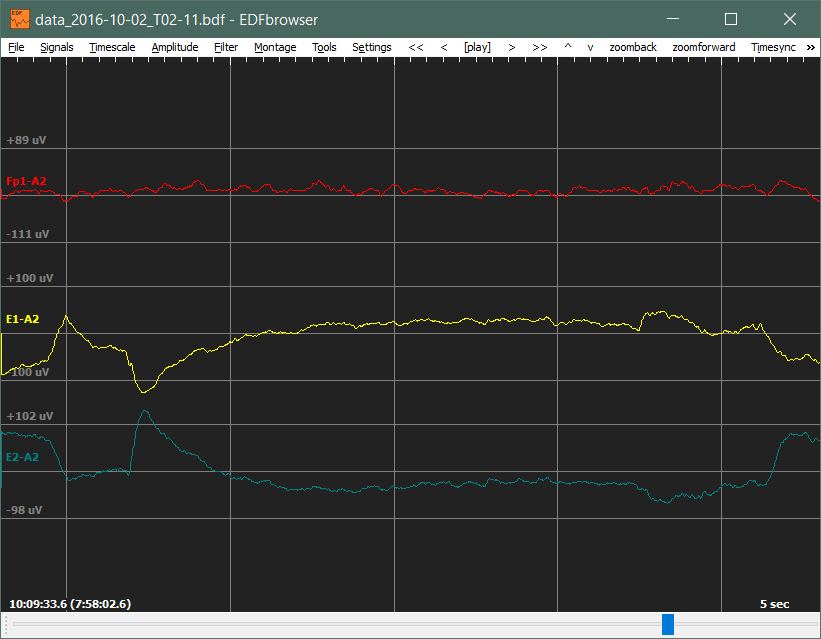
According to the OpenLD analysis software, here is how each sleep stages look like. Note, the EEG signal has a red color while EOG Eye movement signals are yellow and dark blue.
Awake Stage: Note the presence of Alpha waves (10 Hz) and slow, eye movements (out-of-phase signals)
NREM: Note the presence of Delta waves ( > 4 Hz) and no eye movements (the two signals are in-phase)
REM: Note the lack of presence of alpha/delta waves and the presence of Rapid Eye Movements.
Reference used for the above evaluation
Benbadis, S. R., & Lutsep, H. L. (2015, October 12). Normal Awake EEG. Retrieved October 02, 2016, from http://emedicine.medscape.com/article/1140143-overview
Now we know that the OpenLD platform can successfully detect whether or not a person is dreaming. This is essential in inducing Lucid Dreams. In the next post, I will discuss how I will induce Lucid Dreams by making the OpenLD play a sound in my dreams. Stay tuned!
-
The Software: The Full OpenLD Analysis Program
10/01/2016 at 20:38 • 1 commentIn this post, I will now talk about the complete OpenLD analysis software. I will demonstrate what it does and how to use the software. All the source code for the software is located in the Github repo here! (Also located on the left Project sidebar). A pre-alpha windows build will be available very soon in the Github repository.
OpenLD Software Overview
Here is a GIF File demonstrating the program in use:
We enter information such as the number of channels that we are going to use, the channel labels, the EEG channel number, and the delay for alarm (in hours). Afterwards, it connects to the OpenLD and initiates a terminal over the Bluetooth SPP. In this terminal prompt, appropriate channels can be activated (C#) along with impedance checking (I#). Commands such as P and S displays the ADS1299 internal registers, while the command E exits the terminal and starts the analysis procedure.
The next display shows the impedance values, which shows signal connection quality, and the current status and time. The program continuously displays the above information until the user manually quits the program using Control-C.
This is where all the REM analysis takes place. A sound file, that is in the same directory as the executable, with a name rem_alert.wav is played when an appropriate REM stage is detected. Then, it will wait at minimum 7 minutes before another trigger to give the dreamer a chance to induce Lucid Dreams.
When the program is running, it logs the received bio-signals into a BDF file called data_###.bdf, where ### contains the date and time information. Also, it logs the analysis information, which contains values for SEFd, AP, RP, Eye Movement counter, and REM stage status, into a file called analysis_###.txt, where ### is again the date/time.
The BDF file (data_###.bdf) can be opened with an open-source browser called EDFBrowser by Teuniz:
The above shows the Fp1-A2 forehead EEG channel along with two EOG channel electrodes. You can see the prominent alpha rhythm (10hz), which is induced when a subject has his/her eyes closed and relaxed. (Benbadis et al.)
More information about the program will be presented as it is developed. Currently, the program is in a pre-alpha state, hence there are many improvements that will be made. However, it is fully functional to induce lucid dreams! In the next project post, I will demonstrate what different type of sleep stages look like and evaluate the performance of the software.
Sources
Benbadis, S. R., & Lutsep, H. L. (2015, October 12). Normal Awake EEG. Retrieved October 02, 2016, from http://emedicine.medscape.com/article/1140143-overview
-
The Software: EOG REM Detection Implementation (Code)
09/28/2016 at 20:00 • 0 commentsNow that we have derived the expression (the Inverse Dot Product) for calculating the magnitude of eye movements, we can begin its implementation. The C++ code for it is pretty simple:
int remDetect::evaluate_EOG_REM_Epoch(double *EOG1, double *EOG2, double min_EOG)
{
    // Resat accumulator
    avg_EOG_IP = 0;
    // Optimized algorithm - it is equivalent with += (EOG1 - EOG2)^2 - (EOG1 + EOG2)^2
    for (int i = 0; i < m_size_window; i++) {
        avg_EOG_IP += -1.0 * EOG1[i] * EOG2[i];
    }
    // Average
    avg_EOG_IP /= m_size_window;
    // if the value is within the limit window then return 1, else 0
    if (avg_EOG_IP > min_EOG) {
        rem_eog_Counter++;
        return 1;
    } else return 0;
}
In the code, you can see that I average (divide by number of EOG data points) the IDP after it has been calculated. This is to make sure that the constant min_EOG does not depend on the length of the signals and hence is portable across different EEG sampling frequencies. This function will return a 1 if it detects enough eye movements (above the min_EOG threshold) and a 0 otherwise.
There it is. We are done with the Lucid Dream Trigger portion of this project. In the next Project Log, I will give a general overview of how to use the OpenLD Software.
-
The Software: EOG Eye Movement Detection Overview
09/28/2016 at 10:09 • 0 commentsLast time, I talked about the EEG REM detection portion, which was the first REM verification step of the program. However, to further increase the accuracy of the detection algorithm, another REM detection algorithm is used. This algorithm will use EOG (Electrooculography) to detect Rapid Eye Movements (REM) during REM sleep.
Derivation of the EOG Eye Movement Detection Algorithm
If you are not interested in the mathematics of the algorithm, skip to the next section!
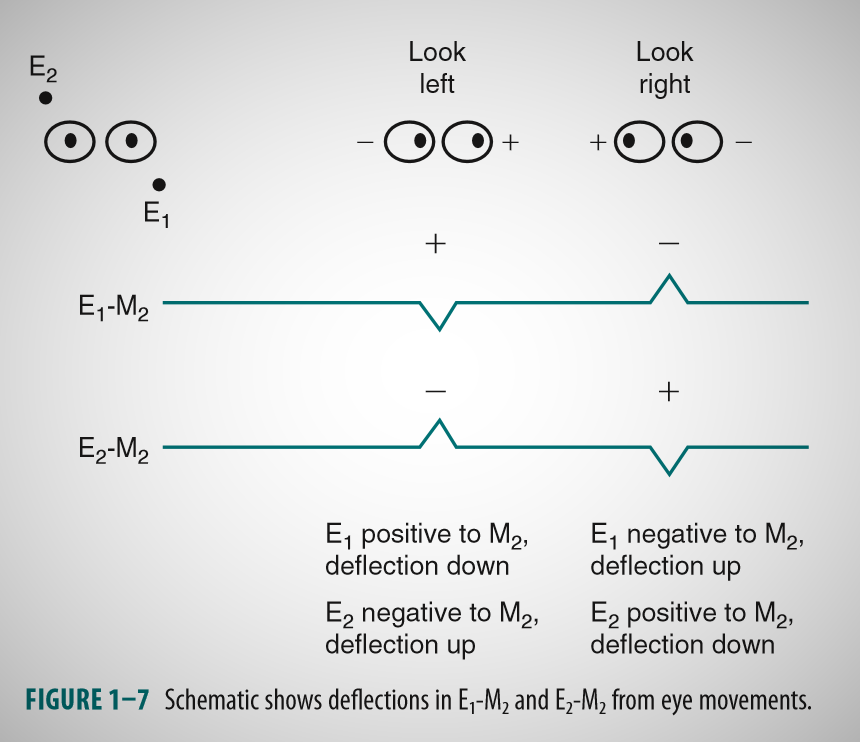
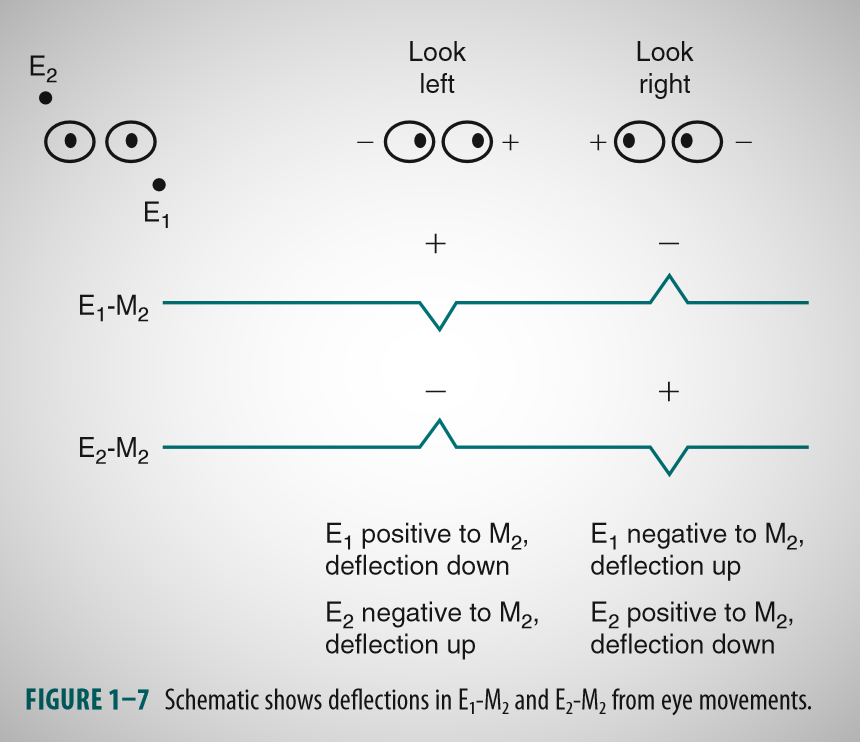
Eye movements produce a specific pattern in EOG signals, due to the potential difference between the front and the back of a human eye. This pattern is described in the figure below: (Adapted from Kerkhof, G. A., & Van Dongen, H.)
![]() As you can see from the above figure, eye movements produce deflections which are always out of phase between the two EOG channels.
As you can see from the above figure, eye movements produce deflections which are always out of phase between the two EOG channels.The EOG REM detection algorithm relies on this fact to detect eye movements. Since the signals are out of phase, when we add the two signals, they cancel each other out. In contrast, if we subtract the two channels, the patterns add up. By combining these two features and taking their square, we can create the following formula:
where N is the length of the current signal (which is 250 SPS * 2s = 500 for 2 seconds of data), EOG1 is the E1-A2 channel and EOG2 is the E2-A2 channel. The EM value will be high for out-of-phase signals (thus eye movements), and low for signals which are in-phase (such as noise, muscle artifacts, etc.).
If we simplify the formula, we obtain the following: (Note, I replaced EOG with E for simplicity)
We can see that the formula simplifies to a negative dot product if we ignore the constant 4. This is quite intuitive: Taking a dot product of two signals yield a value that indicates how "similar" the two signals are ("signal correlation"). But if we inverse the value, then the value reflects how "different" the two signals are. This is desired as the eye movements are always out of phase.
This feature is called the Inverse Dot Product (IDP).
Implementation of the Algorithm
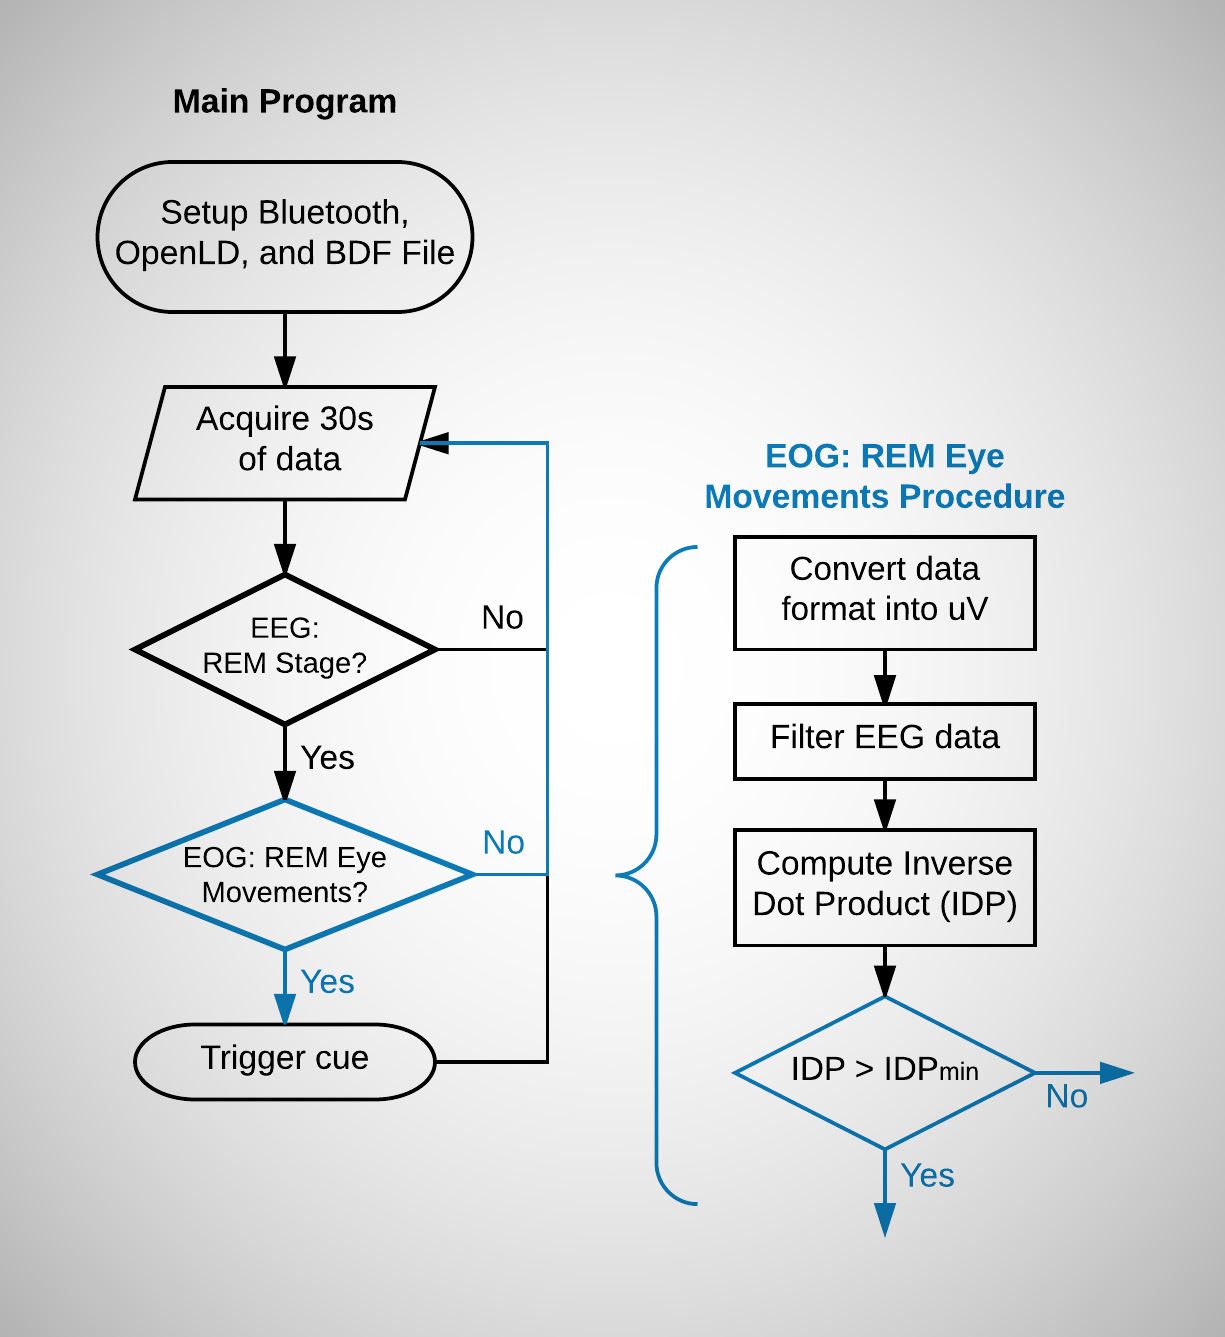
The implementation closely follows to that of the EEG REM detection algorithm, described in the previous Project Log. Here is the corresponding flowchart:
![]()
Like before with the EEG data, the EOG data is converted to micro-volt format and filtered with a band-pass filter (0.1hz - 35hz). The Inverse dot product for 2 seconds of the data (which is 500 samples for 250 samples per second A/D speed) is then computed and compared to a minimum threshold (IDP min). If the current sleep stage is determined to be REM, and the IDP is larger than the minimum constant, the sleep stage is determined to be REM and a lucid dreaming trigger is cued.
In the next Project Log, I will talk about the code for the above implementation.
Sources:
Kerkhof, G. A., & Van Dongen, H. (2010). Human Sleep and Cognition: Basic Research (Vol. 185). Elsevier.
-
The Software: EEG REM Detection Implementation (Code)
09/25/2016 at 14:21 • 0 commentsIn the previous Project Log, I talked about the EEG REM Detection algorithm (Imtiaz et al.). In this log, I will talk about the implementation of the algorithm in C++. Note, for the OpenLD software, I will be using Qt C++, due to its extensive cross-platform support and ease of use.
Implementation of REM Detection
I will list the C++ code along with its corresponding formula, which are explained in depth in the previous Project Log.
SEFd (Spectral Edge Frequency difference)
SEF(x) where x in the Percentage of Edge Frequency:
#define FREQ_TO_BIN(x, N_FFT, Fs) int(x * N_FFT/Fs)
#define BIN_TO_FREQ(x, N_FFT, Fs) int(x * Fs/N_FFT)

double remDetect::SEFx(double *spectrum, int x, int f_Start, double sum_SEF)
{
    double sum_fft = 0;
    for (int i = FREQ_TO_BIN(f_Start, m_size_fft, m_Fs); sum_fft < ((double)x) / 100.0 * sum_SEF; i++) {
        sum_fft += spectrum[i] * spectrum[i] * ((double)m_Fs) / ((double)m_size_fft);
    }
    return (((double)i) * ((double)m_Fs) / ((double)m_size_fft));
}
SEFd: the difference between SEF95 and SEF50
SEFd[epoch_Counter] = SEFx(spectrum, 95, f_Start, m_SEF_sum) - SEFx(spectrum, 50, f_Start, m_SEF_sum);AP (Absolute Power) and RP (Relative Power)
Absolute Power
double remDetect::absPower(double *spectrum, int f_Start, int f_End)
{
    double sum_fft = 0;
    for (int i = FREQ_TO_BIN(f_Start, m_size_fft, m_Fs); i <= FREQ_TO_BIN(f_End, m_size_fft, m_Fs); i++) {
        sum_fft += spectrum[i] * ((double)m_Fs) / ((double)m_size_fft);
    }
    return ((double) 20.0 * log10(sum_fft));
}
Relative Power
double remDetect::relPower(double *spectrum, int f_Start, int f_End)
{
    double ratio_spectrum = 0;
    ratio_spectrum = absPower(spectrum, f_Start, f_End) - absPower(spectrum, 1, f_Max);
    return ratio_spectrum;
}
Decision Tree for REM Detection
int remDetect::evaluate_REM_Epoch()
{
    // If the SEFd value is bigger than the specified minimum
    if (avg_SEFd > m_min_SEFd) {
        // If the averaged Absolute power is smaller than specified maximum
        if (avg_AP < m_max_AP) {
            // If the averaged Relative power is between the specified interval
            if (avg_RP > m_min_RP && avg_RP < m_max_RP) {
                // REM DETECTED :D
                return 1;
            } else return 0;
        } else return 0;
    } else return 0;
}
Sources
Imtiaz, Syed Anas, and Esther Rodriguez-Villegas. "A low computational cost algorithm for rem sleep detection using single channel EEG." Annals of biomedical engineering 42.11 (2014): 2344-2359.
-
The Software: EEG REM Detection Overview
09/24/2016 at 18:18 • 0 commentsIn order to induce Lucid dreams, the program has to detect that the subject is dreaming (refer to the previous build log for more information). As dreaming occurs in Rapid Eye Movement (REM) sleep stage, the OpenLD detects this through EEG and EOG signals. Today, I will be talking about the EEG REM detection portion of the project.
The EEG REM Detection Algorithm Overview
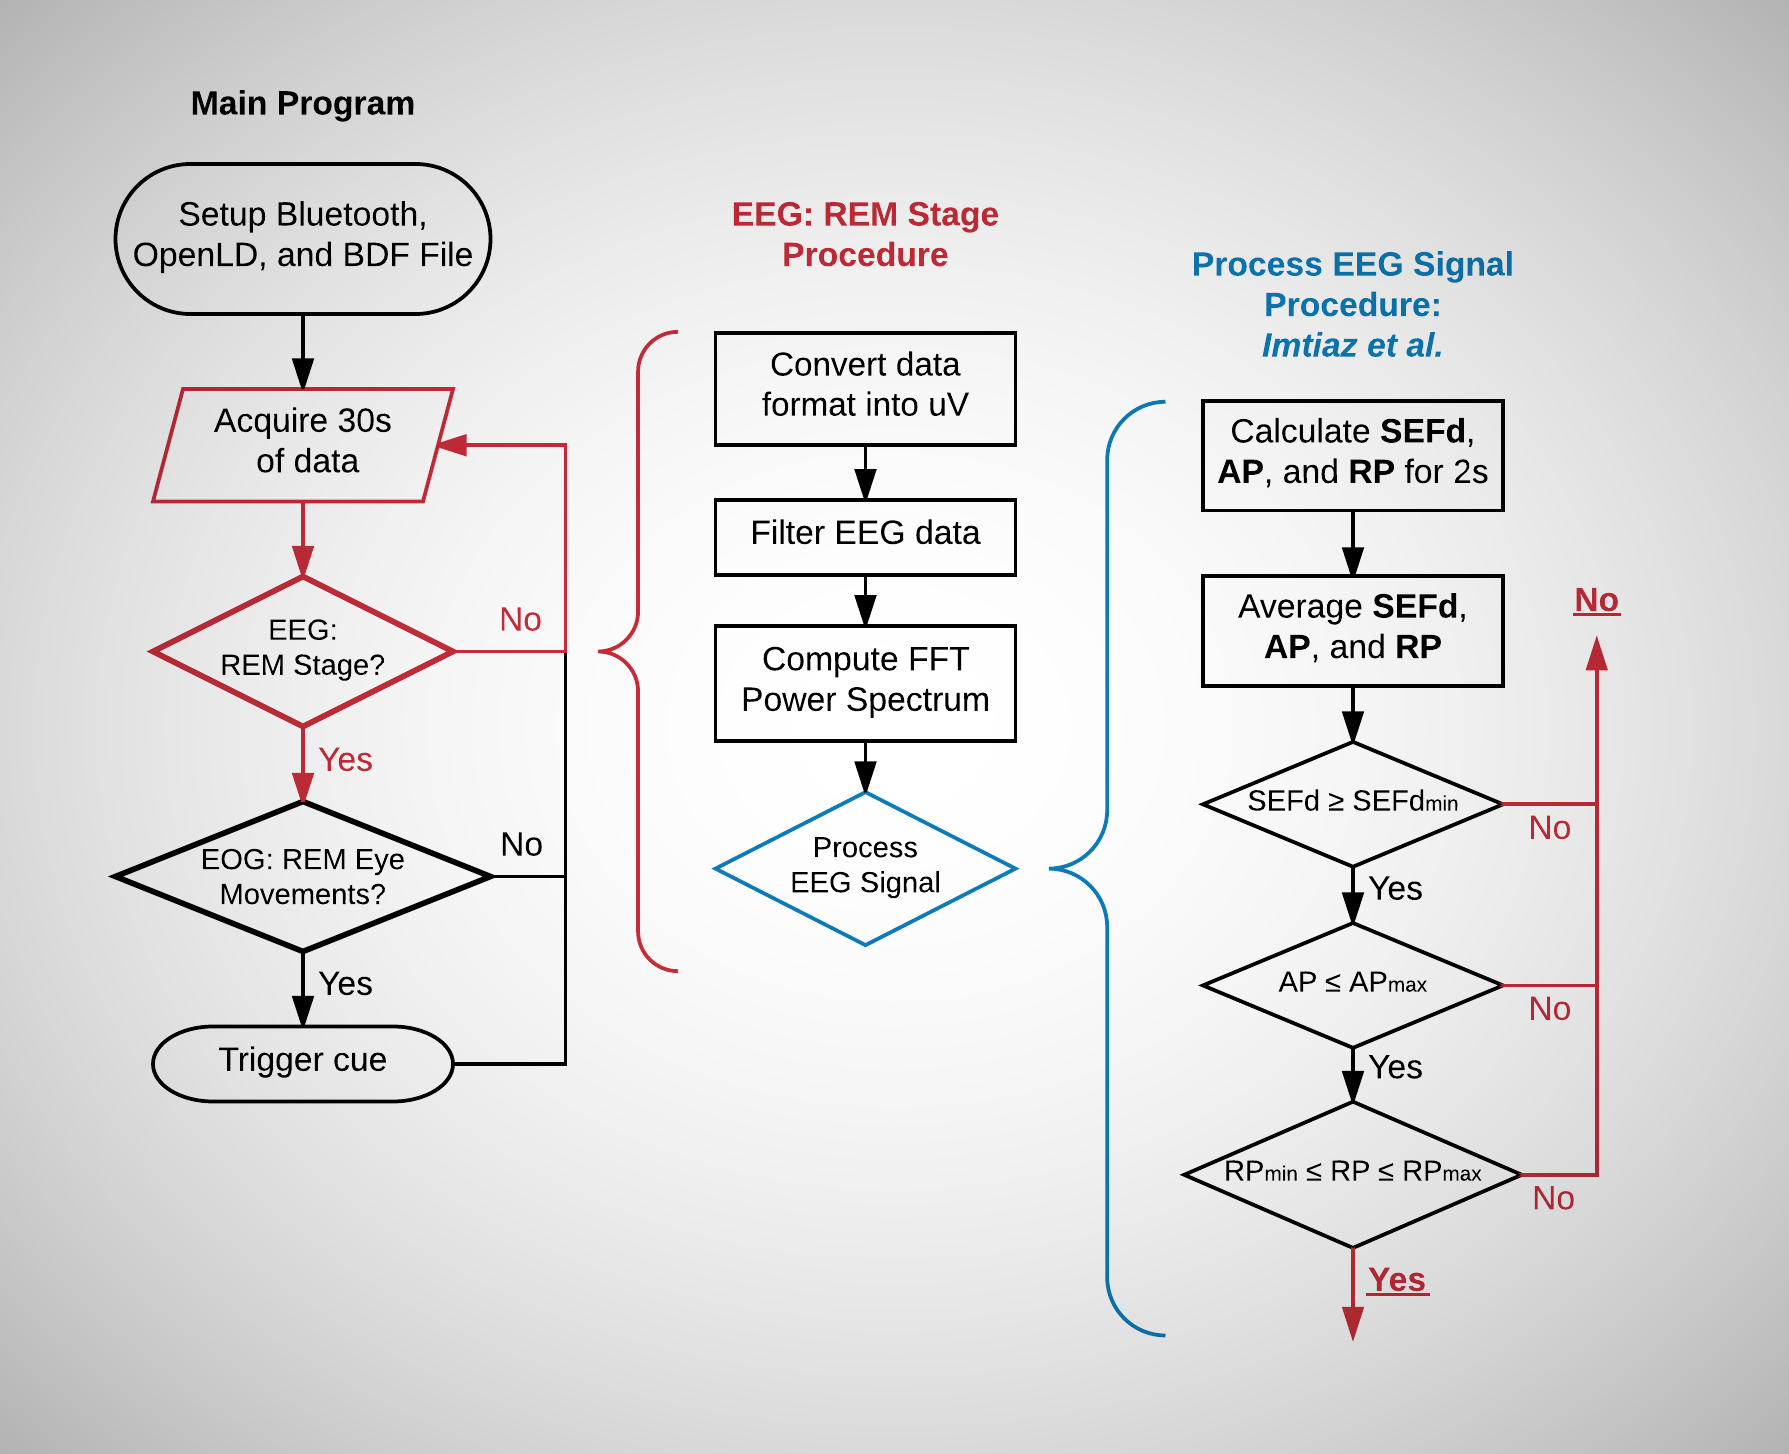
The OpenLD software uses an algorithm developed by Imtiaz et al. to detect REM state from the EEG signal. Detailed flowchart for this algorithm is shown below:
![]()
The Main Program section of the flowchart is identical to that of the previous Project Log. As I've explained before, the program has 2 verification steps (EEG: REM Stage and EOG: REM Eye Movements). This log will talk about the first EEG step of the verification process.
I've divided the flowcharts in an exploded, side-by-side view so that it wouldn't get too long and unreadable. The flowchart of the EEG: REM Stage is shown in the middle of the above diagram, while the flowchart for the Process EEG Signal step is shown on the far right.
Here is how the program works: After the initialization process, the program acquires 30 seconds of data from the OpenLD. Then, it converts the 24 bit raw data to the required micro-volts (uV) scale. Afterwards, it filters the scaled data with a bandpass filter with a pass-band of 0.3hz to 35hz. This filter helps to remove the voltage offset from the electrodes and mains 50hz/60hz noise.
Finally, the data is Fast Fourier Transformed and its power spectrum is calculated. Using the spectral information, the values SEFd (Spectral Edge Frequency), AP (Absolute Power), and RP (Relative Power) are determined. This statistical information is used to determine the REM sleep state of the EEG. More information about these values are explained below.
Mathematics of the REM Detection Algorithm
Note: If you do not like to delve into the mathematical details, you can ignore this discussion and skip to the next section: Decision Tree for REM Detection
The algorithm proposed by Imtiaz et al. relies on these three values: SEFd, RP, and AP. Although I give the general gist here, please refer to the paper for more information.
SEFd (Spectral Edge Frequency difference)
SEF basically is the "frequency below which a certain fraction of the signal power is contained". For example, "SEF at 50% (SEF50) is the lowest frequency below which half of the signal power is present" (Imtiaz et al.).
Here is the formula that calculates the value of SEF50. Here, the SEF50 value (x) is the frequency below of which it contains 50% of the power spectrum (Xi2) that ranges from f start to f end. (Imtiaz et al.).
and here is one for SEF95:
Here is the formula that calculates the value of SEFd. It is simply the difference between SEF95 and SEF50.
AP (Absolute Power) and RP (Relative Power)
Absolute Power is the logarithmic power spectrum from frequency fstart to fend. Its formula is given below:
Relative Power is "the ratio of the absolute powers of the signal in the range of interest and the entire signal bandwidth." (Imtiaz. et al). Since we are band-pass filtering our signal at 0.3hz to 35hz, that is our frequency bandwidth. The formula is shown below:
This is equivalent to the formula below. Remember your rule of logarithm division rule!:
Decision Tree for REM Detection
After the above calculations, the SEFd, AP, and RP values are compared against a set of constants to determine if the current signal is a REM state. If we go back to the flowchart above, we can see that there is a decision tree involving these constants.
In order for it to be an REM state:
- its SEFd value has to be bigger than SEF min constant
- its AP has to be smaller than AP max constant
- its RP value should be in between RP min and RP max constants.
If that is the case, then the subject is currently in REM state.
Now that was a rather tedious Project Log... I promise that things will now get much more exciting. In the next post, I will be talking about the actual code implementation of this algorithm and testing it out.
Sources
Imtiaz, Syed Anas, and Esther Rodriguez-Villegas. "A low computational cost algorithm for rem sleep detection using single channel EEG." Annals of biomedical engineering 42.11 (2014): 2344-2359.
-
First Recording of EEG, EOG, and ECG Signals!
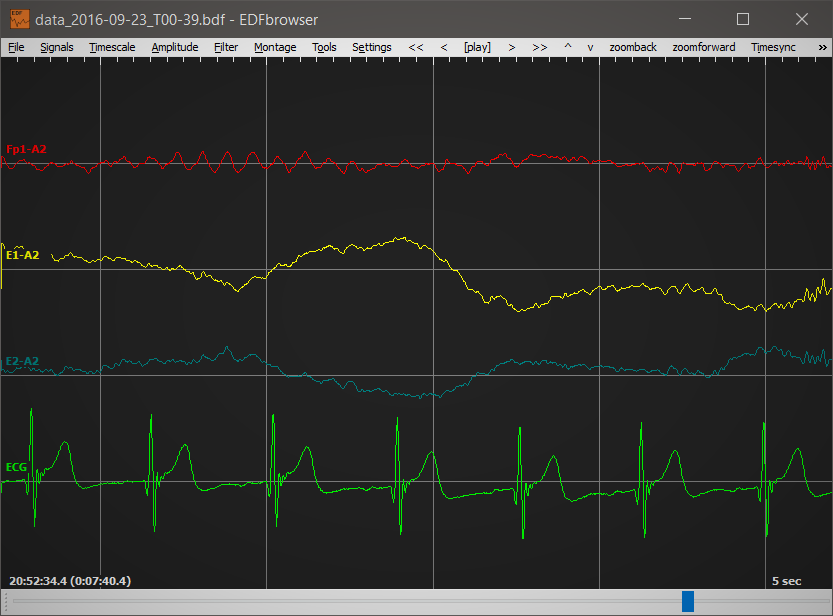
09/24/2016 at 14:25 • 0 commentsNow since both the OpenLD hardware and software are now more or less completed, here is a 5 second recording of EEG (Fp1-A2), EOG (E1-A2 and E2-A2), and ECG signals, viewed from an open-source software called EDFBrowser.
![]()
The signals were recorded when I was awake, with eyes closed. You can see the EEG Fp1-A2 electrode (red), EOG E1-A2 (left eye - yellow) / E2-A2 (right eye - blue) signals, and the ECG (Electrocardiogram - green) signal above.
Note: The reason we need two channels for EOG is due to the fact that the eye movements produce a complementary/out-of-phase signal. For instance, we can see that when the left eye E1-A2 (yellow) trace reflects upwards, the right eye E2-A2 (blue) trace reflects downwards. Other activity that is in-sync/in-phase is NOT eye movement activity.
In the next few Project Logs, I will talk about the implementation and the mathematics of the OpenLD Analysis porgram. Afterwards, I will hopefully post a full sleep recording and evaluate the REM detection performance of the software.
-
The Hardware: OpenLD Electrodes
09/24/2016 at 13:57 • 3 commentsOpenLD Passive and Active Electrodes
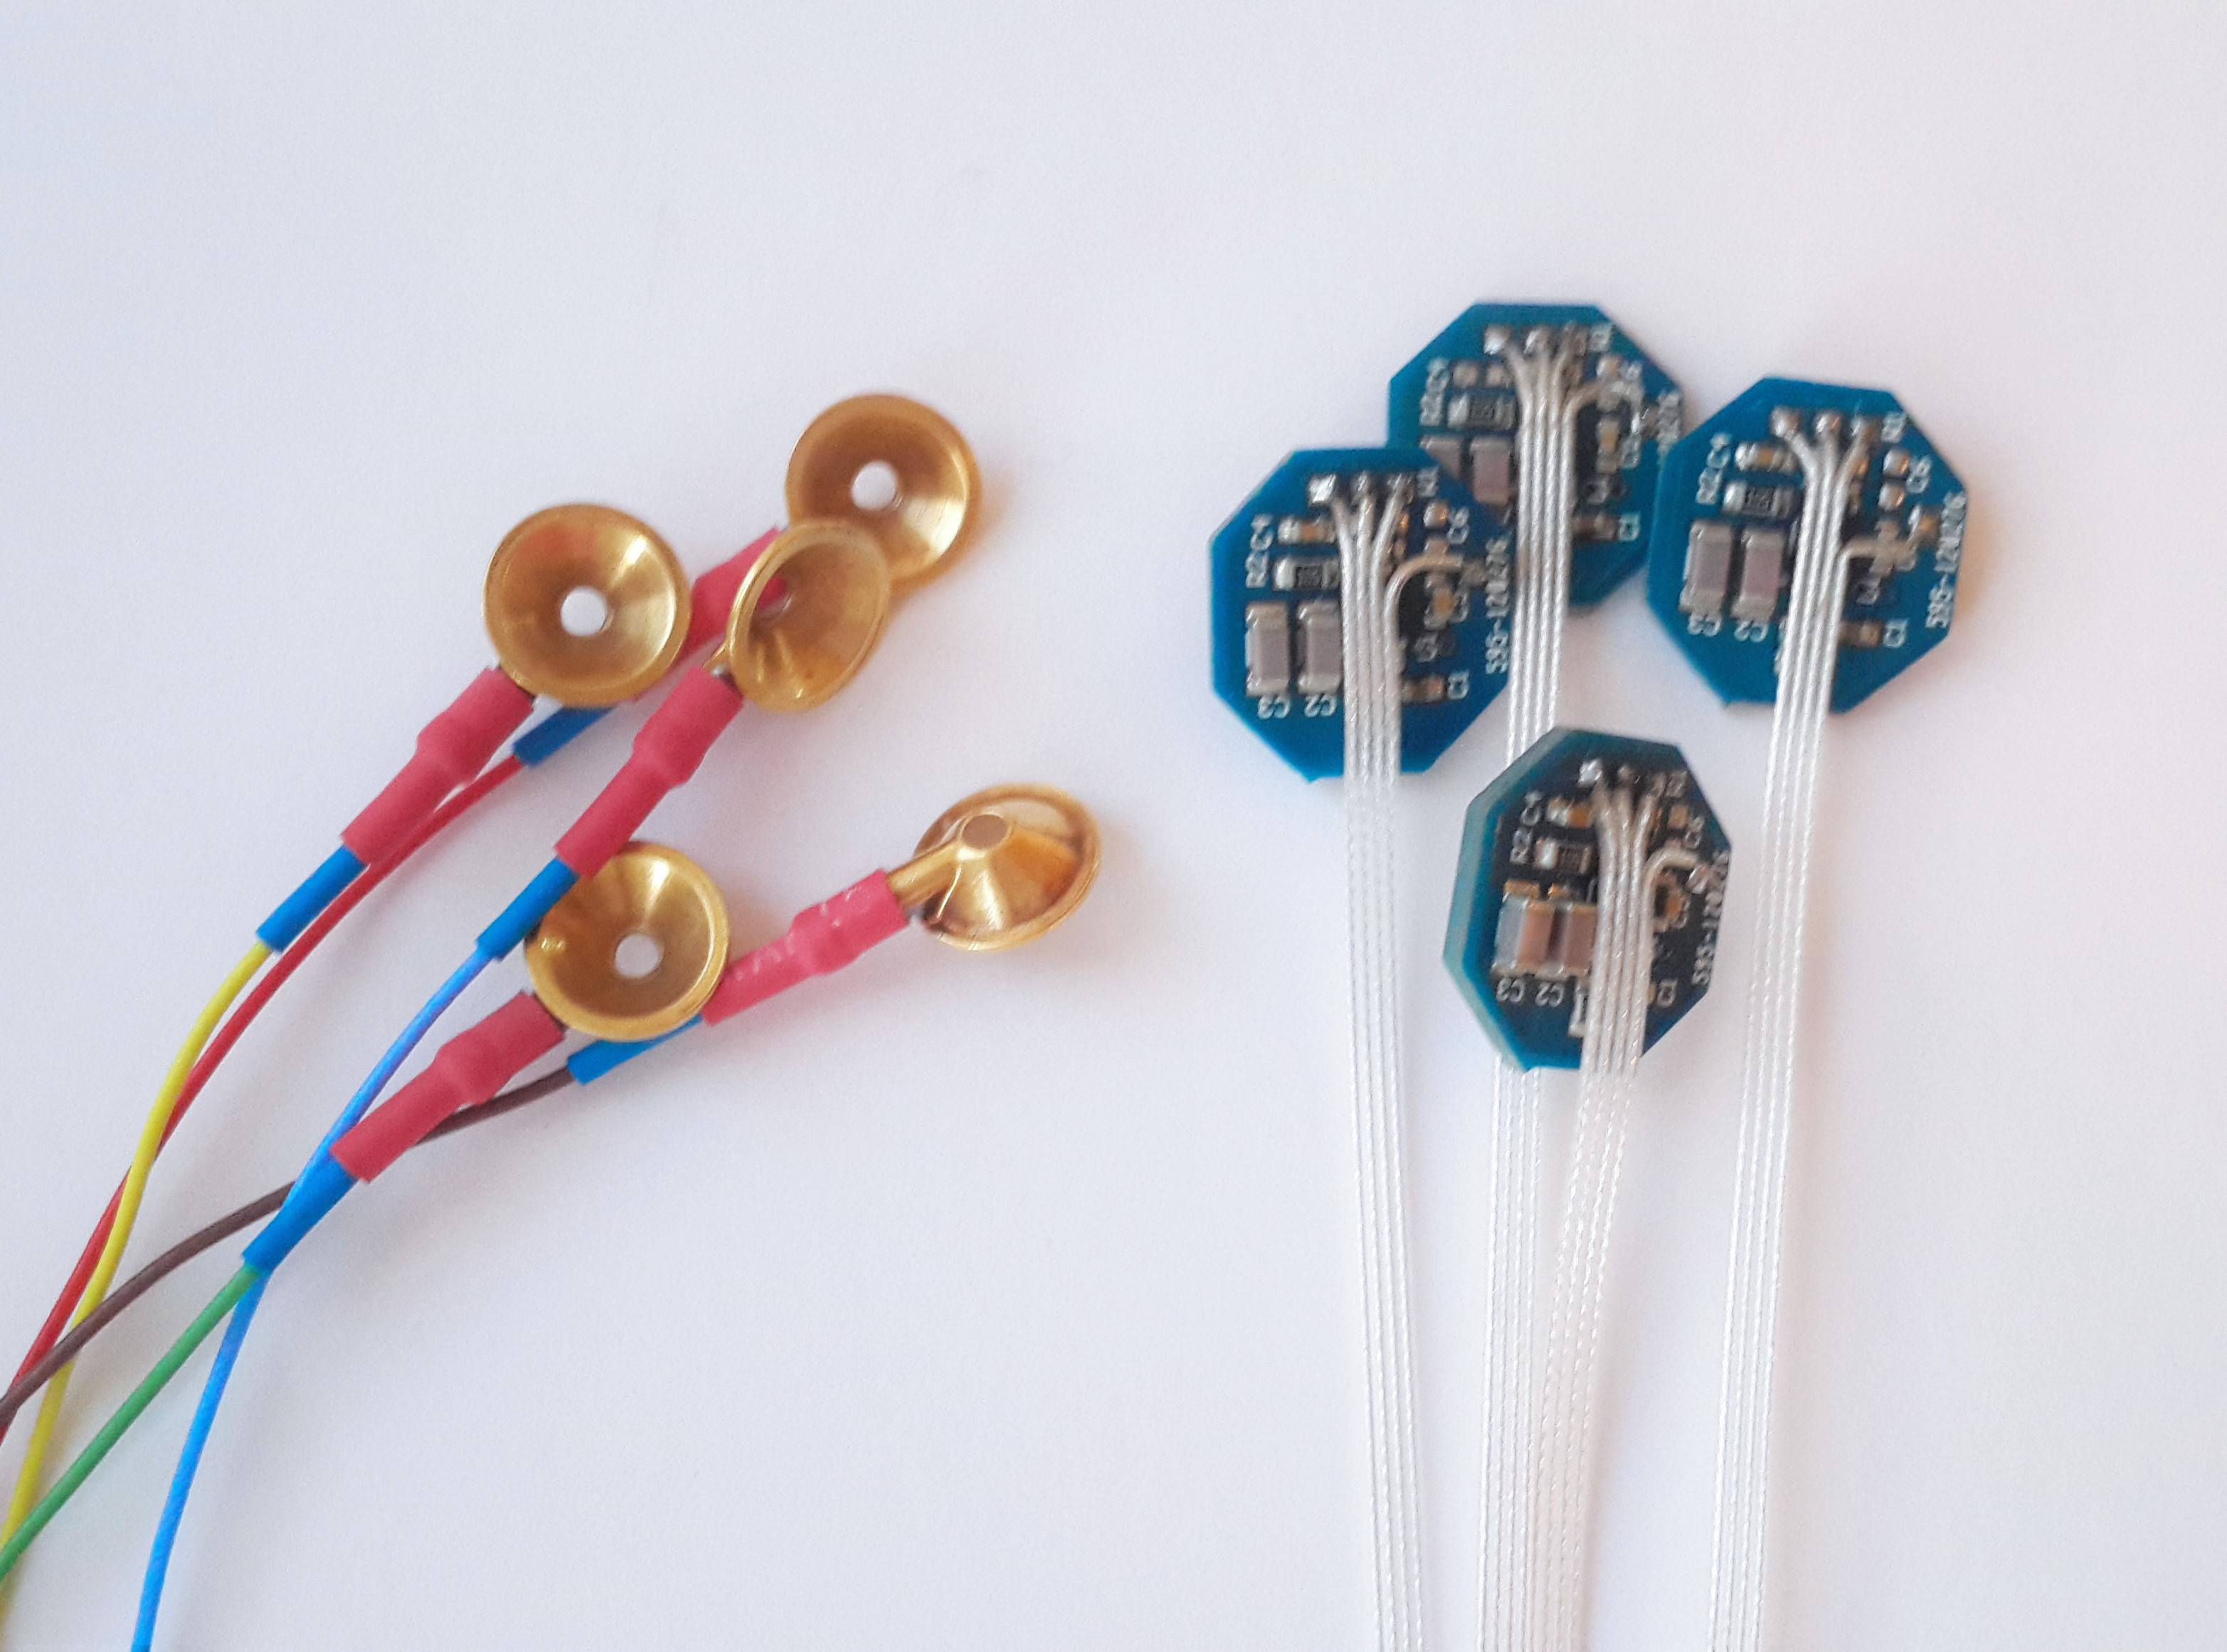
I've realized that I forgot to mention the type of electrodes I am using for the OpenLD hardware. Below is a picture of passive gold cup electrodes on the left and active electrodes on the right:
![]()
The main differences between these two type of electrodes is that the passive electrodes require skin preparation while the active electrodes do not.
The gold cup electrodes above need to be filled with a conductive electrode gel (I use a Ten20 paste) in order to reduce the electrode impedance. However, the active electrodes contain an on-board high-impedance amplifier (in a voltage follower configuration) and corresponding circuitry that takes care of the high impedance nature of the EEG signals.
As of right now, the active electrodes are working and provide excellent quality EEG/EOG signals. I will talk about the board layout and the schematics in a future Project Log. Although I am currently using passive electrodes, I will eventually transition to using the active electrodes in the near future. Stay tuned!
Electrode Placement for the OpenLD
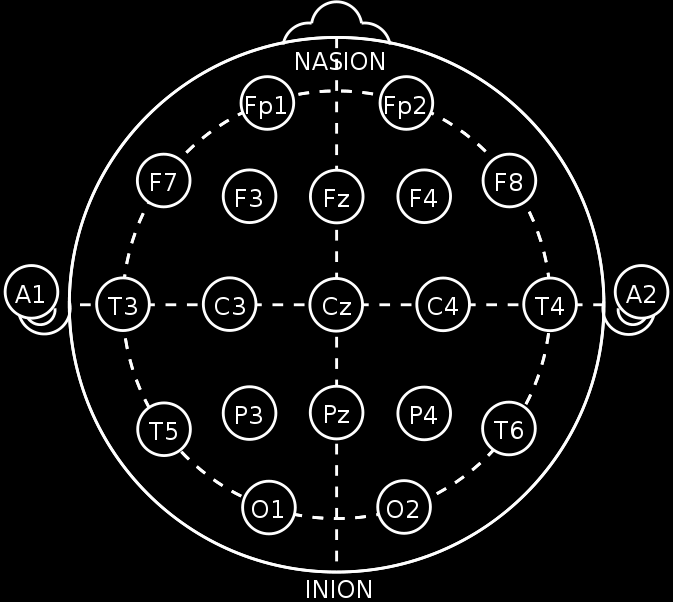
Here is a simple 10-20 diagram that shows the EEG electrode location sites. This figure was adapted from Wikipedia:
![]()
In order to detect REM sleep, the signals from the prefrontal cortex of the brain has to be measured. (Imtiaz et al.) Therefore, the positive (non-inverting) EEG electrode is placed on the location Fp1 above, which is on the left side of the forehead. Since differential amplifiers are being used, the negative (inverting) electrode is placed on the site A2, which is behind the right ear, as a reference. This EEG electrode setup is labeled as Fp1-A2.
Furthermore, EOG electrodes need to be placed in order to detect eye movements. Therefore, an E1 non-inverting electrode is placed 1 cm directly below the leftmost corner of the left eye. Also, an E2 electrode is placed 1 cm above the rightmost corner of the right eye. These electrodes, like the EEG Fp1 electrode, are referenced to A2 as well. They are labeled as E1-A2 and E2-A2.
![]()
The above diagram shows the placement of E1 / E2 electrodes and how eye movements translate into electrical signals in the EOG trace. This will be important later when we are examining the REM EOG signals. (Diagram adapted from Kerkhof, G. A., & Van Dongen, H. Human Sleep and Cognition: Basic Research)
We can now perform a sample recording. I will post an EEG/EOG/ECG recording in the next Project Log.
Sources:
Imtiaz, S. A., & Rodriguez-Villegas, E. (2014). A low computational cost algorithm for rem sleep detection using single channel EEG. Annals of biomedical engineering, 42(11), 2344-2359.
Kerkhof, G. A., & Van Dongen, H. (2010). Human Sleep and Cognition: Basic Research (Vol. 185). Elsevier.
OpenLD: Lucid Dreaming Research Platform
An open source platform to help induce and explore the realm of Lucid Dreaming for Research and Personal Well-being

 As you can see from the above figure, eye movements produce deflections which are always out of phase between the two EOG channels.